Quantitative Analysis of the ABCG2 c.421C>A Polymorphism Effect on In Vivo Transport Activity of Breast Cancer Resistance Protein (BCRP) Using an Intestinal Absorption Model
Abstract
ABCG2 c.421C>A is one of the most frequent polymorphisms in ABCG2, which encodes the breast cancer resistance protein (BCRP). Clinical pharmacogenetic studies have shown that the plasma area under the concentration–time curve (AUC) values after oral administration of BCRP substrate drugs are significantly higher in subjects homozygous for the c.421C>A polymorphism (421AA) than in wild-type subjects (421CC). The aim of this study was to quantitatively estimate the in vivo decrease of BCRP function caused by the c.421C>A polymorphism based on clinical pharmacokinetic data. Assuming that the pharmacokinetic alteration is accounted for by intestinal BCRP, the ratio of the transport activity of the mutated BCRP to that of the wild-type was optimized by comparing calculations from an intestinal absorption model and clinical pharmacokinetic data. In conclusion, the in vivo intestinal BCRP transport activity in 421AA subjects is estimated to be approximately 23% of that in the 421CC subjects. © 2015 Wiley Periodicals, Inc. and the American Pharmacists Association J Pharm Sci 104:3039–3048, 2015
INTRODUCTION
Breast cancer resistance protein (BCRP), encoded by the ABCG2 gene, belongs to the ATP-binding cassette family transporters, most of which actively pump out a variety of substrates from cells by utilizing energy from ATP hydrolysis. BCRP is so-called a half-transporter with six putative transmembrane domains and one ATP binding cassette, and functions as a homodimer.1, 2 BCRP transports structurally diverse compounds, including many clinically used drugs, such as anti-cancer drugs (imatinib and irinotecan), antivirals (lamivudine and zidovudine), and statins (pitavastatin and rosuvastatin).3 BCRP is expressed in various tissues, such as the gastrointestinal tract, liver, kidney, blood–brain barrier, and placenta, thereby limiting the intestinal absorption and tissue distribution of BCRP substrates.4 Several non-synonymous single nucleotide polymorphisms (SNPs) have been identified in the ABCG2 gene.2 The c.421C>A SNP located in the ATP binding domain is associated with an amino acid change (141Q>K), and has been the most extensively investigated because of its high allele frequency with a notable ethnic difference (Asians: 29%–36%, Europeans: 4.5%–12%, and Africans: 0%–2.3%).2
Several clinical studies have investigated the effect of c.421C>A in ABCG2 on the pharmacokinetics and subsequent pharmacological/toxicological effects of BCRP substrate drugs. For example, the plasma area under the concentration–time curve (AUC) values of sulfasalazine,5 simvastatin,6 and rosuvastatin7 were more than twofold higher in subjects with the 421AA compared with those with the 421CC genotype. This polymorphism was also significantly associated with the low-density lipoprotein-cholesterol lowering effect of rosuvastatin8 and the occurrence of diarrhea caused by gefitinib.9
Several studies have investigated the decrease in the apparent transport activity of mutated BCRP. Kondo et al.10 suggested that the intrinsic transport activity normalized by BCRP protein expression level was almost equal in membrane vesicles expressing wild-type and 141Q>K BCRP, which implies that reduced surface membrane BCRP expression might be a major cause of the apparent decrease in transport activity. This hypothesis is supported by reports demonstrating that placental BCRP expression in subjects with the 421AA genotype was approximately 50% of that in subjects with the 421CC genotype,11 and that liver samples obtained from subjects with at least one mutated (c.421C>A) allele showed significantly lower BCRP protein expression than those from subjects with the wild-type allele, as determined using liquid chromatography coupled with tandem mass spectrometry.12 Other researchers suggested that intrinsic transport activity was affected by the mutation as ATPase activity was lower in mutant 141Q>K BCRP as compared with the wild-type without decreasing BCRP protein expression.13, 14 Despite these efforts, the impact of ABCG2 c.421C>A on BCRP transport activity in vivo is still undetermined.
 (1)
(1)METHODS
Model for Intestinal Drug Absorption
 (2)
(2) (3)
(3) (4)
(4) (5)
(5) (6)
(6) (7)
(7)In Silico Prediction of Pdif
 (8)
(8)Determination of LF/S in Intestinal Drug Absorption Model
 (9)
(9)LF/S was optimized using Eq. 9 with the predicted Pdif and clinically observed FaFg values for 25 reference drugs with the non-linear least-squares method using the computer program “Napp” (version 2.31).21 The predicted Pdif and FaFg values of reference drugs are summarized in Supplementary Table S1.
Collection of Clinical Pharmacogenetic Data
Previous clinical pharmacogenetic studies investigating the effect of the ABCG2 c.421C>A polymorphism on the pharmacokinetics of 16 drugs (atorvastatin, fluvastatin, pitavastatin, pravastatin, rosuvastatin, simvastatin, diflomotecan, erlotinib, gefitinib, imatinib, telatinib, lamivudine, nitrofurantoin, sulfasalazine, sunitinib, and telmisartan) were collected by a search of the PubMed database (http://www.ncbi.nlm.nih.gov/pubmed) using the keywords “(mutation OR polymorphism OR variant) AND (BCRP OR ABCG2).” These reports satisfied the following criteria: (1) heterozygous and homozygous subjects were separately stratified, (2) the number of subjects for each genotype was greater than three, (3) plasma concentration of the unchanged form of the drug was reported (i.e., olmesartan medoxomil was excluded because plasma concentration was determined only for olmesartan and not for olmesartan medoxomil),22 and (4) drugs were administered orally as a conventional tablet or a suspension.16
Calculation of In Vivo FaFg,421CC Values
 (10)
(10) (11)
(11) (12)
(12) (13)
(13) (14)
(14) (15)
(15)Two pharmacogenetic studies of rosuvastatin have been performed in Caucasian7 and Chinese subjects.24 The Chinese study was excluded because of the absence of intravenous administration and ethnicity-related differences in the pharmacokinetics of rosuvastatin.25
The FaFg,421CC values of simvastatin, sunitinib, and telatinib could not be calculated because of the lack of pharmacokinetic information after intravenous administration. The RB values of sulfasalazine and diflomotecan were not reported. The RB of sulfasalazine was estimated using the human protein unbound fraction in plasma (fp) using a method reported by Uchimura et al.,26 whereas the RB of diflomotecan could not be estimated with the same method because of the lack of human fp data. There was no information that telmisartan was recognized by BCRP as a substrate. Thus, 11 out of 16 drugs were further analyzed in this study. The calculated Pdif, clinically observed FaFg,421CC for each BCRP substrate drug, and information about substrate recognition by BCRP are summarized in Table 1.
| BCRP substrates | Log D5.5a | PSA (Å2)b | HBDb | Pdifc (10−4 cm/s) | PBCRP,421CCd (10−4 cm/s) | Information about Substrate Recognition by BCRP |
|---|---|---|---|---|---|---|
| Atorvastatin | 4.8 | 112 | 3 | 1.6 | 99 | 27 |
| Fluvastatin | 3.5 | 83 | 2 | 3.1 | 0 | 27, 28 |
| Pitavastatin | 1.9 | 91 | 2 | 1.2 | 0 | 28 |
| Pravastatin | 1.3 | 124 | 3 | 0.25 | 0.28, 0.51 | 28, 29 |
| Rosuvastatin | 1.4 | 149 | 2 | 0.26 | 0.93 | 27, 28 |
| Erlotinib | 3.5 | 75 | 1 | 6.3 | 0 | 30 |
| Gefitinib | 1.9 | 86 | 2 | 1.4 | 6.6 | 30 |
| Imatinib | 1.4 | 69 | 1 | 2.9 | 0 | 31 |
| Lamivudine | −0.57 | 113 | 2 | 0.25 | 0.14 | 32 |
| Nitrofurantoin | −0.23 | 121 | 1 | 0.42 | 0 | 33 |
| Sulfasalazine | 2.6 | 150 | 2 | 0.44 | 14, 15 | 16 |
- HBD, number of hydrogen bond donor atoms; Log D5.5, distribution coefficient in octanol/water at pH 5.5; Pdif, passive diffusion coefficient; PSA, polar surface area.
- a Calculated by Pallas 3.0 software (CompuDrug).
- b Calculated by Discovery Studio 3.1.1 software (Accelrys).
- c Calculated by the equation reported by Winiwarter et al.34: log Pdif = −2.883–0.010 PSA + 0.192 log D5.5–0.239 HBD.
- d Calculated by Eq. 7.
Optimization of the Ratio of BCRP Transport Activity in Homozygous Mutation Carriers and Wild-Type Subjects (Ract,421C>A)
 (16)
(16) (17)
(17) (18)
(18)Assuming that the increase of plasma AUC in subjects with the 421AA genotype is solely accounted for by the increase of FaFg, Ract,421C>A was optimized with the observed AUC ratios421AA/CC and calculated FaFg ratios421AA/CC of 7 BCRP substrates with a non-linear least-squares method using the computer program “Napp” (version 2.31).21
Calculation of FaFg Ratio421CA/CC
 (19)
(19)RESULTS
Determination of a Parameter Related to Luminal Flow Rate (LF/S) for the Intestinal Model
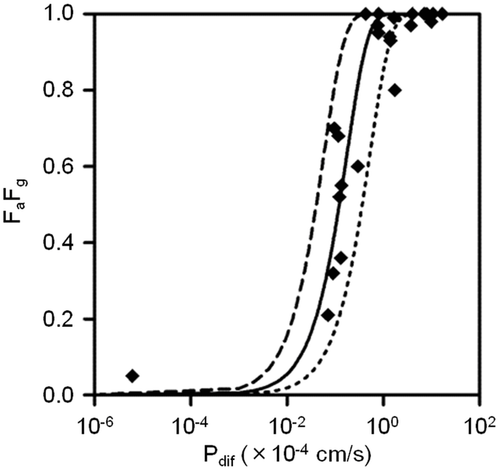
To quantitatively investigate the impact of c.421C>A on in vivo BCRP activity, an intestinal model was used as described in Methods section. The active transport by BCRP was included in this model, but those by other transporters and intestinal metabolism were neglected. The permeability coefficient of passive diffusion (Pdif) was calculated in silico from physicochemical properties. A parameter related to luminal flow rate (LF/S) was set by comparing FaFg with Pdif of 25 reference drugs predominantly absorbed by passive diffusion. The Pdif of the reference drugs was calculated from physicochemical parameters by using Eq. 8 (Supplementary Table S1 online). Then, LF/S was optimized by using Eq. 9 with 25 paired FaFg and Pdif values. The best-fitted curve was obtained when LF/S was set to 0.17 × 10⁻⁴ cm/s (Fig. 1).
Review of Clinical Pharmacogenetic Studies of BCRP
The clinical pharmacogenetic data of 16 drugs are summarized in Table 2. All studies satisfied the criteria described in Methods section. The AUC ratios of atorvastatin, fluvastatin, rosuvastatin, simvastatin, sulfasalazine, and sunitinib after oral administration were significantly greater than 1 in heterozygous or homozygous carriers of the ABCG2 c.421C>A allele. The AUCs of pitavastatin, pravastatin, diflomotecan, erlotinib, gefitinib, imatinib, telatinib, lamivudine, nitrofurantoin, and telmisartan were not significantly different between subjects with and without the mutated ABCG2 allele.
| ABCG2 Genotype | ||||||
|---|---|---|---|---|---|---|
| Drugs | Dose (mg) | 421CC | 421CA | 421AA | References | |
| Significant AUC increase in subjects with ABCG2 c.421C>A | ||||||
| Atorvastatin | 20 | N | 16 | 12 | 4 | |
| AUC ratio | 1 | 1.2 | 1.7* | 7 | ||
| T1/2 (h) | 12 | 11 | 12 | |||
| Fluvastatin | 40 | N | 23 | 4 | 5 | |
| AUC ratio | 1 | 0.88 | 1.7* | 6 | ||
| T1/2 (h) | 3.2 | 2.9 | 3.8 | |||
| N | 5 | 7 | – | |||
| AUC ratio | 1 | 1.1 | – | 37 | ||
| T1/2 (h) | 1.6 | 1.5 | – | |||
| Rosuvastatin | 20 | N | 16 | 12 | 4 | |
| AUC ratio | 1 | 1.2 | 2.4* | 7 | ||
| T1/2 (h) | 14 | 14 | 14 | |||
| 5–20 | N | 15 | 15 | 6 | ||
| AUC ratioa | 1 | 1.1 | 1.6* | 24 | ||
| T1/2 (h) | – | – | – | |||
| Simvastatin | 40 | N | 23 | 4 | 5 | |
| AUC ratio | 1 | 1.6* | 2.1* | 6 | ||
| T1/2 (h) | 2.7 | 3.8 | 4.2* | |||
| Sulfasalazine | 2000 | N | 12 | 16 | 9 | |
| AUC ratio | 1 | 1.9* | 3.5* | 5 | ||
| T1/2 (h) | 9.8 | 11 | 10 | |||
| 1000 | N | 9 | 5 | – | ||
| AUC ratio | 1 | 2.4* | – | 16 | ||
| T1/2 (h) | 4.2 | 4.8 | – | |||
| Sunitinib | 25–50 | N | 6 | 5 | – | |
| AUC ratiod | 1 | 1.8* | – | 38 | ||
| T1/2 (h) | – | – | – | |||
| No significant AUC difference in subjects with ABCG2 c.421C>A | ||||||
| Pitavastatin | 2 | N | 11 | 7 | 3 | |
| AUC ratio | 1 | 1.2 | 0.96 | 39 | ||
| T1/2 (h)b | 12 | 12 | 14 | |||
| Pravastatin | 40 | N | 23 | 4 | 5 | |
| AUC ratio | 1 | 1.3 | 0.88 | 6 | ||
| T1/2 (h) | 1.7 | 1.8 | 2 | |||
| N | 94 | 13 | – | |||
| AUC ratio | 1 | 0.86 | – | 40 | ||
| T1/2 (h) | – | – | – | |||
| Erlotinib | 150 | N | 66 | 13 | – | |
| AUC ratio | 1 | 1.2 | – | 41 | ||
| T1/2 (h) | – | – | – | |||
| Gefitinib | 250 or 500 | N | 20 | 7 | – | |
| AUC ratioa | 1 | 1.2 | – | 30 | ||
| T1/2 (h) | – | – | – | |||
| Imatinib | 100–1000 | N | 66 | 16 | – | |
| AUC ratioc | 1 | 1 | – | 31 | ||
| T1/2 (h) | – | – | – | |||
| Telatinib | 150 | N | 23 | 6 | – | |
| AUC ratio | 1 | 1.2 | – | 42 | ||
| T1/2 (h) | – | – | – | |||
| Diflomotecan | 0.1–0.35 | N | 15 | 5 | – | |
| AUC ratioa | 1 | 1.2 | – | 43 | ||
| T1/2 (h) | 3.4 | 3.8 | – | |||
| Lamivudine | 100 | N | 7 | – | 6 | |
| AUC ratio | 1 | – | 1.1 | 32 | ||
| T1/2 (h) | 5.5 | – | 7.7 | |||
| Nitrofurantoin | 100 | N | 12 | 12 | 12 | |
| AUC ratio | 1 | 1.1 | 1.1 | 44 | ||
| T1/2 (h) | 0.78 | 0.76 | 0.72 | |||
| Telmisartan | 40 | N | 30 | 15 | 3 | |
| AUC ratio | 1 | 1.1 | 1.2 | 45 | ||
| T1/2 (h) | 18 | 16 | 21 | |||
- N, number of subjects; AUC ratio, the ratio of area under the plasma concentration–time curve (AUC) values in ABCG2 c.421C>A to wild-type (421CC) subjects; T1/2, elimination half-life; kel, elimination rate constant; –, data were not reported.
- a AUC ratio was calculated using the dose-normalized AUC value.
- b T1/2 values of pitavastatin were calculated using the equation: ln2/kel.
- c AUC ratio of imatinib was calculated from the apparent oral clearance.
- d AUC ratio of sunitinib was calculated using the median dose-normalized AUC value obtained from a graph.
- *Significantly different from values in wild-type (421CC) subjects as determined by each report (p < 0.05).
Pharmacokinetic parameters of 16 drugs, including FaFg, in subjects with the 421CC genotype (FaFg,421CC) were determined as described in Methods section and are summarized in Table 3. Five drugs (simvastatin, sunitinib, diflomotecan, telatinib, and telmisartan) were excluded from further analysis because of a lack of information, such as intravenous pharmacokinetic data, human protein unbound fraction in plasma, or substrate recognition by BCRP (see Methods section). Consequently, 11 BCRP substrates (atorvastatin, fluvastatin, pitavastatin, pravastatin, rosuvastatin, erlotinib, gefitinib, imatinib, lamivudine, nitrofurantoin, and sulfasalazine) were further analyzed.
| Drugs | CLtot (L*h−1*kg−1) | CLr (L*h−1*kg−1) | CLh (L*h−1*kg−1) | CLoral,421CC (L*h−1*kg−1) | RB | F421CC | Fh,421CC | FaFg,421CC | References |
|---|---|---|---|---|---|---|---|---|---|
| Atorvastatin | 0.52a, b | 0a, e | 0.52 | 11 | 0.61 | 0.045 | 0.32 | 0.14 | 7, 46 |
| Fluvastatin | 0.50b | 0e | 0.50 | 1.4 | 0.52 | 0.36 | 0.22 | 1h | 6, 46, 47 |
| 1.0b | 0.51 | 1h | 37 | ||||||
| Pitavastatin | 0.34c | 0a, e | 0.34 | 0.43 | 0.58 | 0.98 | 0.52 | 1h | 39, 46 |
| Pravastatin | 0.81 | 0.38 | 0.43 | 4.3 | 0.56 | 0.19 | 0.38 | 0.50 | 6, 46, 48 |
| 5.6 | 0.15 | 0.38 | 40 | ||||||
| Rosuvastatin | 0.63 | 0.18 | 0.46 | 4.8 | 0.69 | 0.13 | 0.47 | 0.28 | 7, 49 |
| Simvastatin | – | N.C. | N.C. | N.C. | 0.57 | N.C. | N.C. | N.C. | 50 |
| Erlotinib | 0.046b, d | 0a, e | 0.046 | 0.043b | 0.79 | 1g | 0.95 | 1h | 41 |
| Gefitinib | 0.43a, b | 0a, e | 0.43 | 1.1 | 0.76 | 0.41 | 0.55 | 0.75 | 30, 51 |
| Imatinib | 0.20a, b | 0.010a | 0.19 | 0.14b | 0.74 | 1g | 0.79 | 1h | 31, 52 |
| Telatinib | – | N.C. | N.C. | N.C. | – | N.C. | N.C. | N.C. | |
| Diflomotecan | 0.31b | 0.027 | 0.28 | 0.41b | – | 0.76 | N.C. | N.C. | 43 |
| Lamivudine | 0.33 | 0.21 | 0.12 | 0.60 | 1.0 | 0.56 | 0.91 | 0.60 | 32, 53, 54 |
| Nitrofurantoin | 0.59b | 0.27b | 0.32 | 0.63 | 0.76 | 0.94 | 0.66 | 1h | 44, 55 |
| Sulfasalazine | 0.014a, b | 0.0053a | 0.0090 | 0.20b | 0.57f | 0.073 | 0.99 | 0.074 | 5 |
| 0.20b | 0.070 | 0.071 | 16 | ||||||
| Sunitinib | – | N.C. | N.C. | N.C. | – | N.C. | N.C. | N.C. | |
| Telmisartan | 0.75a, b | 0a, e | 0.75 | 0.22b | 1.2 | 1g | 0.51 | 1h | 45, 56 |
- CLtot, total clearance; CLr, renal clearance; CLh, hepatic clearance; CLoral,421CC, oral clearance in wild-type subjects; RB, blood-to-plasma concentration ratio; F421CC, absolute bioavailability in wild-type subjects; Fh,421CC, hepatic availability in wild-type subjects; FaFg,421CC, intestinal availability in wild-type subjects; N.C., not calculated; –, data were not reported.
- a Data were obtained from manufacturer's information.
- b Body weights of subjects were assumed to be 70 kg.
- c cCLtot of pitavastatin was calculated by multiplying the oral clearance at 2 mg by the absolute bioavailability estimated in the manufacturer's information.
- d dCLtot of erlotinib was calculated by multiplying the oral clearance at 150 mg by the absolute bioavailability given in the manufacturer's information.
- e eCLr was treated as 0 when the urinary excretion ratio was less than 0.05.
- f fRB was calculated based on a method reported by Uchimura et al.26 using the human protein unbound fraction in plasma (0.007) given in the manufacturer's information.
- g gF values were treated as 1 when the calculated F values were greater than 1.
- h FaFg values were treated as 1 when the calculated FaFg values were greater than 1.
Quantitative Impact of ABCG2 c.421C>A on In Vivo Transport Activity of Intestinal BCRP
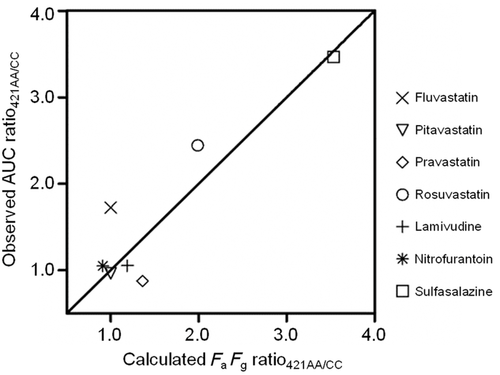
The impact of ABCG2 c.421C>A on in vivo transport activity of intestinal BCRP was estimated using the clinical pharmacokinetic data of 7 BCRP substrates (fluvastatin, pitavastatin, pravastatin, rosuvastatin, lamivudine, nitrofurantoin, and sulfasalazine; see Methods section). Assuming that the increase in AUC is solely caused by the increase of FaFg owing to decreased function of mutated (c.421C>A) BCRP, the AUC ratio421AA/CC should be equivalent to the FaFg ratio421AA/CC. Ract,421C>A was optimized by using 7 sets of FaFg ratios421AA/CC calculated with Eq. 18 and AUC ratios421AA/CC from clinical data. The best correlation was obtained when Ract,421C>A was 0.23 (Fig. 2).
Calculation of FaFg Ratios in Heterozygotes Using Optimized Ract,421C>A
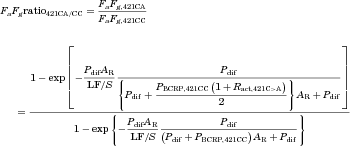
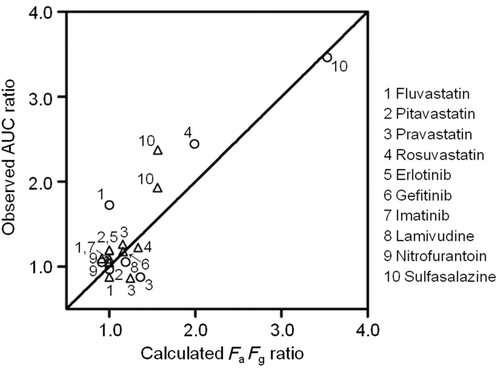
The FaFg of heterozygous (421CA) subjects relative to that of wild-type (421CC) subjects (FaFg ratio421CA/CC) was calculated with Eq. 21 using Ract,421C>A optimized with data from homozygous subjects. Most calculated FaFg ratios correlated well with clinically observed AUC ratios even when data from heterozygous subjects were analyzed (Fig. 3).
DISCUSSION
The ABCG2 c.421C>A mutation has been shown to alter the pharmacokinetics of BCRP substrates in several clinical reports. However, the extent to which ABCG2 c.421C>A affects in vivo BCRP efflux transport activity remains unknown. In this study, we developed a method to quantitatively estimate the decrease in mutated (c.421C>A) BCRP function in the intestine. The optimized Ract,421C>A was determined to be 0.23 by comparing the calculated FaFg ratios421AA/CC with clinically observed AUC ratios421AA/CC, suggesting that in vivo intestinal BCRP transport activity in 421AA subjects is approximately 23% of that in 421CC subjects. This result was consistent with the previous in vitro and ex vivo studies, which demonstrated that the mutated BCRP protein has lower apparent transport activity than the wild-type protein,10, 13, 31, 57 and that subjects with this polymorphism have a lower BCRP protein expression level.11, 12
 (22)
(22)The physiological LF/S was calculated to be 0.012–0.025 × 10⁻⁴ cm/s, which is 6–15-fold lower than the optimized LF/S. However, it made a marginal difference in the estimation of Ract,421C>A because the estimated Ract,421C>A was 0.27 even when the lowest physiological LF/S (0.012 × 10⁻⁴ cm/s) was used instead of the optimized value (0.17 × 10⁻⁴ cm/s).
Two assumptions were used to estimate the effect of ABCG2 c.421C>A on in vivo intestinal BCRP transport activity. The first assumption was that the AUC increase in subjects with the mutated BCRP is solely accounted for by the FaFg increase. The relationship between AUC ratio421AA/CC and FaFg,421CC for each drug is shown in Figure 4a. Drugs with a high AUC ratio421AA/CC had low FaFg,421CC values. The clinically observed AUC ratios421AA/CC were lower than the 1/FaFg curve. The curve shows the AUC ratio421AA/CC with the assumption that FaFg is equal to 1 in homozygous mutation carriers and that systemic and renal clearance is not affected by the mutation. Figure 4b shows a similar tendency for heterozygous mutation carriers, where the 1/FaFg curve was replaced with a (1 + 1/FaFg)/2 curve, assuming the decrease of BCRP activity in heterozygotes was the average of those in homozygotes for the wild-type and mutant alleles. These results should be provided if the first assumption is appropriate. Moreover, the half-life (T1/2) values of all drugs, except simvastatin, were not significantly affected by the BCRP mutation (Table 2), suggesting that the change of intestinal absorption is responsible for the AUC increase as the T1/2 values should be higher if hepatic or renal BCRP is responsible for the decrease in the systemic clearance and thereby the increase in the plasma AUC. Therefore, it is likely that the increased AUC in subjects with the 421AA genotype is mainly because of the increase in FaFg.
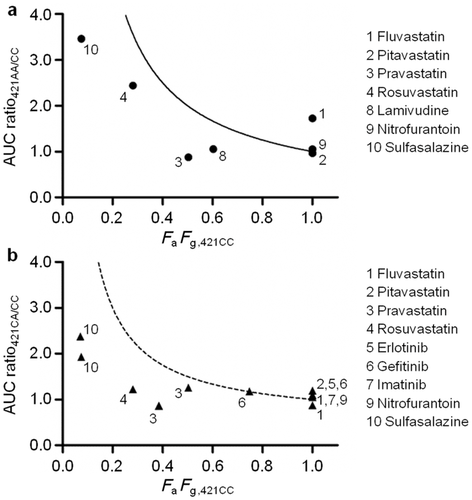
The second assumption was that intestinal metabolism and the contribution of influx and efflux transporters other than BCRP are negligible in the overall intestinal absorption process from the lumen to the portal vein. The impact of intestinal metabolism, apical influx transport, apical efflux transport not mediated by BCRP, and basolateral efflux transport on the optimization of Ract,421C>A were investigated by sensitivity analysis (see Supplementary Data 1 online). The results suggested that apical influx transport and basolateral efflux transport made a small difference in the FaFg ratios421AA/CC calculation, as long as Pdif was higher than 0.24 × 10⁻⁴ cm/s (Supplementary Fig. S1 online). Actually, the Pdif of each drug investigated in this study was higher than 0.24 × 10⁻⁴ cm/s. On the other hand, the involvement of intestinal metabolism and apical efflux transport not mediated by BCRP could over-estimate the functional change caused by the mutation. However, BCRP should be mainly involved in the apical efflux of the drugs used in this study, and an involvement of intestinal metabolism in intestinal absorption has not been reported for any of the drugs, except for atorvastatin. A further analysis was conducted after the intestinal model was modified to address the intestinal metabolism of atorvastatin (see Supplementary Data 2 online). The FaFg ratio calculated with the modified model was similar to the clinically observed AUC ratio (Supplementary Fig. S2 online).
Based on Ract,421C>A estimated in this study, the maximum extent of AUC increase caused by ABCG2 c.421C>A can be predicted if the FaFg value of a BCRP substrate is available. The AUC increase for erlotinib, gefitinib, and imatinib, with FaFg,421CC values of 1, 0.75, and 1, respectively, was only 1-, 1.3-, and 1-fold at a maximum, respectively. A pharmacogenetic study showed that the c.421C>A polymorphism was not associated with gefitinib skin toxicity, but it was associated with diarrhea.9 Skin toxicity and diarrhea would be associated with the plasma concentration and the intestinal concentration of gefitinib, respectively. The lacking association between skin toxicity and the mutation is consistent with the small increase in the AUC predicted by our method. In contrast, the drug concentration in intestinal epithelial cells can be much higher in homozygous mutation carriers than in wild-type subjects because decreased BCRP function can affect the concentration in intestinal epithelial cells even when FaFg is not affected. However, it should be noted that some clinical studies showed opposite results. Akasaka et al. and Tamura et al. reported that the c.421C>A polymorphism was not associated with diarrhea.61, 62
CONCLUSIONS
This study showed that in vivo intestinal BCRP transport activity of the homozygous subjects (421AA) was approximately 23% of that in wild-type (421CC) subjects. To our knowledge this is the first report, which tries to estimate the impact of the ABCG2 c.421C>A polymorphism on intestinal BCRP transport activity in vivo.


