Development of In Vitro–In Vivo Correlation for Amorphous Solid Dispersion Immediate-Release Suvorexant Tablets and Application to Clinically Relevant Dissolution Specifications and In-Process Controls
Abstract
Although in vitro–in vivo correlations (IVIVCs) are commonly pursued for modified-release products, there are limited reports of successful IVIVCs for immediate–release (IR) formulations. This manuscript details the development of a Multiple Level C IVIVC for the amorphous solid dispersion formulation of suvorexant, a BCS class II compound, and its application to establishing dissolution specifications and in-process controls. Four different 40 mg batches were manufactured at different tablet hardnesses to produce distinct dissolution profiles. These batches were evaluated in a relative bioavailability clinical study in healthy volunteers. Although no differences were observed for the total exposure (AUC) of the different batches, a clear relationship between dissolution and Cmax was observed. A validated Multiple Level C IVIVC against Cmax was developed for the 10, 15, 20, 30, and 45 min dissolution time points and the tablet disintegration time. The relationship established between tablet tensile strength and dissolution was subsequently used to inform suitable tablet hardness ranges within acceptable Cmax limits. This is the first published report for a validated Multiple Level C IVIVC for an IR solid dispersion formulation demonstrating how this approach can facilitate Quality by Design in formulation development and help toward clinically relevant specifications and in-process controls. © 2015 Wiley Periodicals, Inc. and the American Pharmacists Association J Pharm Sci 104:2913–2922, 2015
INTRODUCTION
Dissolution assays represent the most commonly pursued quality control release test for oral drug products. Although traditionally the main focus of dissolution tests has been to ensure the reproducibility of manufacturing of a given drug product, an increasing emphasis has recently been placed on establishing a link between product characteristics, dissolution, and clinical formulation performance under the Quality by Design (QbD) paradigm.1 The establishment of an in vitro–in vivo correlation (IVIVC) is considered the gold standard in achieving this translation of in vitro dissolution to pharmacokinetic response. An established IVIVC allows pharmaceutical scientists to directly assess the clinical performance impact of any formulation/manufacturing variations both during formulation development as well as after launch during commercial manufacturing. The benefits of IVIVCs are reflected in available Regulatory Guidance Documents in which it is outlined how IVIVC data can be used to set dissolution specifications and under certain circumstances to serve as a surrogate for in vivo bioequivalence studies.2-4
Available Regulatory Guidances2-4 and previous literature reports5, 6 detail the different levels of IVIVC. However, available guidances and most examples published in the literature focus on modified-release (MR) formulations. Reports of IVIVCs for immediate-release (IR) formulations are much less common. Nonetheless, with the majority of oral formulations being IR dosage forms, a clear need exists to understand the possibility of establishing IVIVCs for those to better inform specification settings. More recent publications have discussed the link between the Biopharmaceutics Classification System (BCS) Classification and likelihood of establishing an IVIVC.7, 8 BCS II compounds are considered the most likely drug candidates to be successful in establishing an IVIVC. As the permeability does not impose a limitation to absorption of a BCS Class II active pharmaceutical ingredient (API), there is an increased likelihood that the dissolution of the dosage form will dictate the pharmacokinetic profile. Still, there are very few demonstrated examples of BCS II/IV compounds where IVIVC was established after a systematic evaluation of a dissolution response from different formulations in the clinic.9-11 Furthermore, in more recent years, the increase of poorly soluble compounds in drug development paradigms have led to an increase in the adoption of solubilization technologies such as amorphous solid dispersions to increase absorption and thus oral bioavailiability of poorly soluble BCS II and IV compounds.12 Understanding the link between dissolution and in vivo performance is equally critical for these enabled dosage forms. To date, no controlled studies toward IVIVCs for a solid dispersion have been published.
In this manuscript, we detail the establishment of a Multiple Level C IVIVC for dissolution and a Level C IVIVC for disintegration for the IR solid dispersion formulation of suvorexant. Suvorexant (MK-4305) is an orexin receptor antagonist that was recently approved for the treatment of insomnia in the United States. Suvorexant is classified as a BCS Class II (low solubility, high permeability) compound. To maximize bioavailability, it is formulated as an amorphous solid dispersion prepared by hot-melt extrusion. The proposed dissolution mechanism for the solid dispersion tablet is a rate-determining erosion-based disintegration of the tablet cores, leading to generation of the solid dispersion particles that subsequently undergo fast dissolution. During formulation development, it became apparent that tablet compression had a significant effect on the erosion/disintegration time of suvorexant tablets and the resulting dissolution profile. By dictating this first step in the dissolution process, compression of tablets to different target hardnesses resulted in significant differences in the measured dissolution profiles. A clinical study was conducted comparing the pharmacokinetics with 40 mg tablets prepared at different hardness values to understand the clinical relevance of the observation and facilitate the development of IVIVC. In the manuscript, we detail the establishment of IVIVC for both disintegration and dissolution data and the subsequent application of the IVIVC model in combination with the characterized relationship between tablet tensile strength and dissolution to inform dissolution specifications and tablet hardness in process controls in a QbD setting.
METHODS
Formulation
The excipients used in the formulation of suvorexant include polyvinylpyrrolidone/vinyl acetate copolymer (copovidone), microcrystalline cellulose, lactose monohydrate, croscarmellose sodium, and magnesium stearate. The amorphous solid dispersion is prepared by hot-melt extrusion. The final tablets are film coated. To modify the apparent dissolution rate of suvorexant for the IVIVC study, the tablet tensile strength was controlled during manufacture through the tablet hardness that was measured as an in-process control. The following batches were manufactured: Batch A (hardness = 14.8 kP; tensile strength = 1.05 MPa), Batch C (hardness = 22.1 kP; tensile strength = 1.65 MPa), Batch D (hardness = 32.0 kP; tensile strength = 2.49 MPa), and Batch E (hardness = 38.1 kP; tensile strength = 3.03 MPa). Forty milligram potency tablets were used for the study representing the highest tablet potency considered at that stage of product development. Batch C was representative of Phase III supplies and was used as the reference for geometric mean ratio (GMR) calculations and for establishment of specifications. Given the compositional proportionality of suvorexant tablets in the 15–40-mg range discussed in this manuscript, the IVIVC established at the highest potency could be applied to the lower strengths.
Disintegration Measurements
Disintegration testing was performed according to United States Pharmacopeia (USP) compendial test <701> in USP Water; n = 6 representative tablets per formulation were tested.
Dissolution Method
The dissolution procedure for suvorexant tablets used a USP Apparatus II with a paddle speed of 75 rpm. A volume of 900 mL of dissolution medium was used. The dissolution medium was 0.4% sodium dodecyl sulfate (SDS) in USP water controlled at 37°C. The surfactant concentration was chosen above the critical micelle concentration of SDS to allow for sufficient solubility of the amorphous and crystalline form of the API and produce reproducible dissolution performance. Further, selection of this media provided adequate sample stability by preventing crystallization or the drug out of solution during the dissolution studies. Samples were removed from the dissolution vessels at time intervals of 10, 15, 20, 30, 45, and 60 min. For the IVIVC development, dissolution profiles were generated using n = 12 tablets per batch and were generated from drug product supplies stored, packaged, and handled identical to supplies used in the IVIVC clinical study.
Clinical Evaluation of Suvorexant Batches
The developed suvorexant batches were evaluated in a Phase I clinical study. The goal of the study was to establish a Level C/Multiple Level C correlation. This was a randomized, open-label, four-period, crossover study to evaluate the comparative pharmacokinetics of the four batches of suvorexant administered orally as single doses in a panel of healthy subjects. Study was conducted following appropriate Institutional Review Board (IRB) approval. Twelve subjects were enrolled in and completed this study. In each period, subjects received one of four batches as a single oral dose of 40 mg suvorexant in a randomized fashion: Batch “A,” Batch “C,” Batch “D,” and Batch “E”. In each treatment period, study drug was given following an overnight fast. All doses of study drug were administered with approximately 240 mL of water, with water restricted for 1 h before and 1 h after study drug administration.
There was a minimum 5-day washout between study drug administrations in each treatment period. All randomized subjects participated in all periods. Safety was monitored throughout the study by clinical and laboratory evaluations. Blood was collected for pharmacokinetic evaluation at predose in each treatment and at specified time points: 0.25, 0.5, 1, 1.5, 2, 3, 4, 5, 6, 8, 12, 16, 24, 48, and 72 h postdose.
Samples were analyzed for suvorexant plasma concentrations. The analytical method for the determination of suvorexant plasma concentrations was based on a liquid–liquid extraction of drug from human plasma. The drug and internal standard were separated using reversed-phase HPLC and detected with tandem mass spectrometry. The lower limit of quantitation for this method was 1 ng/mL with a linear calibration range from 1 to 1000 ng/mL.13
The pharmacokinetic parameters of suvorexant were calculated using the software WinNonlin (version 5.2.1) (Pharsight Corporation, St. Louis, Missouri). The apparent terminal rate constant (λ) was estimated by regression of the terminal log-linear portion of the plasma concentration–time profile; apparent terminal, t½, was calculated as the quotient of ln(2) and λ. Area under the curve to infinity (AUC0–∞) was estimated as the sum of AUC0–last and the extrapolated area given by the quotient of the last quantifiable plasma concentration and λ. AUC0–last was calculated using the linear trapezoidal method for ascending concentrations and the log trapezoidal method for descending concentrations up to the last quantifiable plasma concentration. Cmax and Tmax were obtained by inspection of the plasma concentration data.
Level C IVIVC Analysis Methodology
Multiple Level C models for the studied suvorexant batches were developed as follows. Linear regressions were carried out using SAS proc mixed with suvorexant Cmax as the dependent variable and a continuous covariate for disintegration or percentage dissolution after 10, 15, 20, 30, 45, and 60 min, and a random effect for subject. All individual PK data were included in the analyses to take into account the observed between and within subject variability (as opposed to just regressing through the mean Cmax values for each batch). For each regression, slope and intercept terms were estimated. Given that all tested batches exhibited similar mean AUC values, which is not surprising for an IR formulation for a BCS II compound, the IVIVC focused only on the correlation of dissolution or disintegration with Cmax. Cmax could be seen as a surrogate of early in vivo concentrations that may be of interest for onset of action.

Subsequently, the mean absolute percent prediction error was calculated.
Similar correlations were performed for disintegration measurements. All Level C linear regressions were performed in SAS.
Batch Manufacture and Tablet Hardness Measurements
Batches manufactured specifically for the study were made at a 10-kg scale. Blending was conducted using a 40-L Bohle blender and compression was conducted on a Fette 1200 rotary press with 24 stations. A relatively slow press speed of 15 rpm was utilized in order to provide a compression run of adequate length (∼1 h). In-process controls for the manufacture of the IVIVC tablets included weight, thickness, and hardness measurements that were taken every 5–10 min in order to ensure good control of tablet hardness. A minimum of 10 in-process checks were made for each batch. Each time point included a measurement of the average weight of 10 tablets, and five individual weight, thickness, and hardness measurements. The average tablet hardness for each batch was then calculated through averaging all the individual results taken throughout the run. The average tensile strength for each batch was calculated using the average weight, thickness, and hardness data from tablets from the corresponding batch.
Subsequent to compression, film coating of all batches was performed using a 24′′ pan. Special consideration was given to selection of coating conditions, particularly to limit friability of the lower tensile strength batch (1.05 MPa). The water activity of the tablets after film coating was controlled through packaging in order to ensure the supplies were at a representative water activity.
RESULTS
Dissolution and Disintegration
Dissolution data for tested 40 mg suvorexant tablets (batches A, C, D, and E) are shown in Figure 1. A clear differentiation in the dissolution of the four batches was obtained. When compared with the dissolution curve for the reference tablets (batch C), all batches show a dissolution similarity factor, f2, of less than 50 indicating nonsimilar dissolution performance. However, tablets from all four batches completely dissolved by 60 min in line with their IR properties.
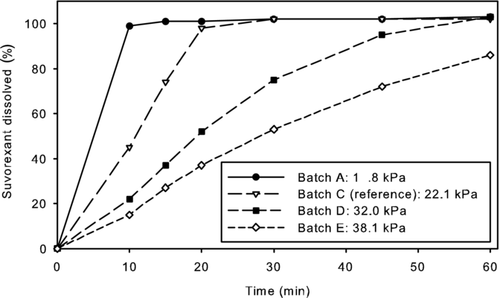
Dissolution for suvorexant tablets is controlled by slow tablet erosion followed by fast solubilization of the solid dispersion particle in the dissolution media. Therefore, tablet erosion, which can be directly measured by the disintegration test, is rate limiting for the overall dissolution of suvorexant tablets. Clear differences in disintegration were observed for the tested tablets with mean disintegration times of 5.29, 12.11, 23.58, and 30.23 min for batches A–E. Given the clear differentiation between tablets and the good dynamic range of the disintegration test, disintegration time could be considered an alternate surrogate to dissolution for IVIVC establishment; therefore, Level C IVIVC models to disintegration were also studied.
Clinical Pharmacokinetics
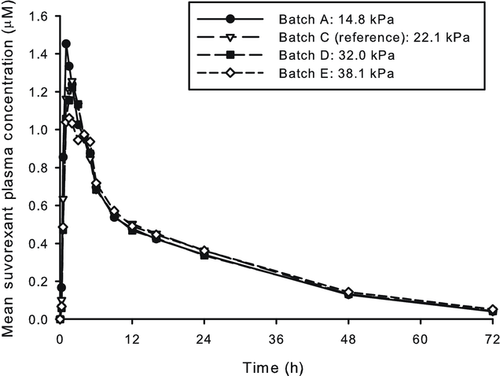
Mean suvorexant plasma concentration profiles over time for each of the test batches (A, D, and E) and the reference Phase III batch (C) following single dose administration of 40 mg suvorexant are presented in Figure 2 and pharmacokinetic parameters are shown in Table 1. Summary pharmacokinetic parameters are reported as geometric means in Table 1; a standard pairwise biocomparison analysis across test and reference formulations (GMRs also included in Table 1) was performed using the log-transformed data. The overall exposure (AUC0–∞) was generally similar for each of the test batches relative to reference. The observed geometric mean Cmax for the test batches with higher hardness (D and E) were approximately 13%–14% less than that for the reference batch (C), whereas the observed geometric mean Cmax for the test batch with lowest hardness (A) was approximately 7% greater than the mean of the reference (C). The observed trend of changes in Cmax across the batches is consistent with what would be expected based on tablet hardness. Tablets compressed at higher hardness result in slower erosion (reflected in disintegration and dissolution measurements), which in turn resulted in slower absorption (lower Cmax) in vivo.
| Geometric Mean for Treatment (% CV) | Geometric Mean (90% CI for GMR) for Treatment Ratio | ||||||
|---|---|---|---|---|---|---|---|
| Pharmacokinetic Parameter | Batch A (14.8 kP) | Batch C (22.1 kP) | Batch D (32.0 kP) | Batch E (38.1 kP) | A/C | D/C | E/C |
| AUC0–∞ (μM h)a | 21.56 (24.3) | 22.11 (23.5) | 21.32 (23.6) | 22.64 (18.5) | 0.98 (0.89, 1.07) | 0.96 (0.88, 1.06) | 1.02 (0.93, 1.12) |
| Cmax (μM)a | 1.59 (35.1) | 1.48 (23.2) | 1.29 (40.0) | 1.28 (14.7) | 1.07 (0.90, 1.28) | 0.87 (0.73, 1.04) | 0.86 (0.72, 1.03) |
| Tmax (h)b | 1.3 (0.5, 5.0) | 1.8 (1.0, 3.0) | 1.5 (1.0, 5.0) | 1.3 (1.0, 5.0) | – | – | – |
| Apparent t1/2 (h)c | 14.9 (4.8) | 15.1 (3.6) | 15.0 (5.1) | 15.9 (5.0) | – | – | – |
- a Geometric means and GMRs are reported.
- b Median (minimum, maximum).
- c Harmonic mean (pseudo SD).
Development of Multiple Level C IVIVC Models
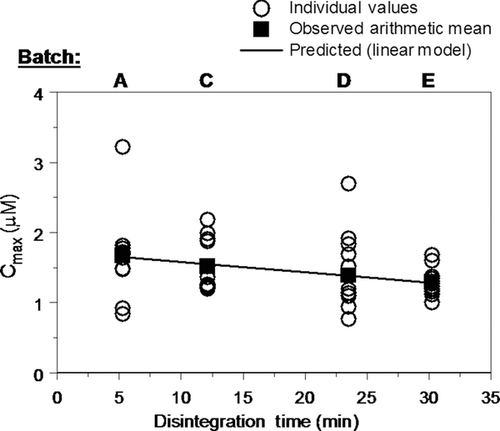
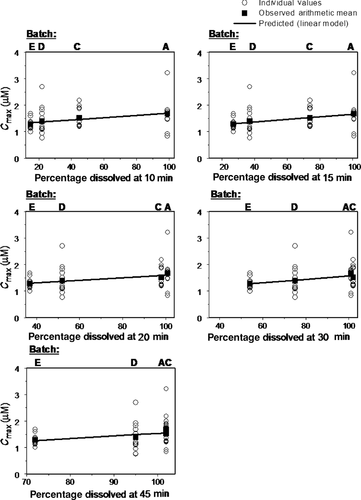
The slope terms were statistically significant (p < 0.05) for the linear regressions of Cmax versus disintegration, percentage dissolved at 10 min, percentage dissolved at 15 min, percentage dissolved at 20 min, percentage dissolved at 30 min, and percentage dissolved at 45 min (Figs. 3 and 4). The linear regression parameter point estimates are shown in Table 2. The slope estimate for Cmax versus percentage dissolved at 60 min was not statistically significant (p > 0.05) and is not graphically depicted in Figure 4.
| Intercept | Slope | Slope p Value | |
|---|---|---|---|
| Disintegration | 1.729 | −0.015 | 0.013 |
| Percentage dissolved (10 min) | 1.287 | 0.0042 | 0.018 |
| Percentage dissolved (15 min) | 1.194 | 0.0048 | 0.013 |
| Percentage dissolved (20 min) | 1.131 | 0.0048 | 0.019 |
| Percentage dissolved (30 min) | 0.938 | 0.0066 | 0.021 |
| Percentage dissolved (45 min) | 0.602 | 0.0095 | 0.041 |
| Percentage dissolved (60 min) | 0.373 | 0.0114 | 0.111 |
Prediction errors and the mean absolute prediction errors for the Level C IVIVC analysis were calculated using the equations previously described and the average observed Cmax value per batch. The results are shown in Tables 3 and 4. Individual and mean absolute prediction errors of ≤10% were obtained (<5% in the majority of cases).
| Batch | Cmax_obs (μM) | Cmax_disintegration (μM) | PE_Disintegration (%) |
|---|---|---|---|
| A | 1.67 | 1.65 | 1.38 |
| C | 1.52 | 1.55 | −2.21 |
| D | 1.39 | 1.38 | 0.37 |
| E | 1.29 | 1.28 | 0.42 |
| MAPE (%) | 1.10 |
- Cmax_obs = average observed Cmax per batch.
- Cmax_disintegration = predicted Cmax per batch by the means of the corresponding regression equation.
- PE_x = prediction error.
| Predicted Average Cmax Values | ||||||
|---|---|---|---|---|---|---|
| Batch | Cmax_obs (μM) | Cmax_d10 (μM) | Cmax_d15 (μM) | Cmax_d20 (μM) | Cmax_d30 (μM) | Cmax_d45 (μM) |
| A | 1.67 | 1.69 | 1.67 | 1.62 | 1.59 | 1.55 |
| C | 1.52 | 1.46 | 1.52 | 1.59 | 1.59 | 1.56 |
| D | 1.39 | 1.36 | 1.35 | 1.35 | 1.39 | 1.49 |
| E | 1.29 | 1.35 | 1.32 | 1.31 | 1.29 | 1.27 |
| PE | ||||||
| Batch | PE_10 (%) | PE_15 (%) | PE_20 (%) | PE_30 (%) | PE_45 (%) | |
| A | −1.11 | 0.09 | 3.49 | 4.73 | 7.27 | |
| C | 3.85 | −0.49 | −4.60 | −5.14 | −2.97 | |
| D | 1.84 | 2.92 | 2.42 | −0.25 | −7.06 | |
| E | −5.07 | −2.69 | −1.71 | 0.18 | 1.66 | |
| MAPE | 2.97 | 1.55 | 3.05 | 2.58 | 4.74 | |
- Cmax_obs = average observed Cmax per batch.
- Cmax_dx = predicted Cmax per batch at the x min dissolution time point by the means of the corresponding regression equations.
- PE_x = prediction error at the x min dissolution time point; MAPE = mean absolute prediction error.
Correlation Between Tablet Hardness and Dissolution
Figure 5a shows the relationship between tensile strength and the percentage dissolved at 20 min. It is evident that the relationship is tablet size dependent, with the lower potencies (smaller size tablets) releasing at a faster rate than the higher potencies (larger size tablets) at a given tensile strength. The tablet size dependency of the dissolution/tensile strength relationship is because of the erosion-based disintegration of the tablet core. Smaller size (lower potency) tablets have a higher surface-area-to-volume ratio (SA/V) and thus more surface for which erosion to occur. The larger size (higher potency) tablets have a correspondingly lower SA/V ratio and therefore the erosion of the tablet core occurs at a slower rate. The individual tablet size/potency responses for the 20-min time point can also be collapsed into a single linear fit by taking into account the surface-area-to-volume ratio of each tablet. The single linear relationship established further confirms the theory of an erosion-based tablet dissolution and is shown in Figure 5b.
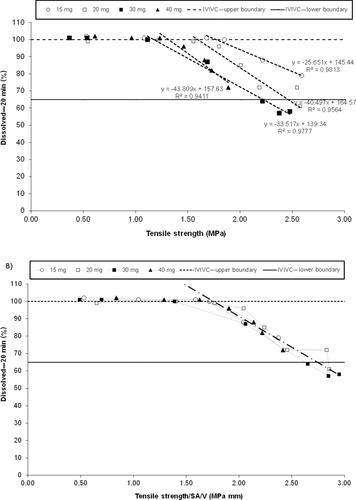
Of the dissolution time points considered, the 20-min time point, which is presented in Figure 5, was selected as the data resulted in a more discriminating linear relationship between tablet tensile strength and dissolution than the other time points. For example, at the 30-min time point, many of the tensile strengths considered for commercial processing resulted in 100% dissolved, for which a correlation could not be readily established. The other time points (10 and 15 min) could be used to establish tensile strength ranges as well but the 20-min time point lead to the smallest range for tablet tensile strength and hence the most discriminating relationship.
Tensile strength was selected as the tablet attribute used for this analysis as it is a tablet potency/size independent property and allowed all tablet potencies from 15 to 40 mg to be analyzed on the same figure. Tensile strength is a function of tablet hardness, thickness, and tablet size; therefore, the results obtained for tensile strength ranges based on dissolution were also used to set in process controls for tablet hardness.
Application of IVIVC to Hardness in-Process Controls
On the basis of the Multiple Level C regression equations shown in Table 2, a range for percentage dissolved was calculated so that the estimated Cmax would be within 10% of the mean Cmax predicted from the IVIVC model for the reference formulation, Batch C. The resulting dissolution ranges are shown in Table 5.
| Formulation Parameter | Mean Observed Cmax Value for Reference Batch C (μM) | Mean IVIVC Predicted Cmax Value for Reference Batch C (μM) | Predicted Formulation Parameter Range for ± 10% IVIVC Predicted Cmax Relative to Batch C |
|---|---|---|---|
| Disintegration (min) | 1.52 | 1.55 | 1.8–22.4 |
| Percentage dissolved (10 min) | 1.52 | 1.47 | 10.3–79.7 |
| Percentage dissolved (15 min) | 1.52 | 1.54 | 42.2–100 |
| Percentage dissolved (20 min) | 1.52 | 1.59 | 64.9–100 |
| Percentage dissolved (30 min) | 1.52 | 1.59 | 77.8–100 |
| Percentage dissolved (45 min) | 1.52 | 1.56 | 86.0–100 |
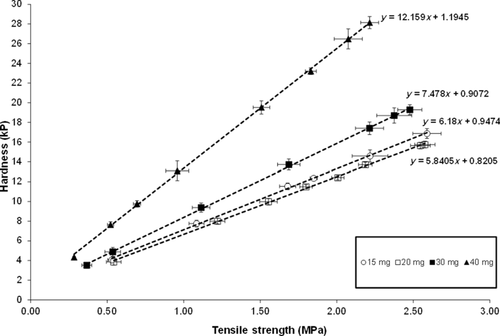
The limit for the 20-min dissolution point used in the dissolution–tensile strength correlations, is also included in Figures 5a and 5b. As previously stated, the 20-min time point was selected on the basis of providing the most discriminating linear relationship between tablet tensile strength and dissolution. The lower dissolution boundary at 20 min is 64.9% released and the upper dissolution boundary for the 20-min time point is 100% released. Upper and lower tensile strength limits were directly estimated from Figure 5b. The linear relationship between tablet tensile strength and tablet hardness is shown in Figure 6. On the basis of this relationship, the tensile strength limits were converted to tablet hardness values for each tablet potency as described in Table 6. The hardness limits determined by the IVIVC model, in combination with tablet robustness and processability considerations (i.e., friability) were subsequently used to help determine drug product in-process controls for the compression step.
| Suvorexant Tablet Image (mg) | Lower Hardness Limit (kP) | Upper Hardness Limit (kP) |
|---|---|---|
| 15 | 11 | 20 |
| 20 | 8.5 | 16.5 |
| 30 | 8.5 | 19.5 |
| 40 | 15 | 27.5 |
DISCUSSION
The goal of the study reported herein was to understand the clinical significance of dissolution and disintegration differences observed between tablets of different hardness and to attempt to establish an IVIVC for the suvorexant solid dispersion formulation. The question around clinical impact of dissolution changes is one that formulation and biopharmaceutics scientists routinely face during product development. Despite the advances in dissolution methodologies, including biorelevant dissolution, full a priori predictions are not always possible and sufficient clinical data are required to establish confidence on the translation of a dissolution assay to a clinical pharmacokinetic response, especially for application in a regulatory setting such as specification setting, formulation design space definition, and so on. For MR formulations, this dissolution to clinical pharmacokinetics translation has been traditionally approached via the development of IVIVCs. However, application of IVIVCs to IR products appears much less common with only limited literature examples available. The rapid in vitro dissolution in standard dissolution tests employed in a quality control setting as well as the typically fast timeframe of absorption represent significant hurdles in establishing point-to-point Level A correlations that are commonly sought for MR products. Furthermore, establishment of Level A correlations via traditional deconvolution/convolution methodologies typically requires the availability of a faster formulation relative to the test formulation that will help as the basis of the unit impulse response. This is not easy to accomplish for IR dosage forms as it would entail either the dosing of oral solution (which may not be feasible because of compound solubility) or availability of data from intravenous administration. However, Level C and/or Multiple Level C correlations, where a single or multiple dissolution time points, respectively, are correlated to summary pharmacokinetic parameters such as AUC and Cmax, may be more readily achievable. The study described in the manuscript was designed with the goal of a Multiple Level C correlation.
On the basis of the pharmacokinetic outcome of the study described in this manuscript, the differences in tablet hardness resulted in a measurable difference in Cmax between formulations. However, the observed Cmax differences generally appeared less pronounced than that indicated by the dissolution assay. For example, batch E that shows threefold lower dissolution in the early time points relative to the fastest batch (A) as a result of an approximately sixfold longer disintegration time (30.23 vs. 5.29 min), results in a Cmax change of approximately 24% (GMR A vs. E = 1.24) (Table 1). As dissolution of these solid dispersion tablets is expected to be controlled by the initial erosion/disintegration process, the observed pharmacokinetic data suggest that disintegration differences in vivo are minimized given the time frame of absorption (median Tmax ∼1.5 h) or because of differences in destruction forces in the stomach relative to the in vitro assays. Contrary to Cmax, total exposure (AUC0–∞) was not affected by the disintegration/dissolution differences, all AUC GMRs for batches A, D, and E relative to batch C were close to 1 (Table 1).
Despite being relatively small compared with the dissolution differences, the observed Cmax differences were sufficient between formulations to be used for IVIVC purposes. A predictive Multiple Level C model was established for suvorexant Cmax against the 10, 15, 20, 30, and 45-min time points of the dissolution assay and the disintegration time. The relationship between the in vitro parameters and Cmax was sufficiently described by linear regression (Figs. 3 and 4; Table 2). The established correlations satisfied the prediction criteria (<10%) as stated in available Regulatory Agency Guidance. The prediction errors increased with increasing dissolution time reflecting that as the formulations reached complete dissolution, discrimination against the observed Cmax differences was reduced. Still, a statistically significant correlation was obtained up to the 45-min time point. The model was further qualified by removing formulation D from the dataset and using it for external prediction to ensure relationships could be replicated with only three formulations in the dataset. Similar predictions were obtained with the three formulation model, further validating the established IVIVC (data not shown).
The availability of an IVIVC allows for direct linkage between drug product properties and in vivo performance. Available guidances, for example, state how a Multiple Level C IVIVC can be utilized to set dissolution specifications. To that extent, dissolution ranges resulting in bioequivalence (defined as a maximal 10% Cmax difference around the Cmax for target batch C) were estimated for the suvorexant tablets (Table 5) at each time point. The lower part of these ranges could be used as a specification dissolution setting. In principle, any of these time points could be considered as suitable for clinically relevant specifications as they all are tied to a projection of bioequivalence. Given the established correlation between tablet hardness and dissolution at the 20-min time point, use of the same time point for dissolution specifications seems possible and based on Table 5 that would result at a specification of 65% release in 20 min. The corresponding tablet hardness ranges are shown in Table 6. Such an approach where the dissolution or disintegration ranges are derived from available pharmacokinetic data would represent an example of the first step toward establishing a clinically relevant dissolution specification under the QbD paradigm. However, it is worth mentioning that it is often an expectation that specifications for IR product cover 80% release of the API, to ensure full release of the dosage form. The time point that fulfills that requirement is the 30-min time point. On the basis of Table 5 and the IVIVC calculations, tablets with release greater that 78% release in 30 min are expected to meet bioequivalence criteria on Cmax. Therefore, the 30-min time point can be used as an alternative time point for specification, maintaining the clinical relevance derived from the established IVIVC. It should be acknowledged that the only formulation parameter studied in the specific study was tablet hardness/compression force and the dissolution specifications derived in this manuscript are under the premise that other formulation parameters do not influence the compound pharmacokinetics. For suvorexant HME tablets, tablet hardness was the main formulation/processing parameter affecting dissolution/disintegration. Depending on product characteristics, it should be noted that final specifications may need to reflect the impact of multiple parameters, control of some may require adjustments of the dissolution specification relative to those estimated from an IVIVC study. Further, it is also possible that the relatively shallow response with respect to Cmax suggests a lack of sensitivity of pharmacokinetic parameters to dissolution/disintegration variation, in which case, specifications based on the “safe space” concept may be more appropriate.14
The use of dissolution or disintegration measurements as acceptance criteria perhaps warrants additional discussion. As shown in Table 2 and Figure 3, robust correlations were also established between disintegration and suvorexant Cmax. As discussed previously, for the solid dispersion formulation, the tablet erosion time dictates the time course of dissolution. As this is captured directly by the disintegration time values, disintegration measurements could be also seen as an alternative to establishing clinically relevant specifications. For example, from the IVIVC model, one would estimate that a disintegration time of less than 22.4 min could be used as a suitable acceptance criterion. In fact, one may argue that given the expected better dynamic range of the disintegration measurements relative to the dissolution assay, use of disintegration could be seen as preferable. However, under current development and Regulatory paradigms, dissolution is seen as the primary quality control tool for BCS II IR tablets; therefore, we utilized dissolution as the endpoint to further establish tablet hardness ranges.
Although setting release specifications is one way to ensure product performance, it would appear ideal if dissolution can be linked directly to a primary formulation/processing parameter in a quantitative manner to further embed the clinically relevant aspects in the formulation composition/process space. For suvorexant tablets, quantitative mathematical models linking the dissolution to tensile strength were developed (Figs. 5a and 5b). Tensile strength was selected as the tablet attribute used in the first step for this analysis as it is a tablet potency/size-independent property and allowed all potencies from 15 to 40 mg to be analyzed on the same figure. Tensile strength was subsequently directly correlated with tablet hardness (Fig. 6). Finally, using the estimated bioequivalence dissolution bounds, these correlations along with tablet robustness and processability considerations allowed for setting of tablet hardness in-process controls (Table 6) that ensure adequate formulation performance in vivo. This established product understanding is well aligned with the intent of QbD as outlined for pharmaceutical dosage form development.
CONCLUSIONS
There are limited reported case studies for IVIVC for IR formulations. We demonstrated in this example the establishment of a Multiple Level C IVIVC for the dissolution versus Cmax and a Level C IVIVC for the disintegration versus Cmax of suvorexant solid dispersion IR tablets. Within the tested dissolution ranges, AUC was not affected, which is in line with the expected absorption of BCS II compounds. The established IVIVC model was used to inform acceptable dissolution specifications and hardness in-process controls under a QbD paradigm. Although Level A models for IR products may not be readily achievable, there is still significant utility in Level C IVIVCs to inform the formulation design space and clinically relevant release specifications.
ACKNOWLEDGMENT
The authors would like to thank our colleagues from Merck Clinical Pharmacology and Pharmacokinetics, Pharmacodynamics, and Drug Metabolism Departments who facilitated conduct of the clinical study and analysis of the plasma samples.


