

In Vitro and In Vivo Performance of Different Sized Spray-Dried Crystalline Itraconazole
Sumit Kumar's present address is Allergan Inc., Small Molecule Product Development, Irvine, California 92612.
Nakissa Sadrieh's present address is CFSAN/OCAC, College Park, Maryland 20740.
Abstract
The objectives of the present study were to formulate and optimize different sized liquid and solid nanocrystalline formulations and evaluate their in vitro and in vivo performance to determine the effect of particle size on the oral bioavailability of solid nanocrystalline formulations. Nanotechnology is a promising approach to solve the problem of poor oral bioavailability of Biopharmaceutical Classification System class II/IV compounds. However, the highly exposed surface area of nanocrystals and hence their high Gibb's free energy poses a great challenge to nanocrystalline suspension stabilization. In this study, stabilization was achieved by preparing spray-dried nanocrystalline powders. A design of experiment approach was utilized to optimize the nanocrystalline suspensions/powders. On the basis of drug solubility studies, polyvinylpyrrolidone 40 KDa and sodium lauryl sulfate were selected for wet milling processing. Mannitol was chosen as the auxiliary excipient for spray-drying processing. In vitro dissolution utilizing a United States Pharmacopeia (USP) apparatus II showed superior release profiles for both liquid and nanocrystalline powder formulations compared with coarse-sized and unmilled formulations. Significantly, the oral bioavailability of nanocrystalline formulations with particle size of 280 nm was more than 20 times that of the unmilled formulation, whereas the nanocrystalline formulation with particle size of 750 nm showed only a 2.8 times increase in bioavailability compared with the unmilled formulation. © 2014 Wiley Periodicals, Inc. and the American Pharmacists Association J Pharm Sci 104:3018–3028, 2015
INTRODUCTION
Active pharmaceutical ingredients (APIs) can be classified into four different categories, that is, class I through IV, based on their aqueous solubility and permeability [Biopharmaceutical Classification System (BCS)].1 In the past decade or so, an increased percentage (up to 40%) of APIs is either BCS class II or IV.2-5 These molecules (sometimes referred as “brick-like” molecules) demand appropriate formulation approaches because of their low aqueous solubility (in the order of a few nanograms per milliliter) and poor oral bioavailability as well as their tendency for fed versus fasted variation in oral bioavailability.6-8 Poorly soluble APIs can be divided into two different subcategories, that is, dissolution rate limited and solubility limited. There are many different approaches to improve both dissolution-rate- and solubility-limited problems. For example, amorphous formulation and cyclodextrin complexation can be utilized to solve the problem of solubility-limited APIs, whereas nanocrystalline suspensions can be utilized to improve the poor dissolution rate of APIs.9-13
Nanotechnology has gained a lot of attention in recent years and hence the number of commercial nanoformulations available on the market has increased significantly.14 Nanocrystalline formulations can be achieved based on two different approaches: top-down and bottom-up. In the top-down approach, particle size reduction is performed utilizing a number of patented technologies such as media milling, microfluidization, and so forth.14 In the bottom-up approach, the API is dissolved in an appropriate solvent and precipitated using an antisolvent. An alternative bottom-up method involves spray drying to generate nanoparticles. Nanosized suspensions have high-surface-area-to-volume ratios (or exposed surface area) and, as explained by the Noyes–Whitney equation,15 have faster dissolution rates. In addition, a decrease in particle size causes a decrease in the diffusion layer thickness (Prandtl equation), which also increases the dissolution rate. Nanosized suspensions offer several advantages such as improved wetting, dissolution, and bioavailability, as well as similar bioavailability in both fed and fasted conditions.
Nanosized suspensions have high-surface-area-to-volume ratios and therefore higher Gibbs free energy. This causes nanosized suspensions to be vulnerable to instability such as Ostwald's ripening, aggregation, and so forth. One of the approaches to stabilize or improve the shelf life of pharmaceutical nanosized formulations is to spray or freeze-dry and formulate as tablets or capsules for oral delivery. Such solid dosage formulations are preferred but can be very challenging. Until recently, research on further processing of nanosized suspensions such as granulation, tableting, and capsule filling has been largely ignored. Another important aspect for solid nanoparticle formulation is the impact of size within the nanorange on the dissolution rate and oral bioavailability of poorly soluble drugs. This knowledge is important for a better understanding of these formulations to develop in vitro–in vivo correlations, modeling, andsimulations.
The objectives of the present study were to (1) formulate and optimize stable spray-dried powders of nanocrystalline suspensions, (2) formulate different sizes of crystalline spray-dried powders, and (3) perform in vitro dissolution testing and in vivo oral bioavailability of these spray-dried powders (in a capsule form) in order to determine the effect of a range of particle sizes on oral bioavailability. Itraconazole, categorized as BCS class II, was selected for this purpose. Itraconazole has a solubility of 4–5 μg/mL at pH 1.2 with good membrane permeability. Wet milling followed by spray drying was utilized to reduce the particle size and achieve nonaggregating crystalline powder formulations. A design of experiment (DoE) approach was utilized to optimize the milling formulation critical parameters, that is, stabilizer concentrations. After formulation optimization, different sizes of crystalline formulations were evaluated for in vitro and in vivo performance. The in vitro dissolution experiments were performed utilizing USP (United States Pharmacopeia) apparatus II, and the oral bioavailability of the formulations was investigated using a male Sprague–Dawley rat model.
MATERIALS
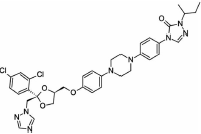
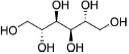
Crystalline itraconazole (more than 99% purity) was purchased from Jai Radhe Sales, Ahmedabad, Gujarat, India. Polyvinylpyrrolidone 40 KDa (PVP40), sodium lauryl sulfate (SLS), and mannitol were purchased from Sigma–Aldrich (St. Louis, Missouri). The chemical structure of the drug and excipients are shown in Table 1. All the excipients utilized in this study were of high purity and grade. HPLC grade solvents were purchased from Sigma–Aldrich (St. Louis, MO). Luna C18(2) column (4.6 × 150 mm, 3 μm) was purchased from Phenomenex (Torrance, California).
| Name | Chemical Formula | Structure |
|---|---|---|
| Itraconazole (BCS class II drug) | C35H38Cl2N8O4 | |
 |
||
| Polyvinylpyrrolidone 40 kDa (PVP40) (water-soluble polymer) | (C6H9NO)n | |
 |
||
| Sodium lauryl sulfate (SLS; anionic surfactant) | NaC12H25SO4 | 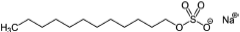 |
| Mannitol (sugar alcohol) | C6H14O6 | |
 |
METHODS
Solubility Measurement
Equilibrium solubility was determined in different excipient solutions under continuous shaking for 48 h at 37°C. Briefly, 10 mg of the drug was added to each vial containing 10 mL of the stabilizer/excipient solution (0.2%, w/v solution). After 48 h, 1 mL samples were withdrawn from each vial, filtered through 0.22 μm filters, and analyzed using the HPLC–fluorescence method as described below.
Wet Milling
Itraconazole (1%, w/v) was suspended in the required concentration of aqueous stabilizer solution as determined from the DoE study (described below). The prepared suspensions were stirred for 30 min for complete wetting of the drug by the stabilizer solution. The suspension (150 mL) was milled using a media mill (Netzsch, Exton, Pennsylvania) at a fixed milling intensity of 2500 rpm in the continuous mode. All the suspension formulations were continuously milled for 75 min and particle size was measured during and following the milling process. The temperature of the sample was maintained below 25°C using two cooling bath recirculators (one attached to the milling and the other to the suspension recirculation chambers).
Spray Drying
Nano- and macrocrystalline suspensions were spray dried using a B-290 spray dryer (Buchi Labortechhnik AG, Flawil, Switzerland). The spray drier was equilibrated using distilled water at 110°C inlet temperature, 5 mL/min feed rate, and −30 mbar aspiration rate. The outlet temperature was approximately 75°C. The inlet temperature of 110°C was selected based on (our preliminary study) minimizing nanocrystal aggregation and avoiding polymorphic phase transition with less than 3% (w/w) moisture content. Once the spray dryer was equilibrated, distilled water was changed to the suspension formulations. Each formulation was spray dried using mannitol as an excipient [drug–mannitol (1:2.5)] to prevent nanocrystal aggregation. Spray-dried powders were collected from the collection chamber and immediately analyzed for particle size and crystallinity.
Design of Experiment
On the basis of solubility experiment and initial screening, a combination of PVP40 and SLS was selected for itraconazole wet milling processing. Two critical formulation parameters SLS and PVP40 concentrations were tested for the preparation of stable itraconazole nanocrystalline suspensions using a Netzsch media mill. A cubic-centered design, a part of the response surface methodology, was utilized to optimize and select the optimum combination of stabilizer concentrations. The critical quality attributes were particle size before and after spray-drying processing. A design space is shown in Table 2; a total of 14 wet milling operations were performed followed by spray drying using mannitol as an additional excipient [drug–mannitol (1:2.5)] to prevent nanocrystal aggregation. Both the liquid suspensions and solid spray-dried powders were stored at 4°C and 25°C for storage stability testing.
| Batch Number | SLS Concentration (% w/v) | PVP40 Concentration (% w/v) |
|---|---|---|
| 1 | 0.05 | 0.1 |
| 2 | 0.01 | 0.3 |
| 3 | 0.03 | 0.2 |
| 4 | 0.01 | 0.1 |
| 5 | 0.03 | 0.2 |
| 6 | 0.05 | 0.3 |
| 7 | 0.03 | 0.2 |
| 8 | 0.03 | 0.1 |
| 9 | 0.03 | 0.2 |
| 10 | 0.03 | 0.2 |
| 11 | 0.01 | 0.2 |
| 12 | 0.05 | 0.2 |
| 13 | 0.03 | 0.2 |
| 14 | 0.03 | 0.3 |
Particle Size Measurement
Particle size measurements were performed using a Zetasizer Nano ZS90 (Malvern Instruments, Westborough, MA). Briefly, the liquid or spray-dried samples were suspended in the saturated and filtered (0.2 μm membrane filter) solution of itraconazole in 30% glycerin solution to avoid any discrepancy resulting from dissolution of nanoparticles during the measurements. The viscosity of this dispersant solution was measured using a Brookfield viscometer (model DV-III, Brookfield Engineering, Middleboro, MA) and used to calculate the particle size of redispersed or liquid nanocrystalline suspensions. Each sample was analyzed in triplicate.
Differential Scanning Calorimetry
Differential scanning calorimetry (DSC) was performed using a TA Q1000 (TA instruments, New Castle, DE) calorimeter and calibrated using indium and sapphire discs. Approximately 5–10 mg of spray-dried samples were sealed in hermetic pans and analyzed. The heating rate was maintained at 5 °C/min and the temperature was increased from room temperature to 190°C. Nitrogen gas was used for purging at a flow rate of 50 mL/min. The data were analyzed using TA universal analysis software.
Powder X-ray Diffraction
Powder X-ray diffraction (PXRD) was used to evaluate sample crystallinity. Diffraction patterns were obtained using an X-ray diffractometer (Bruker AXS Model D2 Phase diffractometer, Bruker AXS, Inc. Madison, WI) with Cu-Kα radiation (30 kV voltage and 10 mA current). All scans were performed at 1°/min from 5° to 40° at 2θ angles.
HPLC–Fluorescence Analytical Method
The quantification of itraconazole was conducted using a Shimadzu (Shimadzu Scientific Instruments, Marlborough, MA) HPLC system attached to a fluorescence detector. The absorbance and fluorescence wavelength were set at 262 and 365 nm, respectively. The mobile phase was a mixture of 25 mM phosphate buffer (pH 6.1) and acetonitrile at 35:65, v/v, ratio. A C18 Waters (Waters Corp, Milford, MA, USA) symmetry analytical column (4.6 × 150 mm2) was used with a flow rate of 1 mL/min, and the column temperature was maintained at 30°C using a column heater.
Storage Stability Testing
All the spray-dried powders and liquid formulations were stored at two different temperatures, that is, 4°C and 25°C for 10 days. At the end of day 10, the stored samples were withdrawn and analyzed for particle size and crystallinity.
Bioanalytical Method
The quantification of itraconazole was conducted using a Shimadzu (Shimadzu Scientific Instruments, Marlborough, MA) HPLC system attached to UV and fluorescence detectors. The mobile phase was a mixture of 25 mM phosphate buffer (pH 6.1) and acetonitrile at a 35:65, v/v, ratio. A C18 Phenomenex (Phenomenex, Torrance, CA) Luna 3u analytical column (4.6 × 150 mm2) was used with a flow rate of 1 mL/min, and the column temperature was maintained at 40°C using a column heater. Griseofulvin was chosen as the internal standard. The itraconazole absorbance and fluorescence wavelengths were set at 262 and 365 nm, respectively, and the griseofulvin absorbance wavelength was set 292 nm. Itraconazole extraction was performed via the protein precipitation method using methanol. Briefly, the internal standard (∼10 ng griseofulvin) was added to the plasma samples and vortexed. Next, 500 μL of methanol was added and the samples were vortexed for 15 min. The precipitated samples were centrifuged at 15,000 g for 15 min. The supernatants were decanted to clean centrifuge tubes. The samples were evaporated to dryness using a stream of nitrogen at 45°C. The dried samples were resuspended in 50 μL methanol, and 25 μL of the centrifuged samples were used for HPLC analysis.
In Vitro Dissolution Testing
USP apparatus II (AT7 smart; Sotax AG, Allschwil, Switzerland) was utilized for the in vitro dissolution experiments. In the case of spray-dried powders, the samples were filled into hard gelatin capsules (size 9e, Torpac, Inc. Fairfield, NJ) and the basket (instead of paddle) was utilized. All the dissolution experiments were conducted at 37°C in 900 mL (sink conditions) of 0.1 N HCl (pH 1.2) with 100 rpm basket speed or 50 rpm paddle speed for capsules and liquid formulations, respectively. At each time point, 2 mL of sample was withdrawn from the dissolution chamber and replaced with fresh 0.1 N HCl. The withdrawn samples were filtered using 0.1 μm filters to avoid any erroneous results from undissolved nanoparticulates. All the samples were analyzed using the HPLC–fluorescence method as described previously.
Contact Angle Measurement
The spray-dried nanocrystalline powders (∼150 mg) were compressed using a Carver press at a pressure of 5 tons for 2 min, after which the pellet was carefully removed from the die. The pellets were vacuum dried overnight at room temperature to remove any adsorbed moisture during processing. The dried pellets were utilized to measure contact angle with distilled water. The contact angle was measured using a contact angle goniometer (Pendant drop tensiometer OCA 20, Future Digital Scientific Corp, Garden City, NY). A drop of 2.5 μL of distilled water was selected for measurement. All measurements were performed in triplicate, and the mean values were reported.
In Vivo Oral Bioavailability
Three itraconazole formulations with different milling times or particle sizes (280 nm, 750 nm, and unmilled formulations) were enclosed in the capsules (size 9e) at a dose of 30 mg/kg of the rat body weight using a capsule filling kit purchased from Torpac (Torpac, Inc. Fairfield, NJ). All the animal studies were approved by University of Connecticut IACUC committee. Animals were starved overnight (free access to water) before the study and given food after 6 h of dosing. The capsules were administered via oral gavage using a capsule dosing kit. At 1, 2, 3, 4, 6, 8, 12, and 24 h following oral administration, 175 μL blood samples were collected from a jugular catheter and placed into preheparinized centrifuge tubes. The blood samples were centrifuged, and the drug extraction procedure was performed as described in the Bioanalytical method. The in vivo data analysis was performed using the Kinetica software 4.4 (Thermo Scientific, Waltham, MA), using a trapezoidal rule (0–24 h).
RESULTS AND DISCUSSION
Selection of Stabilizer(s)
Drug solubility was obtained in different excipient solutions. It was observed that methocel A15, HPMC E5, pluronics, kollidon 30, and PVA caused an increase in drug equilibrium solubility compared to the no excipient (control) sample, as shown in Table 3. Ostwald's ripening is one of the major instability issues in the case of nanocrystalline suspensions. The smaller drug crystals (nanocrystals) have high Gibb's free energy because of high-surface-area-to-volume ratios and thus nanocrystalline suspensions are thermodynamically unstable.14 During Ostwald ripening, the drug particle size increases on storage stability and the formulation loses its superior dissolution performance with the consequent increase in particle size. Increase in drug solubility upon addition of excipient is one of the reasons for Ostwald ripening. Accordingly, all excipients, which increase drug equilibrium solubility, should be avoided in nanocrystalline suspension formulations. In addition, it was observed that pluronic (F168 and F68) containing formulations are not suitable for spray drying following wet milling, because of their sticking tendency in the spray dryer, which greatlyaffects the yield of spay-dried powder. Initial milling experiments were performed with the remaining excipients (i.e., HPMC E15, PVP40, and HPC) in order to screen for the best excipient. None of these excipients were effective in reducing (i.e., below 500 nm) and stabilizing the particle size, except for PVP40 (data not shown). Formulations containing HPMC E15, PVP40, or HPC yielded nanocrystalline particle size of 800 nm or above with bimodal distribution. Thus, PVP40 was utilized for wet milling processing. Wet milling followed by spray drying of PVP40 containing nanocrystalline suspensions was performed; however, the particle size (before and after spray drying) was in the range of 400–500 nm after 2 h of continuous wet milling. On the basis of these observations, small amounts (0.05%, w/v) of surfactants (i.e., Dowfax-2A1 or sodium lauryl sulfate) were included for further reduction of the nanocrystalline particles (as small molecule surfactants improve wetting and thus facilitate particle size reduction). With the combination of PVP40 and SLS, it was possible to achieve approximately 200 nm crystalline particles within 60 min of continuous milling (data not shown). On the basis of above results, a DoE approach was utilized to optimize and formulate itraconazole nanocrystalline suspensions using a combination of PVP40 and SLS as stabilizers.
| Sample Number | Excipient Solution (0.2% w/v) | Type of Stabilizer | Itraconazole Solubility (ng/mL) |
|---|---|---|---|
| 1 | No excipient | N/A | 5.77 |
| 2 | Methocel E3 | Nonionic polymer | 10.09 |
| 3 | Methylcellulose A15 | Nonionic polymer | 7.31 |
| 4 | HPMC E5 | Nonionic polymer | 7.99 |
| 5 | HPMC E15 | Nonionic polymer | 5.47 |
| 6 | PVA | Nonionic polymer | 13.7 |
| 7 | Kollidon 30 | Nonionic polymer | 13.29 |
| 8 | PVP40 | Nonionic polymer | 4.68 |
| 9 | HPC | Nonionic polymer | 4.68 |
| 10 | Pluronic F68 | Nonionic surfactant | 26 |
| 11 | Pluronic F127 | Nonionic surfactant | 23 |
Wet Milling
Wet milling was performed for all the different suspension formulations as given in Table 2 (DoE design space). One hundred fifty milliliters of required stabilizers (a combination of PVP40 and SLS) solution was prepared with 1% (w/v) of itraconazole. The particle size values of the milled liquid nanosuspension before spray drying are provided in Table 4. As shown in Figures 1 and 2, the particle size decreased with increasing concentration of PVP40 and the smallest particle size was obtained with at least 0.3% (w/v) (or more) of PVP40. Similarly, increasing concentrations of SLS decreased the particle size; however, the smallest particle size was achieved with 0.03% (w/v) (sample number 14, Table 4) and increasing the concentration of SLS (more than 0.03%, w/v) increased the particle size (sample number 6, Table 4). This could be due to an increase in drug equilibrium solubility with increase in the concentration of SLS. The equilibrium solubility experiments were also performed with different SLS concentrations. As shown in Table 5, the solubility of itraconazole is similar to the control (no excipient itraconazole solubility 5 ng/mL) in the case of 0.03% (w/v) SLS, but is significantly higher at 0.05%, w/v, SLS (i.e., 1533 ng/mL). This increase in equilibrium solubility is probably a consequence of micelle solubilization because the reported CMC (critical micelle concentration) value for SLS is in the range of 0.17%–0.23% (w/v). The increased solubility is likely to result in an unstable formulation as a consequence of Ostwald's ripening and aggregation.
| Before SD | After SD | |||||
|---|---|---|---|---|---|---|
| Batch Number | SLS Concentration (% w/v) | PVP40 Concentration (% w/v) | Particle Size (nm) | PDI | Particle Size (nm) | PDI |
| 1 | 0.05 | 0.1 | 379 | 0.216 | 432 | 0.399 |
| 2 | 0.01 | 0.3 | 501.9 | 0.324 | 836.5 | 0.487 |
| 3 | 0.03 | 0.2 | 383.2 | 0.265 | 413.1 | 0.347 |
| 4 | 0.01 | 0.1 | 421.7 | 0.277 | 456.8 | 0.379 |
| 5 | 0.03 | 0.2 | 375 | 0.226 | 412.4 | 0.391 |
| 6 | 0.05 | 0.3 | 345.3 | 0.281 | 351.7 | 0.358 |
| 7 | 0.03 | 0.2 | 367.7 | 0.265 | 403.4 | 0.413 |
| 8 | 0.03 | 0.1 | 392.3 | 0.245 | 537.3 | 0.539 |
| 9 | 0.03 | 0.2 | 363.8 | 0.182 | 404.5 | 0.335 |
| 10 | 0.03 | 0.2 | 393.4 | 0.309 | 499.5 | 0.728 |
| 11 | 0.01 | 0.2 | 690 | 0.485 | 699 | 0.873 |
| 12 | 0.05 | 0.2 | 293.4 | 0.247 | 308 | 0.279 |
| 13 | 0.03 | 0.2 | 308.7 | 0.24 | 335.6 | 0.373 |
| 14 | 0.03 | 0.3 | 282.9 | 0.197 | 310.6 | 0.278 |
| Excipient | Concentration (% w/v) | Equilibrium Solubility (ng/mL) |
|---|---|---|
| SLS | 0.01 | 5.00 |
| 0.03 | 7.58 | |
| 0.05 | 1533.17 |


Spray Drying and Stability
Following wet milling, 100 mL of wet milled formulation was spray dried as described in the Methods section (based on our previous experience).16-18 Mannitol was added to each wet milled formulation at a ratio of 1:2.5 (drug/mannitol) before spray drying. As shown in Figures 3 and 4, the formulations with high PVP40 and SLS were nonaggregating (at least 0.03% (w/v) SLS and 0.3% (w/v) PVP40) and stable. The best formulation was sample number 14, as shown in Table 4. After wet milling and spray drying, all the formulations (i.e., liquid and solid spray dried) were stored at 4°C and 25°C for short-term stability testing. As shown in Table 6, all the DoE formulations were similar in size (or stable) at both 4°C and 25°C. No polymorphic changes were observed (data not shown).
| Initial | 10 Days at 4°C | 10 Days at 25°C | ||||
|---|---|---|---|---|---|---|
| Batch Number | Z-Avg. | PDI | Z-Avg. | PDI | Z-Avg. | PDI |
| 1 | 432.7 | 0.399 | 396.3 | 0.387 | 417.2 | 0.336 |
| 2 | 882.5 | 0.487 | 887.3 | 0.736 | 875.5 | 0.571 |
| 3 | 413.1 | 0.347 | 404.4 | 0.422 | 414.9 | 0.445 |
| 4 | 456.8 | 0.379 | 438 | 0.509 | 416.8 | 0.301 |
| 5 | 412.4 | 0.391 | 401.7 | 0.402 | 402.4 | 0.339 |
| 6 | 351.7 | 0.358 | 396.4 | 0.468 | 340.7 | 0.254 |
| 7 | 403.4 | 0.413 | 400.1 | 0.4 | 373.3 | 0.318 |
| 8 | 537.3 | 0.539 | 432 | 0.349 | 424.8 | 0.314 |
| 9 | 404.5 | 0.335 | 430.9 | 0.536 | 383.1 | 0.289 |
| 10 | 499.5 | 0.728 | 388.4 | 0.39 | 391.2 | 0.296 |
| 11 | 699 | 0.873 | 3135 | 0.49 | 1143 | 0.845 |
| 12 | 308 | 0.279 | 297.3 | 0.307 | 355.6 | 0.426 |
| 13 | 335.6 | 0.373 | 324.5 | 0.281 | 336.4 | 0.334 |
| 14 | 291.5 | 0.225 | 304.9 | 0.337 | 315.7 | 0.28 |


Optimized Formulation and Crystallinity
On the basis of above results, an optimized formulation was selected, that is, 1% (w/v) itraconazole with 0.3% (w/v) PVP40 and 0.03% (w/v) SLS. Three different formulations (different milling minutes and hence different sizes) were milled using 0.3% (w/v) PVP and 0.03% (w/v) SLS, as described above, and spray drying was performed with mannitol (drug–mannitol ratio = 1:2.5, w/w). The particle sizes of the optimized formulations were unmilled formulation, 10 μm; 2 min milled formulation, 750 nm; and 75 min milled formulation, 280 nm. As shown in the DSC thermogram (Fig. 5) and PXRD (Fig. 6), no polymorphic changes were observed during milling or spray-drying processing. As shown in the DSC and PXRD (Figs. 5 and 6), mannitol crystallized during spray-drying processing and thus mannitol melting and X-ray diffraction is observed. Itraconazole stayed crystalline during wet milling or spray-drying processing and no polymorphic transformation (as no other polymorphs are known so far) or amorphization was observed.19, 20


Contact Angle Measurement
As shown in Table 7, the contact angles of nanocrystalline spray-dried powder formulations were smallercompared with the unmilled formulations. This suggests that the nanomilled spray-dried itraconazole powder has improved wetting properties. [Please note: Observed contact angle values, smaller than 90° for spray-dried milled or un-milled itraconazole powder, could be attributed to the presence ofmannitol].
| Sample | Contact Angle (θ) |
|---|---|
| Crystalline unmilled spray dried formulation | 37.1° |
| Nanocrystalline spray-dried formulation (2 min milled) | 32.7° |
| Nanocrystalline spray-dried formulation (75 min milled) | 30° |
In Vitro Dissolution Performance
The optimized itraconazole crystalline formulations were utilized for in vitro dissolution and in vivo oral bioavailability. The effect of milling time (or particle size) on percent release is shown in Figures 7 and 8. The nanocrystalline liquid formulation (milled for 75 min) showed faster release or dissolution rate compared with the 2 min milled or unmilled formulation (Fig. 7). In the case of the 75 min milled nanocrystalline formulation, drug dissolution was completed in approximately 30 min compared with 120 min for the 2 min milled nanocrystalline formulation. The unmilled crystalline formulation required approximately 300 min for complete dissolution. The release or dissolution rate followed particle-size-dependent dissolution. Similar dissolution rate profiles were observed for the spray-dried powders, that is, the 75 min milled formulation was faster compared with the 2 min milled formulation followed by the unmilled formulation (Fig. 8). In the case of spray-dried powders, the dissolution profiles were slower compared to the liquid crystalline formulation (Figs. 7 and 8), which is probably due to time required for wetting of the spray-dried powders. The dissolution rate of the spray-dried powder formulations also followed size-dependent dissolutionrate.


In Vivo Performance
As shown in Figure 9 and Table 8, the nanomilled spray-dried powder formulation (Cmax = 244.85 ng/mL) has a much superior absorption profile compared with the 2 min milled (Cmax = 26.07 ng/mL) and unmilled (Cmax = 20.78 ng/mL) formulations. The bioavailability of the 2 min milled formulation is 2.8-fold higher compared with that of unmilled formulation. However, the 75 min milled powder formulation was more than 20 times higher compared with that of the unmilled powder formulation. The very significant increase in the bioavailability with decrease in particle size from 750 to 280 nm powder formulation indicates the importance of understanding the effect of particle size on bioavailability. In addition, the milled formulations had smaller or shorter Tmax (∼8 h) compared with unmilled formulation (∼10 h). The in vivo oral absorption data follows the rank order in vitro dissolution results, indicating that in vitro dissolution may be used as a predictor of particle size and hence bioavailability.
| Formulation | Cmax (ng/mL) | Tmax (h) | AUC (0–24) (ng/mL h) | Fold Increase Compared to Unmilled Formulation |
|---|---|---|---|---|
| Seventy-five minutes milled spray-dried powder (280 nm) | 244.85 | 8 | 3043.02 ± 1231 | 20 |
| Two minutes milled spray-dried powder (750 nm) | 26.07 | 8 | 421.49 ± 191 | 2.8 |
| Unmilled spray-dried powder (10 μm) | 20.78 | 10 | 148.92 ± 131 | 1 |

CONCLUSIONS
In much of the published literature, freeze-drying is utilized to stabilize nanosized formulations. An innovation in the present work is that spray drying was successfully applied to achieve stable nanocrystalline dried powders to enhance oral bioavailability. This is particularly important because spray drying is significantly less expensive than freeze-drying and so can reduce production costs and ultimately health care costs. Another innovation is the use of solubility studies to select stabilizers and stabilizer concentrations to formulate nonaggregating nanocrystalline formulations. This approach can be adapted by the industry for routine screening of stabilizers rather than the current more time-consuming and expensive trial and error approach. DoE studies were utilized for formulation and optimization of stabilizer concentrations. On the basis of this study, a DoE approach is recommended to optimize stable formulations of other poorly soluble APIs. Contact angle measurements were performed on compressed discs of the spray-dried powders. The contact angle values followed the particle size trend, that is, improved wetting with smaller sized crystals. Accordingly, contact angle measurements may be utilized to screen formulations. This study showed the importance of particle size on the dissolution rate and oral bioavailability of powder formulations to enhance absorption of poorly soluble APIs (BCS class II/IV). It is known that nanoformulations can enhance dissolution and bioavailability. However, here it is shown that within the nanosize range very significant differences in bioavailability occur. The nanocrystalline itraconazole powder formulation with particle size of 280 nm was shown to have bioavailability seven times that of nanocrystalline itraconazole with a particle size of 750 nm.
ACKNOWLEDGMENTS
This current research was funded and supported by FDA/CDER/OPS (contract number HHSF223201110077A). The authors are grateful to Dr. Anson Ma (associate professor, University of Connecticut) and Dr. Xiuling Lu (assistant professor, University of Connecticut) for use of the contact angle goniometer and HPLC–fluorescence, respectively. Also, we would like to thank Namita Tipnis (graduate student, University of Connecticut) for her help in the animal studies.

