Comprehensive assessment of extraction methods for plant tissue samples for determining sodium and potassium via flame photometer and chloride via automated flow analysis#
This article has been edited by Sven Schubert.
Abstract
Background and aims
Determination of sodium (Na), potassium (K), and chloride (Cl) content in plant tissue is required for research related to salinity resistance in plants. Standard methods are available to extract these elements from dried plant material, but these methods are often costly, relatively dangerous, or time consuming. Many authors modify extraction methods substantially without proof of comparability across methods.
Methods
Here, dried tissues of two varieties of rice and three varieties of sweet potato subjected to salt stress were extracted for Na and K using six different extraction methods (1–6) and for Cl using three Cl-free extraction methods (2, 4, 5) for Cl: (1) the VDLUFA standard method, consisting of ashing, and heat extraction in hydrochloric acid (HCl), (2) hot water pressure extraction via autoclave, (3) extraction with 1 M HCl overnight, (4) hot water extraction at 90°C for 1 h, (5) acetic acid extraction in hot 1 M acetic acid for 2 h, and (6) extraction with a microwave using nitric acid. Na and K were determined via flame photometer and Cl via automated flow analysis.
Results
Na and K concentrations varied little among different extraction methods as compared to the VDLUFA standard method, and for Cl, all extractions resulted in similar tissue Cl concentrations.
Conclusions
Ultimately, the choice of extraction method depends on the instrumentation and lab equipment necessary, available budget, the available amount of sample, and time constraints which should be decided according to the experiment. For reasons of comparability among publications, methods applied should be clearly described since results vary depending on the method chosen.
1 INTRODUCTION
Determination of sodium (Na), potassium (K), and chloride (Cl) concentrations and content in plant tissue is at the heart of any research related to salinity resistance in plants. Na and K contents in plant tissues are often determined via flame photometry (Havre, 1961; Puffeles & Nessim, 1957), atom absorption spectrometry (AAS) (Dionisio-Sese & Tobita, 2000), or inductively coupled plasma–atomic emission spectrometer (ICP-AES) (García-Morales et al., 2012).
Samples are either liquid, such as that of a hydroponic solution, rain, or irrigation water, and can be analyzed directly or after dilution, or dry plant material that needs to be extracted prior to analysis. There are some standard methods available to extract these elements from dried plant material, but these methods are often tedious, costly, relatively dangerous, or time-consuming. Many authors modify the extraction methods substantially without proof of comparability across methods.
In Germany, the official standard method has been defined by VDLUFA, the Association of German Agricultural Analytic and Research Institutes e. V., an organization that sets standards for many laboratory tests. In the standard method for determining Na and K (VDLUFA, 2012), 2 g of sample were ashed, extracted using hydrochloric acid (25%), heated in a water bath, filtered, and then analyzed. This method is time, energy, and material intensive and, due to the use of strong acid, more hazardous than other methods. The VDLUFA method has not been recognized as a global standard, and 2 g of dried plant material required for this method is often not available. Therefore, generally applicable methods for smaller sample sizes are needed, such as published earlier by Leyton (1951), Puffeles and Nessim (1957), or the similarly hazardous method of Hald (1947) who applied 4 N sulfuric acid before ashing the sample and digesting it in concentrated hydrochloric acid.
Many different extraction methods are available from literature; however, few have been directly compared using the same samples. In this study, we focus on rice and sweet potato, as examples for important monocotyledonous and dicotyledonous C3 staples that are often threatened by salinity, for a first-time direct comparison of various extraction methods.
Although the German standard method works from ash and thus requires large amounts of dry sample, in other methods dry plant samples are extracted directly in acid or hot water. For acid digestion, different acids and concentrations can be used. For rice tissues, for example, Campbell et al. (2017) digested the samples in 0.1 M nitric acid for 8 h at 70°C, whereas Kibria et al. (2017) used a mixture of nitric acid and perchloric acid and heated the mixture until dense white fume was observed. Another approach extracts the samples in 1 M hydrochloric acid on a shaker overnight before filtering to remove all organic particles (Asch et al., 1999; Yoshida et al., 1976). Gerona et al. (2019) extracted the samples in 0.1 M acetic acid for 2 h at 85°C and left them overnight at room temperature before filtration similar to Yeo (1992) and Tatar et al. (2010) who extracted at 90°C. For sweet potato, Evoi et al. (2017) used nitric and perchloric acid mixture after pretreatment with concentrated nitric acid to digest 1.0 g of sample for determining the Na and K concentrations.
Hot water extraction is not so widely reported in literature but has some advantages. It is not hazardous, and the extract allows determination of ions otherwise masked by the extraction agent, such as chloride (Cl) for example, when tissue samples are extracted with HCl. For rice samples, Matsushita and Matoh (1991) boiled 0.05 g of dried sample for 60 min to extract Na, whereas Dionisio-Sese and Tobita (2000) used an autoclave to extract the samples at 121°C for 20 min following a boiling water treatment of 1 h. For sweet potato, the only hot water extraction for Na and K was reported by Begum et al. (2015), following the protocol of Karmoker and Van Steveninck (1978).
Chloride concentrations from plant extracts are determined via titration, for example, using mercury nitrate after extraction in acidic sodium nitrate solution (VDLUFA, 2012). Silva et al. (1998) compared different titration methods for determining Cl concentrations in coffee leaf extracts, including a potentiometric titration, where silver wire was used as indicator electrode to determine the endpoint of titration. They stated that the mercurimetric method, using mercury nitrate and diphenycarbazone, was most convenient. Alamgir et al. (2007) extracted Cl from rice samples in 0.1 M acetic acid at 90°C for 2 h, whereas Islam et al. (1983) used an ion-selective electrode to avoid dry ashing or wet oxidation procedures. Gaines et al. (1984) extracted dried and milled tissue of soybean using 0.1 M sodium nitrate solution, 5 min of shaking, and measured the filtered solution in an Auto-Analyzer II with mercuric thiocyanate for colorimetric determination. Finally, Karmoker and Van Steveninck (1978) extracted labelled 36Cl with hot water and related the radioactive counts to the concentration in the tissue.
The aim of this study is to test different extraction methods for comparability of determining Na, K, and Cl concentrations from plant tissue samples. Extracts of dried tissue of two varieties of rice (Oryza sativa) and three varieties of sweet potato (Ipomoea batatas) subjected to salt stress were compared using six different extraction methods for Na and K (1–6) as well as three Cl-free extraction methods (2, 4, 5) for Cl: (1) the VDLUFA standard method, consisting of ashing, and heat extraction in hydrochloric acid (HCl), (2) hot water pressure extraction via autoclave, (3) extraction with 1 M HCl overnight, (4) hot water extraction at 90°C for 1 h, (5) acetic acid extraction in hot 1 M acetic acid for 2 h, and (6) extraction with a microwave using nitric acid.
2 MATERIALS AND METHODS
All solutions and standards described here were prepared with pro-analysis grade chemicals (obtained from Sigma–Aldrich, Germany) in deionized water.
2.1 Plant material and treatment
Seeds of two rice varieties [IR 64, and IR 31785-58-1-2-3-3 (further IR31785)] were pre-germinated on filter paper at room temperature for 2 days, followed by 7 days growth in sand. Seedlings were transplanted in 1-L pots containing half strength Yoshida nutrient solution at pH 5.8 (Yoshida et al., 1976). Nutrient solution was changed to full strength after 1 week, and renewed weekly. The salt treatment, nutrient solution containing 60 mM NaCl, was started 4 weeks after transplantation for half of the plants. For each variety and treatment, there were five replicates.
Three sweet potato varieties (CIP 189151.8, CIP 106082.1, CIP 420001) were propagated via stem cuttings transferred to aerated 50% Yoshida nutrient solution (Yoshida et al., 1976). After 1 week, nutrient solution was changed to 100% and renewed weekly. Three weeks after transplanting, a salt treatment of 100 mM NaCl was applied. Five weeks (sweet potato) or 6 weeks (rice) after transplanting, the plants were harvested, rinsed with deionized water, divided in roots, stems, and leaves. The plant material was oven dried until constant weight for 2 days at 70°C in a drying oven (ULM500; Memmert, Germany). The dried samples were milled in 20-mL scintillation vials (Nerbe, Germany), using six small and three large steel milling balls (3 mm and 5 mm diameter, VWR, Germany). The powdered samples were used for all extraction methods (rice) or for VDLUFA, Autoclave and HCl extraction (sweet potato).
2.2 Extraction methods
Note that 20-mL plastic vials (Scintillation vials) and qualitative filter paper 413 (VWR) were used for all extraction methods.
2.2.1 VDLUFA method 10.1.1/10.2.1
The original method was used with small modifications in the used amounts, 1/5 of all amounts was used (Puffeles & Nessim, 1957). Approximately 2 g of each sample were ashed in a muffle furnace at 450°C for 3 h. The ash was transferred to 100-mL measuring flasks, using 50 mL deionized water and 10 mL hydrochloric acid (25%). The solutions were heated at 90°C for 2 h in a water bath, cooled down, transferred to 100-mL volumetric flasks, and filled up to the mark using deionized water. Samples that were not clear were filtered prior to measurements.
2.2.2 Autoclave
For hot water pressure extraction, the method of Dionisio-Sese and Tobita (2000) was followed with modifications. Note that 0.1–0.15 g dried, milled material was weighed in 15-mL centrifuge tubes, 10 mL of deionized water was added, and the lids were closed loosely. Samples were autoclaved at 121°C for 1 h, subsequently cooled, filtrated, transferred to 100-mL volumetric flasks, and filled up to the mark using deionized water.
2.2.3 Hydrochloric acid
We followed the method described by Yoshida et al. (1976) with minor modifications. Note that 0.1–0.15 g of dried, ground sample was weighed into 20-mL plastic vials (Scintillation vials), and 10 mL 1 N hydrochloric acid was added, while strong shaking was avoided to make sure to keep the sample totally submerged. The samples were shaken overnight (16 h) at room temperature (20°C). Samples were filtrated into 100-mL volumetric flasks and made up to 100 mL using deionized water.
2.2.4 Hot water
The extraction with hot water was described by Matsushita and Matoh (1991). Note that 0.1–0.15 g of dried, milled sample was extracted in 100 mL deionized water in a 90°C water bath for 60 min. After cooling the samples, the extracts were filtrated to remove particles.
2.2.5 Acetic acid
Following Yeo (1992), we used 0.1–0.15 g dried and ground material weighed in 15-mL centrifuge tubes (Roth, Germany), added 10 mL 1 M acetic acid, and heated the samples at 90°C for 2 h. Samples were cooled, filtrated into 100-mL volumetric flasks, and volume was made up using deionized water.
2.2.6 Microwave
For extracting plant tissue samples with a microwave, we modified the protocol for microwave digestion for determination of multi-elements by inductively coupled plasma mass spectrometry from Wu et al. (1997). Note that 0.15–0.2 g dried and ground material was weighed into microwave extraction tubes (mws Mikrowellen-Laborsysteme, Germany), and 2 mL deionized water, 4.5 mL concentrated nitric acid, and 1.5 mL hydrogen peroxide were added. Tubes were closed and samples were immediately extracted in an ETHOS.lab (mws Mikrowellen-Laborsysteme) microwave (15 min to heat to 170°C, then 20 min at 200°C), transferred into 100-mL volumetric flasks, and volume was made up using deionized water.
2.3 Standards and flame photometer measurements
Standards were purchased from Jenway (UK) as 1000 ppm sodium or potassium standard and diluted to 100, 50, 25, and 12.5 ppm using deionized water.
Sodium and potassium concentration was determined via flame photometer (PFP7; Jenway, UK) using an exponential calibration curve. Samples were diluted with deionized water to fit the concentration range of the calibration.
2.4 Determination of chloride
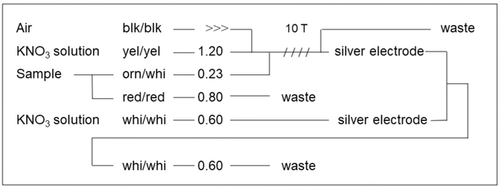
Chloride concentrations were determined via an automated flow system connected to a chart recorder (ABB Goerz SE120, Germany). The main driving solution was 0.5 M potassium nitrate, containing 3 mL 1 M nitric acid, 3 mL 0.003 M sodium chloride solution, and 0.5 mL Brij 30 per 1000 mL. Samples were mixed with the potassium nitrate solution and pumped through a silver tube coated with 0.19 M iron (III) chloride and 20 mL 1 M hydrochloric acid in 100 mL. The connection scheme and the flow rates according to the diameter of tubes used are given in Figure 1. A chart recorder records the electrical difference to a second coated silver tube containing potassium nitrate solution as reference. Every 5000 samples, the tubes were cleaned using 0.2 M nitric acid and coated again using the iron (III) chloride solution. Standard stock solution was 100 mM sodium chloride solution, the standards for calibration were diluted to obtain 30, 20, 10, and 2.5 ppm. Chloride concentrations of 0.5–30 ppm can be determined, extracts with higher concentrations have to be diluted. forty samples were measured per hour.
3 RESULTS
3.1 Comparison of extraction methods for sodium and potassium
Na and K concentrations for all extracts obtained via the different extraction methods were determined via flame photometer. Figure 2 compares sodium concentrations determined from rice samples extracted with the VDLUFA extraction methods to the sodium concentrations determined for the same samples extracted with the other extraction methods. In general, sodium concentrations from 0 to 25 mg Na per g dry weight were quite similar among the different extraction methods and followed a linear trend close to the 1:1 line. Extraction with HCl resulted in a slight overestimation of sodium concentrations, whereas extraction with hot water, acetic acid, with an autoclave extraction, or microwave resulted in small underestimations of Na concentrations. Treatment or variety did not affect the extraction efficiency for Na.

K concentrations (Figure 3) determined from the same extracts showed the same linear trend for each extraction method compared to the VDLUFA extraction, following the 1:1 line. Relative to the VDLUFA method, extracting with HCl leads to slightly higher K concentrations compared to the standard method, whereas extracting via autoclave resulted in minor underestimations of the K concentrations. The closest linear agreement was found between K concentrations in hot water extracts, extraction via microwave, and those extracted according to the VDLUFA method. The saline treatment did not change this relation, and no difference related to extraction method was found between the two varieties.
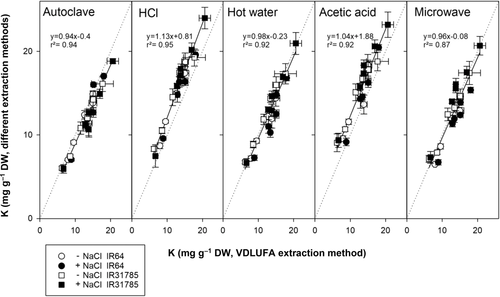
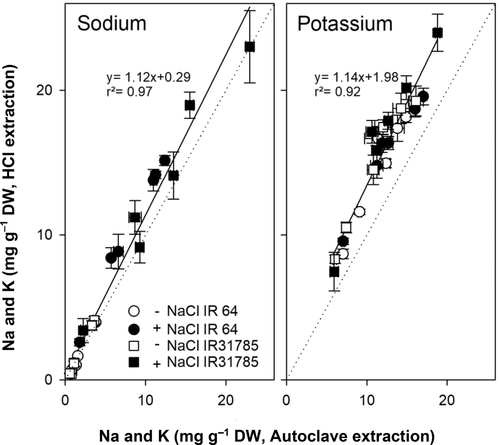
Figure 4 compares the two extraction methods commonly used in the laboratory of the authors, namely extraction with HCl and via autoclave. Extraction with HCL results in Na and K concentrations 13% and 30% higher, respectively, compared to water extraction via autoclave. Neither treatment nor variety affected this relationship.
3.2 Determination of chloride concentration in extracted samples
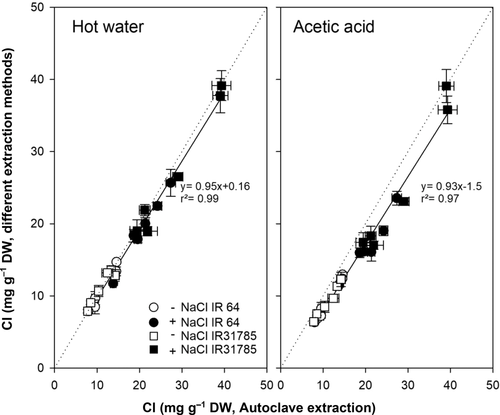
Cl concentration was measured in extracts obtained via hot water, acetic acid, and autoclave. Figure 5 compares the Cl concentrations found from hot water and acetic acid extraction to the values found after extraction via autoclave. Extraction with acetic acid leads to slightly underestimated Cl concentrations compared to extraction via autoclave, whereas extraction with hot water shows almost the same results as extraction via autoclave.
3.3 Test of extraction methods using a dicot plant
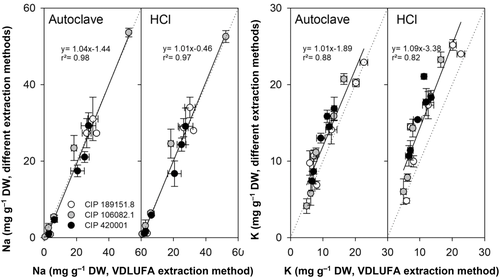
A small subset of sweet potato samples was used to determine the applicability of the findings to other crops. VDLUFA extraction was compared to autoclave and HCl extraction (Figure 6). Na concentration of samples extracted via the VDLUFA method was linearly correlated to Na concentrations found in samples extracted via autoclave (R2 = 0.98) and HCl (R2 = 0.97). K concentrations also correlated between the extraction methods, but the correlation factor was lower (R2 = 0.88 and 0.82, respectively). Extraction with HCl detected higher K concentrations than the VDLUFA method.
4 DISCUSSION
Out of many different extraction methods for the determination of Na, K, and Cl from plant samples, we tested six against each other for Na and K concentrations from the same tissue samples. The Na and K concentrations found in rice tissue with the different methods showed reasonable agreement (Figures 2 and 3). This confirms reports from Hodson et al. (1985), who showed that extraction with nitric acid compared to extraction with hot water for a wild grass (Agrostis stolonifera) produced similar results. For dicots, Matejovic and Durackova (1994) compared several dry and wet digestions methods for Alfalfa and found no differences in Na and K concentrations when using different extraction methods, which was confirmed our study with sweet potato (Figure 6). Digestion and extraction of ions with HCl generally produced higher values for K than all other methods (Figures 3, 4, and 6); thus, it is important to know which extraction method was used when directly comparing K results across studies (Gholizadeh & Navabpour, 2011).
Chloride determination is not possible from all tested extracts. A pH below 2, as in extracts obtained with the VDLUFA method and from microwave digestion, might damage the silver electrodes in the autoanalyzer. High concentration of Cl in the extraction solution, such as in the VDLUFA method and when extracting with HCl, results in high background Cl values that do not allow differentiating sample Cl concentrations from the extraction solution. Nevertheless, Cl determination from water-based extractions, particularly with hot water or using an autoclave, produced plausible and reproducible results for both Cl in rice (Figure 5) and sweet potato tissue (data not shown).
Since we could show that all extraction methods potentially produce comparable results, the final choice of method may depend on other factors such as required instrumentation, costs per sample, consumables required, or time to complete the analysis.
For the VDLUFA standard method, a muffle furnace, a large number of crucibles, and a water bath are required for the extraction (Table 1). Ashing samples is usually done overnight, due to the muffle furnace’ relatively long heating and cooling requirements, leading to a relatively long minimum time requirement per batch (Table 2). The number of samples that can be processed in one batch is limited by the size of both water bath and furnace. The standard method has some drawbacks: (1) the use of highly concentrated acid (25% HCl), (2) high costs per sample (Table 1) (mainly due to laboratory chemicals and consumables), and (3) a relatively large amount of dried sample, which is hard to obtain in salt stress experiments when single plants or individual plant organs will be analyzed.
| VDLUFA method | Autoclave | HCl | Hot water | Acetic acid | Microwave | |
|---|---|---|---|---|---|---|
| Amount of sample | 2 g | 0.1–0.15 g | 0.1–0.15 g | 0.1–0.15 g | 0.1–0.15 g | 0.15–0.2 g |
| Hazardous substances | 25% HCl | – | 1 M HCl | – | 1 M CH₃COOH | Conc. HNO₃ |
| Required machinery | Muffle furnace, water bath | Autoclave | Shaker | Water bath | Water bath | Microwave digestion system, fume hood |
| Estimated minimum cost for machinery | 3500 € | 1500 € | 800 € | 500 € | 500 € | 10,000€ |
| Cost per sample | 0.65 € | 0.24 € | 0.22 € | 0.24 € | 0.24 € | 0.23 € |
| VDLUFA method | Autoclave | HCl | Hot water | Acetic acid | Microwave | |
|---|---|---|---|---|---|---|
| Ash samples (min) | 900 | – | – | – | – | – |
| Extraction time (min) | 120 | 60 | 900 | 60 | 120 | 100 |
| Filter (min) | – | 60 | 60 | 60 | 60 | – |
| Working time per sample (min:s) | 5:30 | 1:30 | 1:30 | 2:00 | 2:00 | 4:00 |
| Samples per batch | 25 | 120 | 120 | 50 | 50 | 14 |
| Minimum time per batch (min) | 1240 | 300 | 1260 | 220 | 280 | 156 |
Hydrochloric acid extraction only requires a laboratory shaker of any kind (Table 1) and some materials such as scintillation vials and filter paper. Theoretically, even the shaking could be done manually. Samples are extracted in weakly concentrated acid and the costs per sample are quite low (Table 1). However, filtration is required to remove any particles prior to flame photometry. Overnight extraction on the shaker leads to similarly long minimum batch times as in the VDLUFA method, (Table 2); however, depending on the shaker, a large number of samples can be processed per batch and the entire procedure is not labor-intensive.
Hot water extraction does not need expensive instrumentation and has low costs for consumables (Table 1). It also needs a short extraction time of only 60 min (Table 2), and the number of samples per batch depends on the size of the water bath. Filtrating the samples is necessary to avoid blockage in the flame photometer caused by particles in the extract.
Acetic acid extraction only needs a water bath that is adjustable to 90°C (Table 1), the extraction takes 2 h per batch and the size of one batch depends on the size of the water bath. The costs per sample are low due to low requirements for consumables and chemicals. The extraction medium is weakly concentrated acetic acid.
Autoclave extraction requires an autoclave, which is standard equipment in many labs. Due to the relatively large size of autoclaves and the use of 15-mL centrifuge tubes, the potential number of samples per batch is high (Table 2). The extraction depends on pressure and high temperatures and, as before, subsequent filtration of the extracts is required. The costs per sample are low (Table 1). Only centrifuge tubes, filter papers, and vials for measurement and storage are needed. Few examples for extraction by autoclave exist in literature. Dionisio-Sese and Tobita (2000) autoclaved their samples for 20 min and then boiled them for 1 h in a water bath. We found that extending the extraction time in the autoclave can replace the subsequent boiling. This renders the method faster and less tedious since the hot samples do not need to be handled again, and the results are still comparable to the other methods (Figures 2-4 and 6).
The nitric acid microwave extraction needs more sophisticated instrumentation. The ETHOS lab microwave is often used to extract samples for determining nutrients such as phosphate in plant tissue. The results presented here show that K and Na could be determined reliably from the same extract (Figure 3). Since the extraction using the microwave is time-consuming (Table 2), allows only for a small number of samples per batch, requires expensive instruments and extraction tubes, and uses hazardous chemicals for the extraction (Table 1), we do not recommend this method for determining Na and K from plant samples.
5 CONCLUSIONS
Since no comprehensive comparison of extraction methods for Na, K and Cl is available in literature, but substantial research focusses on salinity and its effects on plants, we tested here six extraction methods for determining Na and K via flame photometry and three methods for determining Cl with an autoanalyzer. Tissue samples from rice and sweet potato obtained from plants grown hydroponically in the absence and presence of salt were subjected to all extraction methods. Neither plant species and variety and nor salinity influenced the reliability of the different extraction methods. All methods gave reliable and reproducible results. Only overnight extraction with HCl found tissue K concentrations that were several percent higher than other methods, including the German standard method, VDLUFA. We included a comparison of costs, applicability, time efficiency, and sample through-put to allow researchers finding the method most adapted to their conditions. With this, we hope to provide a comprehensive reference to extraction methods for future publication to increase comparability of results across studies.
ACKNOWLEGMENTS
The authors are grateful to Prof. Dr. Uta Dickhöfer and Herrmann Baumgärtner from the University of Hohenheim for access to their muffle furnace. Help of Dr. Manfred Trimborn in constructing the chloride autoanalyzer device is greatly appreciated. Open Access funding enabled and organized by Projekt DEAL.
Open Research
DATA AVAILABILITY STATEMENT
The data that support the findings of this study are available from the corresponding author upon reasonable request.


