Patients with unilateral ankle arthritis have decreased discrete and time-series limb symmetry compared to healthy controls
Abstract
Patients with ankle arthritis (AA) have side-to-side limb differences at the ankle and in spatiotemporal measures; however, the degree of symmetry between limbs has not been compared to a healthy population. The purpose of this study was to determine differences in limb symmetry during walking for discrete and time-series measures when comparing patients with unilateral AA to healthy participants. Thirty-seven AA and 37 healthy participants were age, gender, and body mass index matched. Three-dimensional gait mechanics and ground reaction force (GRF) were captured during four to seven walking trails. GRF and hip and ankle mechanics were extracted bilaterally for each trial. The Normalized Symmetry Index and Statistical Parameter Mapping were used to assess discrete and time-series symmetry, respectively. Discrete symmetry was analyzed using linear mixed-effect models to determine significant differences between groups (α = 0.05). Compared to healthy participants, patients with AA had decreased weight acceptance (p = 0.017) and propulsive (p < 0.001) GRF, ankle plantarflexion (p = 0.021), ankle dorsiflexion (p = 0.010), and ankle plantarflexion moment (p < 0.001) symmetry. Significant regions of difference were found between limbs and groups throughout the stance phase for the vertical GRF force (p < 0.001), the ankle angle during push-off (p = 0.047), the plantarflexion moment (p < 0.001), and the hip extension angle (p = 0.034) and moment (p = 0.010). Patients with AA have decreased symmetry in the vertical GRF and at the ankle and hip during the weight acceptance and propulsive portions of the stance phase. Therefore, clinicians should try a non improving symmetry focusing on changing hip and ankle mechanics during the weight acceptance and propulsive phases of gait.
1 INTRODUCTION
Ankle arthritis (AA) is a degenerative disease that results in ankle pain and impacts a person's ability to walk.1 While millions of older adults have been diagnosed with arthritis,2 AA is often diagnosed at an earlier age than knee or hip arthritis.1 The earlier onset and diagnosis of AA disrupts productive working years in this population.1, 3 Patients with AA frequently report pain, discomfort, and an inability to carry out daily tasks such as walking.4, 5 Moreover, patients with AA have a self-reported lower quality of life compared to a healthy population, including lower general health,6 mental health scores,7 and restricted movement of the arthritic joint.8
Various self-reported assessments have been used to describe the impact of AA on daily function in these patients reporting significant physical impairment during daily functional tasks.5, 7 The patient-reported outcomes that have been utilized in this population include a visual analog pain scale,9 the American Orthopedic Foot and Ankle Society hindfoot score,10 the Short Musculoskeletal Function Assessment,11 and the Foot and Ankle Disability Index12 each of which demonstrates performance deficiencies associated with end-stage AA.13-15 Due to the differences in self-reported function between patients with AA and healthy individuals, measures of physical performance have been essential for understanding the impact of AA on daily function.16-18 In patients with AA, walking speed, four-square step test time, and static balance are not associated with patient-reported outcomes indicating that these functional tasks provide different information than the patient-reported outcomes and all the information essential for understanding the abilities of this population to navigate daily functional tasks.13
In addition to assessing patient-reported outcomes and measures of physical performance, there have been several studies that have examined changes in gait mechanics in patients with AA.19-21 These studies have reported that patients with AA have reduced stride length, step length, peak ankle plantarflexion (APF), peak ankle dorsiflexion (ADF), peak ankle plantarflexion moment (APF-M), peak hip flexion (HF), peak hip extension (HE), peak hip flexion moment (HF-M), knee flexion, knee extension, knee range of motion, peak knee extension moment, and propulsive ground reaction force (GRF) compared to a healthy population.19-21 Furthermore, patients with AA do not bear as much weight on and cannot fully extend the talocrural joint on their arthritic limb.6-8 Although these changes in gait have been identified on the affected limb in patients with AA, there are only two studies that have evaluated side-to-side differences in patients with AA.4, 22 These side-to-side differences were determined by evaluating the average movement of the arthritic limb compared to the unaffected limb. While between limb differences can provide an important assessment of how one limb functions relative to the other, this comparison is not a measure of symmetry. It is essential that a symmetry index is used in the assessment of side-to-side symmetry and is calculated during consecutive steps in a walking cycle for each trial and then the symmetry outcome can be averaged. This method allows for an understanding of how the movement of one limb impacts the other during the gait cycle, which cannot be understood when comparing the mean outcome between limbs. Symmetry, differences between the arthritic and unaffected lower limbs, can be an indication of compensatory gait patterns that are the result of pain or prior injury resulting in greater loading of adjacent or contralateral joints putting those joints at greater risk of injury or degeneration.23-25 Decreased limb symmetry is associated with a decline in physical performance,26-28 increased energy expenditure,18 and increased fall risk.29, 30
When evaluating temporal gait parameters between limbs in patients with unliteral AA, statistically significant differences were found in mean swing time and mean stance time.4, 22 Furthermore, peak APF-M and ADF have been reported in patients with unilateral AA when comparing the arthritic and unaffected limb.4 However, previous studies are limited as they only evaluated spatiotemporal measures and ankle kinetic and kinematic without using a symmetry index and they lack a control group for comparison.
Patients with AA also have altered hip mechanics and GRFs.31, 32 Patients with AA have a greater HF-M and decreased HE angle when compared to healthy participants, which could be a compensation for the decreased ankle moment that is needed during terminal stance to drive the next step in the gait cycle.31, 32 In patients with AA, knee mechanics are not altered to compensate for changes that have been reported at the ankle and hip.31 Additionally, patients with AA have decreased vertical GRF compared to a healthy population throughout the gait cycle and therefore the examination of the weight acceptance (first peak of the vertical GRF) and prolusion (second peak of the vertical GRF) are essential for understanding how the GRF could be related to the other compensatory patterns seen in lower extremity kinematics and kinetics in patients with AA.21, 22, 26 Furthermore, a comparison to an age and gender-matched healthy cohort is essential in the interpretation of the symmetry changes for patients with AA.4, 22, 33, 34 Therefore, an evaluation of ADF, APF, and APF-M symmetry should be conducted to confirm previous limb difference findings and to compare symmetry in a healthy control group to a patient population using the same symmetry measure. HE, HF-M, weight acceptance GRF, and propulsion GRF symmetry should also be evaluated in patients with AA and compared to healthy controls to determine if decreased symmetry at the ankle results in symmetry changes in limb loading and hip kinematics.
Gait mechanics research often focuses on discrete measures from different portions of the gait cycle without considering the differences that may exist throughout the gait cycle. Compared to a healthy cohort, patients with AA have altered ankle and hip mechanics during the propulsive or terminal stance phase, no differences in knee mechanics and altered GRF throughout the stance phase on the affected limb.33, 35 It is important to assess limb symmetry differences at the ankle, hip, and in the GRF across stance phase using a time series evaluation in addition to the assessment of discrete outcome measures to help determine where to focus rehabilitation efforts to improve walking mechanics.33, 36 Unlike other symmetry measures that use a single time point (discrete measurement) in the series to calculate limb symmetry, Statistical Parameter Mapping (SPM) uses every time point in the series to determine significant differences throughout the gait cycle.37-39 SMP has been utilized in the evaluation of gait symmetry and has the advantage of identifying specific portions of stance phase during which the movement is asymmetric.37 Understanding limb symmetry differences between patients with AA and a healthy population could provide valuable insight into a patient's overall abilities, serve as a bases for functional evaluations, help with rehabilitation program planning,24 and lead the development of targeted interventions.19
The purpose of this study was to compare discreate and continuous limb symmetry during overground walking at a self-selected speed between patients with end-stage unilateral AA and age-matched healthy controls. We hypothesized that patients with AA would have decreased limb symmetry in peak ADF, APF, APF-M, HE, HF-M, weight acceptance GRF, and the propulsive GRF when compared to healthy controls. We also hypothesized that differences between limbs would exist in patients with AA compared to healthy controls during terminal stance for sagittal plane joint angle kinematics at the hip and ankle and throughout stance phase for GRF.
2 METHODS
2.1 Patient with AA and healthy participant
Thirty-seven patients with AA from a previously collected prospective database were matched based on age, gender, and body mass index (BMI) to 37 healthy participants. Patients with AA were diagnosed with end-stage, unilateral arthritis, by a board-certified, foot and ankle fellowship trained orthopedic surgeon. Diagnoses of AA include 4 patients with osteoarthritis,19, 40 and 33 patients with posttraumatic arthritis.5, 17, 41 Patients with arthritis had their testing completed within 2 weeks of the scheduled total ankle arthroplasty. Patients with AA were excluded if they could not walk without an assistive device, had pain at more than one lower extremity joint, or had a previous lower extremity joint replacement. Healthy participants were excluded if they had a history of a major lower extremity injury or surgery, were not able to walk unassisted for at least 10 min, had lower extremity pain, or could not walk without an assistive device. All participants signed Institutional Review Board approved informed consent before study initiation.
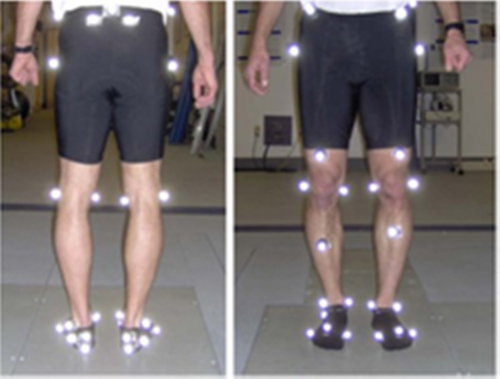
Participants wore form fitting clothing and a modified Helen-Hayes marker set was applied for data collection (Figure 1).42 Age, sex, height, and weight were recorded for each participant. The arthritic limb was identified for patients with AA and dominant limb was defined as the limb the participant preferred to use to kick a soccer ball for healthy participants. Pain was recorded using the visual analog pain scale9 in patients with AA only as healthy participants had to be pain-free to meet study inclusion criteria. A static trial was captured for each participant to determine the joint center for the hip, knee, and ankle and to define the segment axis system. Each participant then completed between four and seven walking trials at a self-selected walking speed while motion capture data was collected. Motion capture data for the patients with AA was captured using an eight-camera motion capture system (Motion Analysis Corporation; 120 Hz), while the healthy control data was captured with a ten-camera system (Qualisys; 120 Hz). These systems are comparable in performance and have been shown to both perform with less than a 1.0 mm error.43 The GRFs were recorded with four embedded force plates (AMTI) with a frequency of 1200 Hz for the patients with AA and 1920 Hz for the healthy participants. Data processing and analysis was completed using Visual3D (C-Motion Inc.). The motion capture marker trajectory data and the GRF data were filtered with a fourth-order recursive low-pass Butterworth filter with cutoff frequencies of 7 and 100 Hz, respectively and normalized to 101 data points during the stance phase.44
2.2 Discrete symmetry analysis
The data from patients with AA was processed with unaffected/arthritic side identified as nonsurgical/surgical side respectively, while the healthy population data was processed using dominant/nondominant respectively. The NSI ranges between −100% and 100%, where 0% indicates full symmetry.46 To evaluate the symmetry differences between the groups (AA and healthy), the absolute value of the NSI from two consecutive steps per trial were calculated using a MATLAB script (MathWorks).
A t-test was used to compare the difference in BMI, age, and walking speed between patients with AA and healthy participants. A linear mixed effect model was performed to compare the seven discrete symmetry measures calculated by the NSI between the patients with AA and healthy participants. The fixed effects were the effects of the participant group (AA and healthy) and average walking speed on each symmetry measure. The statistical analysis was completed using JMP® (Version 16; SAS Institute Inc.) with an α level of 0.05 (α = 0.05).
2.3 Time-series symmetry analysis
Joint angles, normalized GRF, and joint moments were plotted as a percentage of the gait cycle. Then, SPM was used to assess two main effects and one interaction. The first was a main effect based on limb, the arthritic/dominant and unaffected/nondominant limbs of the patients with AA and healthy participants. The second main effect was based on group (AA and healthy) and finally an interaction between limb and group was assessed. This method evaluates time-series data using suprathreshold clusters to show the significant regions of difference between parameters as previously described.37 The shaded regions of the output graphs indicate a significant difference using an α level of 0.05. A post hoc evaluation using SPM is under development and not validated; thus a series of pairwise comparisons using SPM were completed to evaluate the main effect for limb (arthritic/unaffected) to further interpret between limb symmetry in patients with AA.
3 RESULTS
3.1 Demographics
No significant difference in demographics existed between patients with AA and healthy participants (Table 1) indicating the groups were matched appropriately. However, the patients with AA walked slower than the healthy participants (p < 0.001) and report an average pain level of 69.9 ± 23.3 using the visual analog pain scale.9
| Mean | Standard deviation | p Value | ||
|---|---|---|---|---|
| Age | Healthy | 61.35 | 11.57 | 0.641 |
| AA | 60.11 | 11.29 | ||
| BMI | Healthy | 24.67 | 3.14 | 0.373 |
| AA | 25.33 | 3.19 | ||
| Walking speed | Healthy | 1.35 | 0.21 | <0.001* |
| AA | 0.87 | 0.29 | ||
- Abbreviations: AA, ankle arthritis; BMI, body mass index.
- * p < 0.05.
3.2 Discrete symmetry analysis
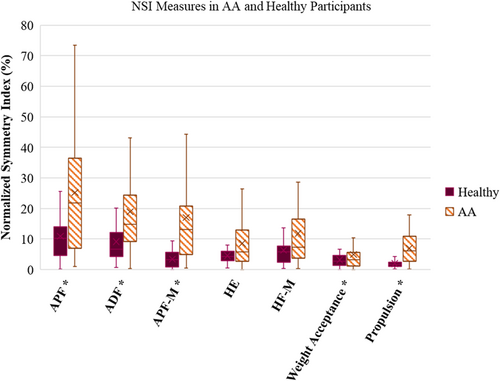
Of the seven discrete limb symmetry measures, five showed a significant difference between patients with AA and the healthy participants, with the patients with AA having less limb symmetry in all measures (Figure 2). Weight acceptance (p = 0.017) and propulsion (p < 0.001) GRF were lower in patients with AA than the healthy participants. All discrete ankle symmetry measures were statistically different between patients with AA and healthy participant, APF (p = 0.021), ADF (p = 0.010), and APF-M (p < 0.001). There were no significant differences in peak HE (p = 0.112) or HF-M (p = 0.679) between patients with AA and healthy participants.
3.3 Time-series symmetry analysis comparing limbs and groups
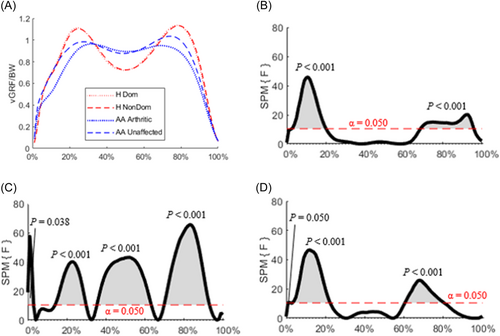
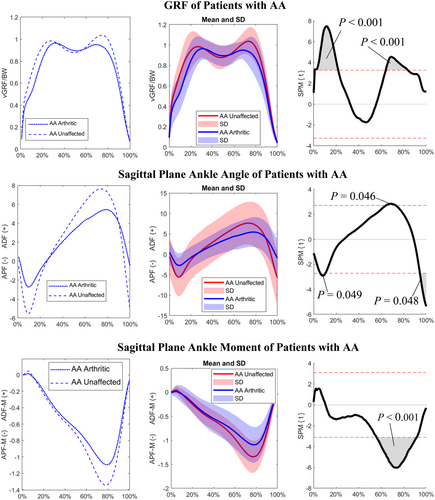
Significant regions of difference were found between the healthy participants and patients with AA across the stance phase for the vertical GRF (Figure 3). When examining the interaction between the limb and group a statistical difference was seen between heel strike and 20% of the stance phase (p < 0.001), and again from 60% to 80% of the stance phase (p < 0.001) (Figure 3D). Significant difference between groups (AA and healthy) were seen throughout the stance phase (Figure 3C), while significant regions of difference between limbs were seen within the early contact (p < 0.001) and the propulsive period (p < 0.001) of the stance phase (Figure 3B).
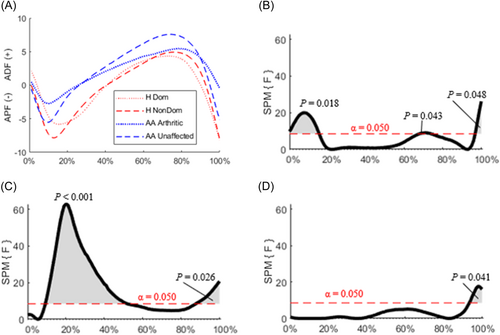
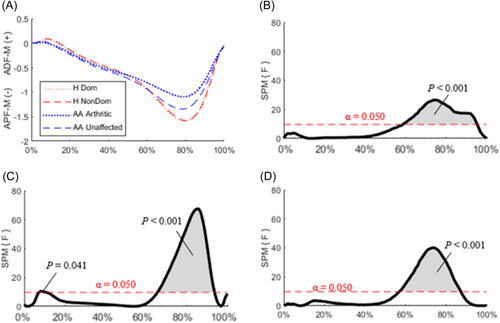
Statistically significant differences were seen in the angle during terminal stance in the interaction between limb and group (p = 0.041) (Figure 4D), in the main effects of groups (p = 0.026) (Figure 4C), and in the main effect for limbs (p = 0.048) (Figure 4B). In patients with AA, the arthritic limb demonstrated less APF and ADF than the unaffected limb (Figure 4A). Between groups, the significant regions of difference in the ankle angle were during the first 50% (p < 0.001) of stance phase and from 95% to 100% (p = 0.048) during terminal stance (Figure 4C). Differences (p < 0.001) were seen in the ankle during the terminal portion of the stance phase when there is an APF-M for both an interaction between limb and group and for the main effect of limb and group (Figure 5). Additionally, there was a difference in ankle moment between groups during the weight acceptance portion of stance phase (Figure 5C).
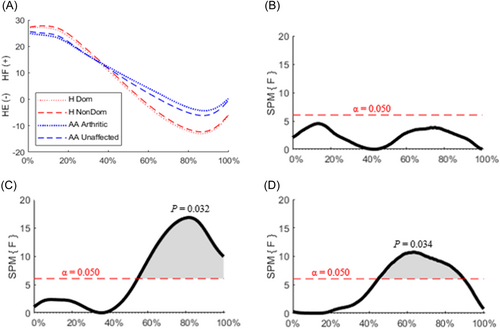
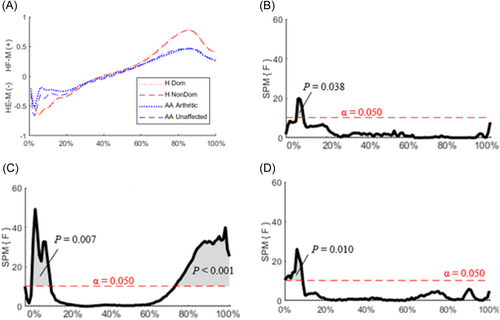
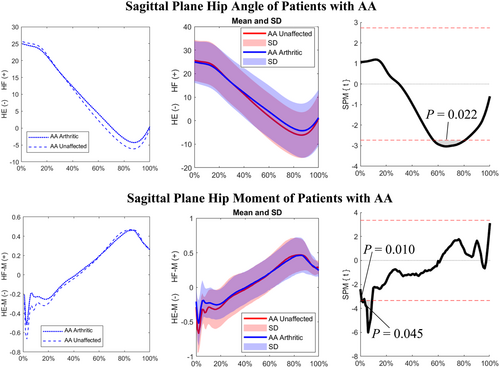
At the hip, the significant region of difference for the interaction between the limb and group was between 40% and 90% of the stance phase (p = 0.034). Between groups the significant region of difference was during the last 50% of the stance phase (p = 0.032) when the hip was extending (Figure 6C). While there was no difference in the hip angle between limbs throughout the stance phase (Figure 6B). There was a main effect for limb in the hip moment between 0% and 20% of the stance phase (p = 0.038, Figure 7B). Similarly, group differences were observed for the hip moment (Figure 7C) at the beginning (p = 0.007) and the end (p < 0.001) of the stance phase, and in the interaction between limb and group (p = 0.010) at the start of the stance phase (Figure 7D).
3.4 Time-series analysis of arthritic and unaffected limb for patients with AA
Examining the interaction between the limb and group for vertical GRF during the stance phase statistical differences were seen between 0% and 20% of the stance phase (p < 0.001) and from 60% to 80% of the stance phase (p < 0.001) (Figure 3D). When evaluating just between limbs for patients with AA similar differences (p < 0.001) were found between the arthritic and unaffected limbs (p < 0.001) during weight acceptance and propulsion (Figure 8). Differences were seen in the ankle angle during terminal stance in the interaction between the limb and group (p = 0.041) (Figure 4D). This difference during terminal stance was also seen between limbs of patients with AA (Figure 8). However, there were also differences between the arthritic and unaffected limbs around 10% (p = 0.049) and 70% (p = 0.046) of the stance phase (Figure 8). An interaction between group and limb was seen in the APF-M 55%−90% (p < 0.001) of the stance phase and this difference was seen when comparing the arthritic and unaffected limb 55%−90% (p < 0.001) of the stance phase. At the hip, the significant region of difference for the interaction between the limb and group was between 40% and 90% of the stance phase (p = 0.034) (Figure 6). The region of difference between the arthritic and unaffected limbs for the hip angle occurred between 50% and 80% (p = 0.40) of the stance phase (Figure 9). The interaction between the limb and group for hip moment occurred during weight acceptance, 0%−10% of the stance phase. This difference (p = 0.015) was also seen between the arthritic and unaffected limbs for patients with AA in the same portion of stance phase (Figure 9).
4 DISCUSSION
4.1 Discrete symmetry analysis
Using discrete analysis, this study showed that patients with AA have decreased symmetry in the sagittal plane for peak APF, ADF, and APF-M, as well as the weight acceptance and propulsive vertical GRF. However, these findings only partially support the first hypothesis. At the ankle, the side-to-side limb difference in APF, ADF, and APF-M are consistent with previous literature.4 However, this study expands the understanding of how the movement of one limb impacts the other during the gait cycle through identifying that patients with AA have decreased symmetry in APF, ADF, and APF-M when compared with a healthy population. Patients with AA were known to have decreased limb loading compared to a healthy cohort,21, 22, 26 this study further expands the understanding of limb loading in these patients by identifying a significant decrease in limb symmetry in the vertical GRF during weight acceptance and propulsion. These results indicate that in patients with AA the joints in the contralateral limb could be at greater risk from the development and progression of joint damage.23-25
In patients with AA, discrete measures of hip symmetry were not different than the symmetry in healthy participants. Previous work has demonstrated that patients with AA compensate for a lack of ankle motion, specifically APF that aids in propulsion by increasing HE and HF-M.31, 32 However, the results of the current study indicate that a lack of symmetry at the ankle does not alter the symmetry at the hip. Significant decreases in limb symmetry for discrete measures are most likely due to increased pain and a decline in physical function experienced by patients with AA.23-25 Based on the discrete analysis clinicians should target the restoration of ankle motion and improve limb loading symmetry to restore gait symmetry in this patient population.
4.2 Time-series symmetry analysis
Although discrete analysis can help inform clinical decisions, it is important to evaluate joint angular kinematics and GRF throughout the stance phase to help determine overall performance and movement patterns. Using SPM, significant regions of difference were found between populations and limbs for GRF and sagittal plane ankle kinematics. Alterations in gait between healthy participants and patients with AA illustrate that the patients with AA compensate for their arthritic limbs' loss in function and pain. This agrees with previous literature that has found differences in GRF and sagittal plane kinematics for patients with AA and a healthy population.19-21 To compensate for their arthritic limb patients with AA significantly decrease loading throughout stance and show the largest decrease in symmetry during APF. Furthermore, at the hip there were significant differences in the HE-M, which indicates that HE moment could be a measure of interest in discrete analysis when evaluating symmetry in patients with AA. However, these changes differ from our hypothesis that the most substantial changes would be during terminal stance. Furthermore, the SPM analysis found a significant difference between limbs, regardless of group, in the vertical GRF and at the ankle. To determine which group is driving these inter-limb differences, a post hoc evaluation would need to be completed.
A post hoc evaluation for SPM analysis is currently under development and has yet to be validated. Due to this limitation, a second SPM analysis was conducted to complete pairwise comparisons between the arthritic limb and unaffected limb in patients with AA. Through this analysis, differences in weight acceptance and propulsion were identified between limbs in patients with AA indicating that the difference seen in the interaction between limbs and group in the SPM analysis was in part driven by the difference between limbs in patients with AA. When evaluating ankle angle, there was a significant interaction between limb and group during terminal stance. However, patients with AA had significant differences between limbs during peak APF and ADF, thus the differences in terminal stance were driven in part by the differences between limbs for patients with AA. Furthermore, the interaction between limb and group in the APF-M also occurred when comparing the arthritic and unaffected limbs in patients with AA. When evaluating the hip, HE angle, and moment had a significant interaction between group and limb. This statical interaction was also seen when comparing between limbs for patients with AA. The time-series analysis at the hip differed from the discreate analysis that showed there was no difference in symmetry at the hip for patients with AA compared to healthy participants. Furthermore, the altered HE angle symmetry in patients with AA agreed with previous literature which indicated that the HE angle is altered differently in these patients when compared to healthy gait.31, 32 Previous literature also states that patients with AA have a greater HF-M to compensate for the decreased ankle moment.31, 32 Because of this compensation strategy an alteration to HF-M symmetry was expected due to the decreased APF-M symmetry. However, HF-M symmetry was not different between patients with AA and healthy participants. Although there was no alteration in HF-M symmetry there was a decrease in HE-M symmetry in patients with AA during the first 10% of the stance phase. These findings indicate that when planning rehabilitation strategies, clinicians should focus on improving mechanics during the weight acceptance and propulsive phases of the gait cycle. Furthermore, clinicians should focus on increasing symmetrical loading during weight acceptance and propulsion and increasing ankle plantarflexion angle and strength in the arthritic limb to generate a more symmetrical gait pattern.
This study is not without limitations. The interest of this study was to evaluate the degree of decreased limb symmetry between patients with AA and healthy participants rather than identify the gait mechanics changes that are driving the lack of symmetry. This study only considered sagittal plane mechanics and did not evaluate frontal or transverse plane mechanics, which could play an important role in decreased physical performance in patients with AA.19 In addition, this study did not evaluate disease progression nor rehabilitation or surgical treatments for patients with AA. Furthermore, a post hoc evaluation would be needed to explain the group driving the differences found between limbs but is under development for SPM analysis. Future studies should build off this work and address these limitations.
The current study provides information on the degree of decreased symmetry for discrete and continuous gait kinetic and kinematic parameters between patients with AA and a healthy population, previously lacking in the literature. Decreased symmetry in patients with AA could be a compensation strategy for pain and discomfort experienced by patients with AA during walking. Moreover, a lack of limb symmetry is associated with decreased physical performance26-28 and increased energy expenditure.18 Thus, measurable alterations from healthy gait symmetry could help explain the decreased physical performance and deficiency in daily function that have been previously reported in patients with AA.26-28 Due to decreased limb symmetry in patients with AA, rehabilitation goals that directly target maintaining healthy levels of limb symmetry could lead to improvements in physical performance and patient reported outcomes in patients with unilateral AA. Future work should compare measures of physical performance and limb symmetry in patients with AA and patients with AA undergoing rehabilitation for AA.
5 CONCLUSION
Patients with AA had decreased discrete and time-series symmetry in the vertical GRF during weight acceptance and propulsion, ankle plantarflexion, dorsiflexion, plantarflexion moment, and HE angle and moment when directly compared to an age, gender, and BMI matched healthy population. The arthritic limb of patients with AA had decreased loading, ankle, and hip angles compared to the unaffected limb. The decreased symmetry is likely the result of pain in the arthritic limb of patients with AA and could explain the decreased physical performance seen in the population with AA. Given the differences in symmetry between groups and the potential for increased joint damage in other lower extremity joints it is important to assess the impact of therapeutic interventions to improve gait symmetry in patients with AA and to ensure that any gait assessment examines the impact of pathology on all lower extremity joints.
AUTHOR CONTRIBUTIONS
Robin Queen: Study idea generation, study design, initial data collection on patients with unilateral ankle arthritis, analysis and interpretation of data, and manuscript revision. Nicole E.-P. Stark: Acquisition and processing of healthy participant data, analysis, and interpretation of data, drafting and revising the manuscript for submission. Jill Streamer: Processing AA data, analyzing and interpreting data, drafting and revising the manuscript for submission. All authors have read and approved the final version of the submitted manuscript.
ACKNOWLEDGMENTS
Support for Nicole E.-P. Stark's work on this study was supported by the National Institute of Arthritis and Musculoskeletal and Skin Diseases grant number [3R21AR074149-01A1W1].
CONFLICT OF INTEREST STATEMENT
The authors declare no conflict of interest.


