Is load control necessary to produce physiological AP displacement and axial rotation in wear testing of TAR?
Abstract
The International Standard Organization, ISO 22622, specifies two options for joint wear simulator evaluation of total ankle replacements (TARs): load-controlled and displacement-controlled. In the present study, the load-controlled testing parameters were applied to cadaveric specimens to quantify and compare the observed sagittal translations and axial rotations to those specified under the displacement-controlled option. Twelve cadaveric specimens were stripped of extraneous tissues, keeping surrounding ankle ligaments. A halo was used to produce plantarflexion and dorsiflexion of the talus through two screws, while a baseplate resisted axial loads. The axial force and torque were applied to the tibia and fibula under force and torque feedback control. An anterior–posterior force was applied to the tibia. Plantarflexion-dorsiflexion were applied using rotation control. To protect the cadaveric specimens, loads were applied at 50% of the specified load profile while plantarflexion–dorsiflexion rotation was applied as specified. There was variation among specimens in magnitudes of anterior–posterior displacement with peaks ranging from 3.3 mm posteriorly to 3.0 mm anteriorly. Likewise, there was variation among specimens in magnitude of axial rotation, with peaks ranging from 11° external rotation to 4.5° internal rotation. However, the mean magnitudes of AP displacement and axial rotation did not exceed those specified by ISO 22622.
1 INTRODUCTION
Over the past few decades, total joint arthroplasty has revolutionized treatment of end-stage arthritis. While highly successful in hip and knee joints, only short-term outcome has been successful in ankle joints, with 90% survival at 5 years dropping to 65% at mid-term to long-term survival.1-5 Evaluation of wear using in vitro joint simulators has been established as necessary preclinical testing to predict the in vivo clinical performance of total joint replacements. In turn, a thorough understanding of the kinematics of the joint is a prerequisite to design a physiologically accurate joint simulator wear test.
In total hip arthroplasty, studies of polyethylene wear of acetabular components have found that the type of motion between articulating surfaces has a substantial effect on the magnitude and type of wear and damage. Specifically, higher degrees of crossing path motion lead to higher magnitudes of polyethylene wear in metal on polyethylene bearing surfaces.6, 7 In the same manner, for total ankle replacements (TARs), it is important to evaluate polyethylene wear by producing physiologically accurate relative motions between the tibial and talar components. Typically, total ankle replacement wear simulators have controlled axial loading, plantarflexion and dorsiflexion, anterior and posterior (AP) displacement, and axial rotation. As wear simulators for total ankle replacements are not widely available, investigators have used total knee replacement (TKR) wear simulators for studying total ankle replacement wear since the degrees of freedom are analogous for axial load, flexion extension, AP displacement, and axial rotation.8
Traditionally, for wear evaluation of both TKRs and TARs, AP displacement has been applied under displacement control and axial rotation has been applied under rotation control (angular rotation). However, in few studies, an AP force profile has been applied, allowing the components to translate based on the constraints of the implant as well as simulated physiological constraints. At the same time, an axial torque profile has been applied, allowing the components to rotate based on the constraints of the implant and simulated physiological constraints.9, 10
Recently, an ISO standard for TAR wear evaluation was published (ISO 22622).11 This standard is similar to ISO 14243-312 for TKR wear evaluation in that both standards allow a displacement-controlled method or, alternatively, a force-controlled method. Both methods specify the same force profile for axial load to be applied to the tibial component, and an angular rotation profile for flexion-extension (dorsiflexion–plantarflexion) to be applied to the talar component. However, the displacement-controlled method specifies a displacement profile for AP displacement, and angular rotation profiles for internal–external rotation. In contrast, the force-controlled method specifies a force profile for anterior–posterior loads and a torque profile for internal–external torque.
In TKRs, a study by Sutton et al. suggested substantial differences in the magnitude of AP displacement and axial rotation between displacement control and load control protocols. Specifically, they applied the ISO load control protocol to cadaveric knees with collateral and cruciate ligaments intact and reported tibial internal–external rotations more than three times larger than the prescribed displacement-controlled rotations. Additionally, the resulting AP translations produced an inverse waveform from the prescribed ISO AP displacement profile.13
In contrast, for TARs, a lack of validation studies makes it unclear whether the load control parameters specified by ISO 22622 are necessary. The purpose of the present study was to apply the ISO 22622 load control parameters to cadaveric ankles with intact ligaments and to compare the observed motions at the tibiotalar joint to motions specified by the same ISO standard under the displacement-controlled option.
2 METHODS
2.1 Specimen preparation
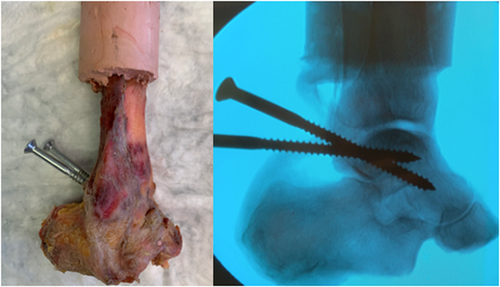
Six pairs of fresh-frozen cadaveric lower limbs cut midshaft of the shank were obtained from a licensed willed body tissue institute, Science Care (Science Care, Phoenix, AZ). Specimen donors were equally half female and half male, with ages ranging from 30 to 93. All specimens were screened for any pre-existing conditions, including relevant orthopaedic conditions. The specimens had all extraneous fat and tissues removed, while keeping all ligaments around the ankle complex intact. Care was taken to minimize the disruption to the interosseus ligament between the retained tibia and fibula. The Achilles tendon was removed to allow direct access to the talus. Additionally, the hard and soft tissues distal to the navicular were removed, leaving only the tibia, fibula, talus, calcaneus, navicular, and their surrounding connective ligaments. A single 5 cm long, 4 mm diameter screw was used to fix the proximal end of the fibula to the tibia to protect the interosseus ligament. Two 80 mm long, 7 mm diameter screws were placed through the talus from the posterior surface, passing the neck into the head without piercing through the anterior surface. These screws extended beyond the level of the most posterior edge of the calcaneus. To ensure proper screw placement, fluoroscopy was used to guide the angle of approach along with the depth of insertion (Figure 1).
2.2 Potting
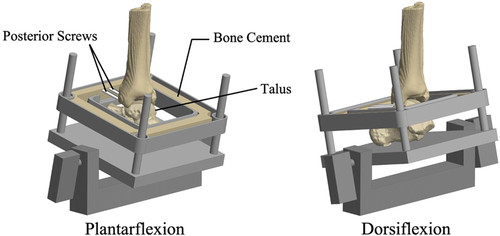
The proximal ends of the tibia and fibula were then potted in low-temperature bonding resin (Bondo 3M). Bone cement was poured into a square-shaped brace which surrounded the entire specimen and captured the heads of the posterior screws that were previously inserted into the talus. This created a “halo” of bone cement which allowed for control of the talus position using the posterior end of the screws (Figure 2). The neutral position was determined using an alignment similar to the method described by Leardini et al.14 Radiographs were taken to confirm the neutral alignment before the creation of the halo.
2.3 Apparatus design
With the halo attached, each specimen was loaded using a custom apparatus mounted into an 8-DOF load frame (858 Bionix, MTS Systems). The proximal end of the specimen, potted into cement, was rigidly attached to the axial-torsional actuator on the superior aspect of the load frame. The distal end of the specimen (calcaneus) rested on a baseplate, 3D printed from tough PLA filament (Tough PLA 202300, Ultimaker). The halo was mounted into a tray which was in turn attached to the baseplate using four hardened steel bars which allowed free vertical translation of the halo relative to the baseplate, while restricting rotation and horizontal translations. On each bar two round flange linear ball bearings (Model 6483K52; McMaster-Carr) ensured low-friction gliding of the tray parallel to the baseplate. The halo was thus used to produce plantarflexion and dorsiflexion of the talus through the screws, while the baseplate resisted axial loads. To allow plantarflexion and dorsiflexion to occur at the natural axis of rotation of the talus, the baseplate and its attachments were allowed free AP translation by a low-friction linear bearing mounted on the inferior base of the load frame (Figure 3).
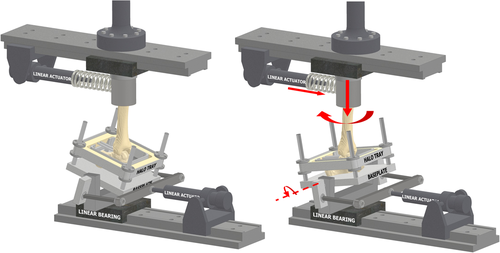
The axial force and axial torque were applied to the proximal end of the tibia and fibula under force and torque feedback control respectively. Following the ISO 22622 standard, an AP force was applied to the tibia; specifically, the force was applied to the proximal end of the specimen using a linear actuator and spring. All other degrees of freedom of the tibia were restricted (mediolateral translation and rotation in the coronal and sagittal planes). Plantarflexion and dorsiflexion were effectively applied using rotation control (in degrees), as specified by ISO 22622, using a linear actuator mounted to the fixed distal linear rail. The baseplate resisted axial loads applied to the tibia through the talus and calcaneus, however it allowed free sliding of the calcaneus in the horizontal plane.
2.4 Loading conditions
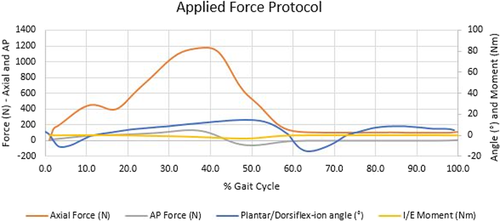
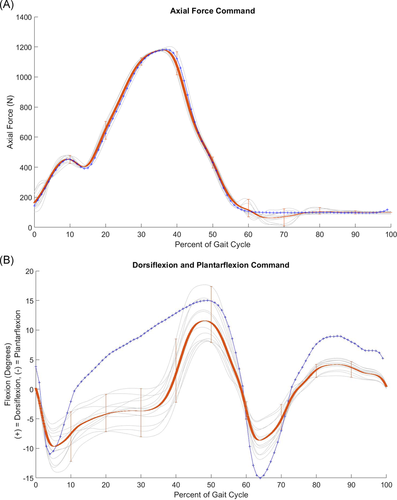
Due to the physical limitations of cadavers and to prevent soft tissue damage, the axial force, AP force, and tibial torque magnitudes were reduced to 50% of the respective load profile specified by ISO 22622. These were all implemented at a frequency of 1 Hz ± 0.1 Hz. This method of loading was based on previous biomechanical studies of cadaveric tibiotalar joints that have applied reduced loads below full body weight to preserve the integrity of the joint.15 A summary of all of the forces applied in the present study is shown in Figure 4.
2.5 Data acquisition
An Optotrack Certus motion tracking system (Northern Digital, Inc.) was used to record the motions of the tibia, talus, and calcaneus. The motion capture system has an accuracy of 0.1 mm and a resolution of 0.01 mm using motion flags, equipped with 3 noncollinear light-emitting diode (LED) markers that pulse at 3000 Hz. A minimum of 3 LED markers are required to obtain rotations (Rx, Ry, Rz) along with translations (x, y, z), while a minimum of 1 marker is needed for pure translations. These motion flags were attached via bone screws to flag holders placed in the talus, tibia, and calcaneus. An additional flag was mounted on the load frame to establish a fixed local coordinate axis and to minimize the effects of any vibrations of the hydraulic machine.
An ATI 6 DOF load cell (Mini 58; ATI Industrial Automation) was used to capture all force data, including axial force, AP force, and axial torque. The motion tracking system was used to capture all translations and rotations. All the measured forces recorded were plotted and analyzed against the applied command signals. Similarly, since the dorsiflexion or plantarflexion was not directly controlled, it was also important to check the measured applied angular displacement. The resulting AP displacement from the applied loads was compared to those specified in the ISO displacement control standard. Similarly, the resulting tibial rotations from the applied axial torque was compared to those specified in the ISO displacement standard.
3 RESULTS
3.1 Divergence of actual loads and motions from applied command profiles
The actual applied loads and motions were compared to the respective programmed load or motion profile based on ISO 22622.
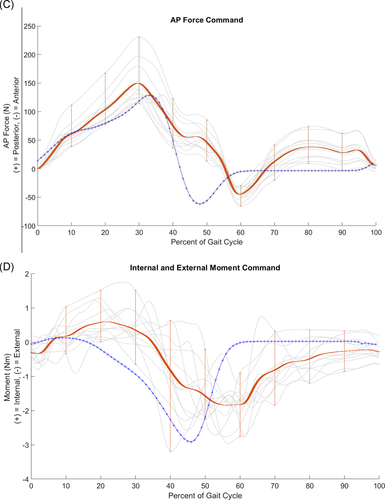
Under axial load, the specimens responded to the load command profile without substantial deviation and without structural failure (Figure 5A). Specifically, the specimens reached the peak load at 38% of the gait cycle, consistent with the axial load command profile. In contrast, the specimens did not follow the dorsiflexion–plantarflexion command profile closely. Specifically, while the dorsiflexion command increased steadily between 10% to 50% of the gait cycle, the actual dorsiflexion of the specimens increased later, after 30% of the gait cycle (Figure 5B). Similarly, the specimens responded to the AP load command profile with some deviation. Specifically, the specimens peaked slightly earlier than the command profile in posterior force and slightly later in anterior force (Figure 5C). Finally, the specimens responded to the axial torque command profile with some deviation. Specifically, the specimens demonstrated somewhat of a phase delay with respect to the command profile (Figure 5D).
3.2 Observed outcome: Motions of the talus
A wide range of AP displacement of the talus was observed among the specimens. While on average the displacements were within approximately a millimeter of the specified ISO profile, the peaks and valleys were as much as 2 mm apart among the specimens: the talus moved from 3.3 mm posteriorly to 3.0 mm anteriorly (Figure 6A).
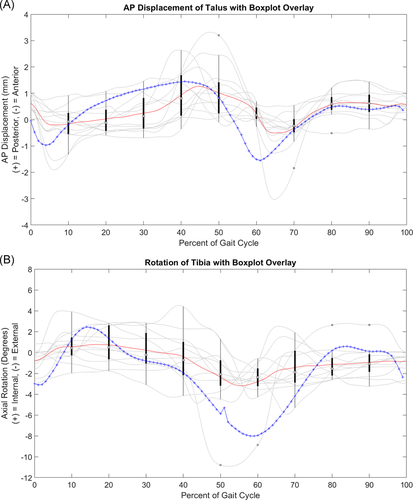
A wide range of axial rotation of the talus was also observed among the specimens. On average, the peaks and valleys of the rotation were lower in magnitude than those specified by the ISO profile (Figure 6B). However, the peaks and valleys of some of the individual speimens exceeded the ISO profile. Overall, among the specimens, the observed rotations ranged from 11° of external rotation to 4.5° of internal rotation.
4 DISCUSSION
Few studies have been conducted to evaluate the wear of TARs using joint simulators. Among these studies, a wide range of methods have been used. In particular, there is no consensus on the appropriate magnitude of AP displacement or axial rotation of the talus.8 Moreover, only two studies validated the results by comparing the simulator-worn implants to retrieved TARs.16, 17 Despite the lack of consensus, the International Standard Organization has recently finalized a standard (ISO 22622), specifying displacement and loading parameters for wear-testing of TARs.11
ISO 22622 provides two options for wear tests: displacement control and load control.11 The intention of the load control test is to allow the specimen to traverse through AP displacement and axial rotation in response to the applied AP force and axial torque, respectively. However, the load control option requires implementation of a constraint system to mimic ligament restraints, since the implant alone does not provide sufficient resistance to horizontal forces. Proponents of load control wear testing have argued that relative motions of implant components occur more physiologically under load control and resulting contact stresses between the components may also be affected.
4.1 Observed AP displacement under load control versus ISO 22622 AP displacement
We compared the observed motions of the ankle that resulted from applying the load control option in ISO 22622 to the AP displacement and axial rotation profiles specified by the displacement control option. At 50% of the specified loads, the observed AP displacement curve of the talus was similar to the published ISO AP displacement profile. Moreover, the resulting displacement magnitudes did not exceed the AP displacements specified in the ISO 22622 standard. The resulting curve followed the expected physiological movements and was consistent with a typical gait cycle. Specifically, at the initiation of the gait cycle, when heel-strike occurred (0%–10%), the ankle was plantarflexed which created the measured anterior (negative) displacement. Subsequently, during 10%–45%, the ankle transitioned from maximum weight acceptance to push-off which was correlated with high dorsiflexion. This dorsiflexion was represented by a posterior (positive) translation which was also observed. Following this section, the ankle moved into heel-off and the pre-swing phase which was characterized by ankle plantarflexion. This would suggest anterior (negative) translation, which is the behavior that was observed.
4.2 Observed IE rotation under torque control versus ISO 22622 IE rotation
The resulting internal and external (IE) rotations varied widely among the specimens. However, the trend of the mean rotations was similar to the specified rotations in ISO 22622. An internal moment was expected to create a positive rotation which was consistent with both the motion tracking data collected from the specimens and with the internal rotation ISO command. Similarly, as the gait cycle progressed, an external moment was applied and was expected to result in a negative rotation of the tibia. Both the specimen recorded data and the ISO rotation protocol agreed on these rotations. Moreover, from the applied torque profile, the tibia did not exceed the rotations suggested in the ISO 22622 internal–external rotation angles.
This data may suggest that for AP displacement and tibial rotations, load or displacement control may effectively produce the same kinematics. Conversely, Sutton et al.13 reported that for cadaveric knees, force control may be more suitable due to the high reliance on ligament stability for the knee. Interestingly, the ankle is unique in that it is stabilized by both ligaments and articulating bone surfaces.18, 19 At low loads, displacements may be small and well within the viscoelastic range of the ligaments providing stabilization. However, at high loads, the ankle effectively becomes a rigid lever relying on its articulating bone structure for stability. This may provide an explanation on why higher loads and torques do not necessarily produce higher displacements in the ankle, as seen in knees. While force control produced physiologically correct displacement trends, the benefits of force control may not outweigh the complexity of conducting the experiment using the ISO load control option for TARs.
4.3 Limitations
The present study had several limitations. First, due to the limitations of structural strength of cadaveric ankles, the applied force profile command was 50% of the magnitudes specified by ISO 22622. However, the plantarflexion–dorsiflexion was applied under rotation control as specified by ISO 22622. Further research must be conducted to investigate if testing at the full 100% will change the observed AP and axial rotational displacements. While the cadaver specimens successfully underwent the axial load profile at 50% of the magnitudes specified by ISO, these specimens did not precisely follow the dorsiflexion-plantarflexion rotation profile, AP load profile, and IE torque profile; this was perhaps due to ligament constraints and various joint impingements. For example, at lower loads, ankle stability may be dependent on ligaments; however, at higher loads, the articular geometry may be the primary stabilizer.19, 20 Specifically, at these higher loads that occur from mid-stance to push-off, the bones are locked into a forced position to create a rigid lever of support to propel the subject forward.18 Therefore, under the sharp increase in axial load from 20% to 30% of gait that coincides with the highest peak of AP load, the specimen may have been relying on the tibiotalar joint for stabilization. The differences in AP loads can be attributed to the variance in specimen flexibility. Another limitation was the AP force applied to the tibia was not feedback controlled; therefore, the load observed was reliant on the stiffness of the specimen and its resistance to the force produced by the displacement-controlled actuator and spring mechanism. Finally, without the cuneiform and metatarsals, the specimens may have been biomechanically compromised, altering the response.
5 CONCLUSIONS
In conclusion, the results of the present study indicated that load control to produce AP displacement and axial rotations does not produce substantially different magnitudes of displacements than those specified by ISO 22622 using the displacement-controlled option. Since joint wear simulators previously used for TAR wear evaluation have operated under displacement control for AP motion and axial rotations, the additional expenses and difficulties associated with the implementation of load control for TAR wear testing may not be justified. Moreover, the implementation of load control for these motions, while arguably more physiologically accurate, may introduce uncertainties in the resulting motions which may lead to lack of reproducibility when comparing results for different designs or from different investigators.
5.1 Statement of clinical significance
Wear testing under load control has been advocated to produce physiological AP displacements and axial rotations for TAR. However, in the present study load control of cadaveric ankles did not produce substantially different AP displacements and axial rotations than those specified for displacement control in ISO 22622.
ACKNOWLEDGMENTS
All funding for this study was provided by The J. Vernon Luck, Sr., M.D. Orthopaedic Research Center at the Orthopaedic Institute for Children, UCLA. No authors have professional or financial affiliations that may be perceived to have biased this study.
AUTHOR CONTRIBUTIONS
Nathan C. Ho, Colin P. McCarty, and Sang-Hyun Park: substantial contributions to research design, acquisition and analysis of data; drafting and revision of the paper; approval of the submitted and final versions; Neda F. Gilmartin, Edward Ebramzadeh, and Sophia N. Sangiorgio: drafting and revision of the paper; approval of the submitted and final versions; Joan R. Williams: approval of the submitted and final versions. All authors have read and approved the final submitted manuscript.


