T2 analysis of the entire osteoarthritis initiative dataset
Abstract
While substantial work has been done to understand the relationships between cartilage T2 relaxation times and osteoarthritis (OA), diagnostic and prognostic abilities of T2 on a large population yet need to be established. Using 3921 manually annotated 2D multi-slice multi-echo spin-echo magnetic resonance imaging volume, a segmentation model for automatic knee cartilage segmentation was built and evaluated. The optimized model was then used to calculate T2 values on the entire osteoarthritis initiative (OAI) dataset composed of longitudinal acquisitions of 4796 unique patients, 25 729 magnetic resonance imaging studies in total. Cross-sectional relationships between T2 values, OA risk factors, radiographic OA, and pain were analyzed in the entire OAI dataset. The performance of T2 values in predicting the future incidence of radiographic OA as well as total knee replacement (TKR) were also explored. Automatic T2 values were comparable with manual ones. Significant associations between T2 relaxation times and demographic and clinical variables were found. Subjects in the highest 25% quartile of tibio-femoral T2 values had a five times higher risk of radiographic OA incidence 2 years later. Elevation of medial femur T2 values was significantly associated with TKR after 5 years (coeff = 0.10; P = .036; CI = [0.01,0.20]). Our investigation reinforces the predictive value of T2 for future incidence OA and TKR. The inclusion of T2 averages from the automatic segmentation model improved several evaluation metrics when compared to only using demographic and clinical variables.
1 INTRODUCTION
Osteoarthritis (OA), a multifactorial disease that causes joint degeneration, affects 27 million U.S. adults1, 2 and often leads to severe disability.3 The typical treatment for late-stage, symptomatic knee OA is joint replacement, such as total knee replacement (TKR). This surgically invasive remedy offers temporary relief, but replacements often fail after 10 to 15 years—with even shorter life spans in obese individuals. Current interventions for OA mostly target the late stages of the disease, often after the irreversible joint damage has already occurred. Proposed interventions and therapies are generally reactive rather than proactive. The development of proactive therapies is contingent upon detecting the early stages of OA. Preventative strategies such as weight reduction4, 5 and various levels of exercise6, 7 decrease OA progression, and should be rigorously enforced if individual assessment demonstrates a high long-term risk for OA.
The initial stages of cartilage degeneration occur on a cellular level and include proteoglycan loss, increased water content, and disorganization of the collagen network. These early changes to the extracellular matrix eventually lead to irreversible, late-stage, morphologic degeneration such as cartilage defects, cartilage loss, and joint space narrowing. Accurate detection of early degenerative changes will hopefully spur better OA interventions and prevention.
Magnetic resonance imaging (MRI) is useful for visualizing joint tissues; cartilage damage and meniscal tears, as assessed with MRI, are associated with incident radiographic knee OA 2 to 4 years later.8 These morphological findings are examples of irreversible joint damage, unfortunately. To target the initial stages of disease development, T2 mapping measures early degenerative changes in knee cartilage that occur prior to macroscopic cartilage defects and thinning. A substantial number of studies explore the relationships between T2 relaxation times and OA. T2 values are associated with biochemical changes in the cartilage matrix including abnormalities of collagen fiber orientation.9
Cartilage T2 quantification is not routinely used in clinical practice, where radiography remains the gold standard for diagnosing OA. A major challenge for clinical translation is the time-consuming manual or semi-automatic cartilage segmentation process required for T2 analysis. With no well-established, fully automatic segmentation, datasets are relatively small. Consequently, there is limited information on relationships between T2 values and OA risk factors (such as age and body mass index) in larger populations. Moreover, there is a pressing need to establish the real prognostic ability of such techniques, as associations with incidence OA and TKR were only investigated in smaller samples.10-12
In this study, we aim to fill both these gaps by analyzing knee OA and T2 in a large study population. We developed automated methods and performed a comprehensive analysis of T2 values for all 25 729 MRI exams in the entire osteoarthritis initiative (OAI) dataset to support the observations seen in much smaller samples.
2 METHODS
2.1 Study Population and Imaging
Data for this study were obtained from the OAI public use datasets, which are available at https://oai.nih.gov/. OAI is a multi-center, longitudinal, prospective observational study of knee OA. The study recruited 4796 men and women aged 45 to 79 years; they were enrolled between February 2004 and May 2006 and followed up regularly for 96 months. All OAI study protocol, amendments, and informed consent documentation were reviewed and approved by the local institutional review boards of all participating centers.
We analyzed MRI scans and clinical data from all 4,796 participants at all imaging visit time points (baseline, 12, 24, 36, 48, 72, and 96-months). Participants were imaged on four matching 3.0T Siemens Trio MR systems (Siemens Medical Solutions, Erlangen, Germany). The knee MRI T2 mapping sequence was a sagittal 2D multi-slice multi-echo (MSME) spin-echo sequence with 2700 ms TR, 10/20/30/40/50/60/70 ms TEs, 0.313 × 0.446 mm in-plane spatial resolution, 3.0 mm slice thickness, slice gap of 0.48 mm, and pixel spacing of 0.3125 × 0.3125 mm.
2.2 Automatic T2 quantification using deep learning
A total of 3921 MRI studies (1890 unique subjects) were segmented manually in the course of several studies performed between 2011 and 2018. The funding was obtained through three main NIH projects: U01AR059507, P50AR060752, and R01AR064771. All the users that performed manual segmentation went through the same training. The manual segmentation and T2 values computed from these segmentations were previously quality-controlled and used in published studies. Five cartilage compartments were segmented: the lateral femur (LF), lateral tibia (LT), medial femur (MF), medial tibia (MT), and patella (PAT).
This dataset (N = 3921) was randomly split to training, validation, and test set (65:25:10). Considering that there were multiple visits per patient ID, the split was done in a way that each patient was either present in the test or training/validation splits. The test dataset was never used during the training and model selection process.
Furthermore, to ensure the homogeneity of the training, validation, and test splits, we performed hypotheses tests on the dataset splits for different factors. The proportions of male vs female subjects and the proportions of subjects with different KL grades were evaluated using a Cochran proportion test. Average age and BMI were evaluated using a one-way analysis of variance. Among the four tests, the only average age was significantly different among the splits. Table 1 reports details on the data splits and demographic and clinical factors splits.
| Train (N = 2549) | Validation (N = 784) | Test (N = 588) | P-value | |
|---|---|---|---|---|
| Sex (count) | .32 | |||
| Male | 1159 | 378 | 260 | … |
| Female | 1390 | 406 | 328 | … |
| KL grade (count) | .40 | |||
| 0 | 894 | 286 | 181 | … |
| 1 | 469 | 139 | 100 | … |
| 2 | 600 | 193 | 163 | … |
| 3 | 366 | 105 | 102 | … |
| 4 | 34 | 11 | 4 | … |
| Age (average ± std) | 62.06±8.77 | 62.12±8.76 | 65.11±9.33 | <.001 |
| BMI (average ± std) | 28.80±4.56 | 28.55±4.51 | 28.95±4.39 | .25 |
- Note: P-values are adjusted for multiple comparisons. Bold values show there is no significant difference between the groups.
- Abbreviations: BMI, basal metabolic index; KL, Kellgren and Lawrence; L F, lateral femur; LT, lateral tibia; MF, medial femur; MT, medial tibia; PAT, patella.
3D V-Net architecture13 was used to solve the segmentation problem. As suggested in13 the Sørensen–Dice coefficient (F1 score) was used as the main loss function to tackle five cartilage compartments (LT, LF, MT, MF, and PAT) semantic classification problem. The loss function used for training was a linear combination of cross-entropy loss and mean Dice values over different classes. Adam optimizer was used which takes advantage of adaptive learning rates for different parameters from estimates of first and second moments of the gradients.14 The initial learning rate was set to 0.001. To stabilize the training process, we set the epsilon parameter of the optimizer to 0.001. In order to standardize the MRI volume slices, each volume was zero-padded to the largest volume (38 slices). After this preprocessing step, each volume had a shape of 384 × 384 × 38. For each MRI exam, only the first echo was used for both training and testing. Data augmentation was performed during the training with random in-plane rotation (±5°) and medial to lateral flipping of the images. A mini-batch size of four was used at each training iteration, due to GPU hardware limitations. Evaluation metrics were computed using the whole validation set after each training epoch. The training was terminated after no improvements in the loss value were observed—at 33 epochs. Training and testing were performed using one Tesla V100 GPU, a x86_64, Linux Redhat operating system, Tensorflow library version 1.12.0.
Model performance evaluation was measured using the Dice coefficient score (DSC). Automatically segmented cartilage compartments with low voxel counts were discarded, however; a voxel count threshold was set at the 99 percentile of the training dataset voxel counts. This resulted in 23, 1, 0, 0, 1 discarded segmentations for PAT, LT, MT, MF, LF, respectively.
T2 relaxation times were then calculated for each segmented voxel by fitting an exponential curve to the multi-echo signals. We excluded the first echo as suggested in.15 Average T2 values for each compartment were then computed. The curve fitting was performed using a scientific computing package, Scipy 1.2.1. We calculated T2 relaxation times on the entire OAI dataset on a cluster grid of 200 Intel(R) Xeon(R) 2.10 GHz CPU E5-2683 v4 cores.
We compared the average T2 values calculated from manual vs automatic methods in the test set and examined them using violin plots and t test. We also used Bland-Altman plots to compare the T2 values with different data stratifications in sex BMI, Knee Injury and Osteoarthritis Outcome Score (KOOS) pain, and KL grade.
2.3 Statistical analysis
We assessed the entire dataset for cross-sectional relationships between T2 values and age, sex, BMI, KOOS pain score,16 and Kellgren and Lawrence (KL) grades.17 Subjects with missing radiographic KL readings or demographics were removed from analysis—the final number of data points was 24 639. Five separate mixed-effect regression models (eg, one model per segmentation compartment), were built with T2 values as the outcome variable and all variables age, BMI, and sex as explanatory variables. The results were adjusted for race, a potentially important confounder.18 Similarly, we built mixed-effects regression models to relate the T2 measurements per compartment to KL grades and KOOS pain scores. Due to the repetitions of subjects in this longitudinal study, we added the random effect of the subject ID to the model. T2 values are used as predictors of clinical features of KOOS pain score (continuous) and KL grade (binary model with KL 0 or 1, and KL >1).
We also examined the relationship between T2 and future incidence of radiographic OA. We compared knees with fast progression (KL = 0 or 1 progressing to KL > 1 after 2 years) and slow progression (KL = 0 or 1 progressing to KL > 1 after 4 years), to control subjects who never developed OA during the study (KL = 0 or 1 at all visits). We used logistic regression models to assess average T2 measurements per cartilage compartment and incidence of (fast and slow progression) knee OA. To calculate the odds ratios and to better understand the effect of higher T2 values, the T2 average was mapped to categorical variable quartiles.19 The models are adjusted for age, sex, BMI, and race as possible confounders. More specifically, the data breakdown includes controls (N = 2108, age = 59.71  9.22, sex M:F = 945: 1163, BMI = 27.25
  4.43), 2-year incident group (N = 232, age = 63.361
  8.66, sex M:F = 80: 152, BMI = 29.25
  4.61), 4-year incident group (N = 150, age =62.82
  8.65, sex M:F = 55: 95, BMI = 28.92
  4.81).
To examine the usefulness of average T2 values which are obtained from the automatic segmentation model when used in predictive modeling of OA incidence, we built two models designed to handle imbalanced datasets like the one we are using. To have a better ground for comparison, 10-fold cross-validation was used to obtain the performance metrics for a cost-sensitive (balanced loss function) for support vector machine (SVM) with linear kernel, as well as a balanced bagging ensemble of decision trees (Python imblearn package version 0.6.2 has been used for this analysis). For the 4 years incidence prediction, SVM with RBF kernel is used due to better prediction performance. The metrics used for evaluation of the classification problem are sensitivity, specificity, positive predictive value (PPV), negative predictive value (NPV), and area under the curve (AUC) as suggested in.20 The goal of this analysis is to observe whether adding the T2 average values (five variables) will improve a base model that is trained with only demographic and clinical variables (age, sex, BMI, and KOOS) which are previously known to be predictors of incidence OA. For each problem, 2 and 4 years incidence prediction, both of the models, base, and added T2 are trained and evaluated with the same 10 fold splits.
Lastly, we studied the association of T2 with the incidence of TKR within 5 years. TKR cases were pairwise matched to controls with a 1:1 ratio on age (±5 years), BMI (±3 units), sex, and KL grading. Eligible controls were not allowed to match with cases more than once. Logistic regression was used to study the association of T2 values and TKR. We also calculated the Variance Inflation Factor (VIF) to identify possible collinearity among the predictors. The data break-down includes controls (N = 168, age = 64.24  7.51, sex M:F = 67: 101, BMI = 29.9
 4.65), 5-year TKR group (N = 168, age = 64.64
  7.42, sex M:F = 67: 101, BMI = 30.0
 4.71).
The effectiveness of T2 averages obtained from the segmentation model for TKR prediction was evaluated by building two models, one trained with age, sex, BMI, and KOOS, and retrained with added T2 values to the predictors. The dataset used for this experiment is the same matched dataset described previously. SVM classifier with the linear kernel is used as the predictive model and stratified 10-fold cross-validation is used for training and validation. The evaluation metrics were the same as the ones used for incidence prediction models (sensitivity, specificity, PPV, NPV, and AUC).
All of the statistical analyses were completed using R environment (version 3.4.0).
3 RESULTS
3.1 Technique development
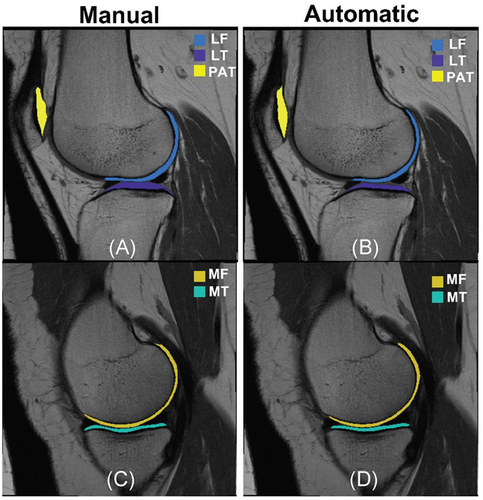
The segmentation model DSC by cartilage compartment (avg±std) was: LT: 0.75 ± 0.11, LF:0.69 ± 0.13, MT:0.68 ± 0.12, MF:0.69 ± 0.11, PAT: 0.57 ± 0.17. Figure 1 shows an example comparing manual and automatic cartilage segmentation.
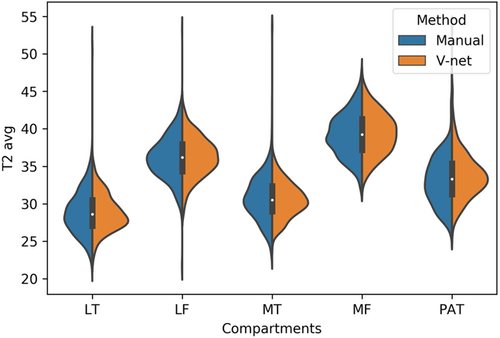
The calculated T2 averages by compartment (avg  std) are: LT: 28.90
  2.96, LF: 36.15 ± 2.98, MT: 30.79 ± 3.03 MF: 39.22
  2.88, PAT: 33.14
  3.35 for manual segmentation and LT: 28.88 ± 2.55, LF: 36.24
  2.64, MT: 30.59 ± 2.45, MF: 39.36 ± 2.78, PAT: 33.76
  3.11 for automatic segmentation. Figure 2 provides a visual representation using violin plots, and Figure 3 shows subgroup comparisons.
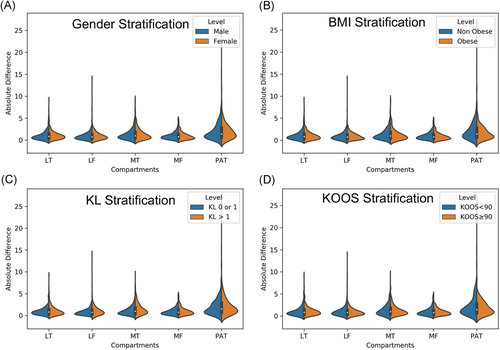
The aim of this secondary analysis was to evaluate the sensitivity of the performance of our automatic T2 quantification method to different demographics and clinical factors. While our primary performance evaluations show comparable results between manual and automatic, it is important to explore possible pitfalls of the model in specific situations. Absolute differences between manual and automatic methods were computed for subgroups of the population and were compared with a paired t test. Table 2 reports average differences in the subpopulations considered for all the five compartments and corresponding t test P-value.
| Factor/comparison | LT | LF | MT | MF | PAT |
|---|---|---|---|---|---|
Obese diff (avg  std) std) |
1.06 ± 0.97 | 0.91 ± 0.73 | 1.25 ± 1.33 | 0.95 ± 0.87 | 1.79 ± 2.15 |
Nonobese (avg  std) std) |
1.09 ± 1.10 | 1.00 ± 1.24 | 1.4 ± 1.26 | 0.98 ± 0.84 | 2.16 ± 2.33 |
| Test P-value | .92 | .92 | .25 | .76 | .35 |
Female diff (avg std) std) |
1.10 ± 1.02 | 1.02 ± 1.18 | 1.38 ± 1.32 | 0.98 ± 0.90 | 2.11 ± 2.32 |
Male diff (avg std) std) |
1.05 ± 1.10 | 0.91 ± 0.92 | 1.29 ± 1.26 | 0.95 ± 0.79 | 1.93 ± 1.86 |
| Test P-value | .43 | .62 | .77 | .77 | .65 |
High KOOS diff (avg std) std) |
1.09 ± 0.96 | 0.92 ± 1.02 | 1.25 ± 1.13 | 0.91 ± 0.74 | 1.93 ± 2.12 |
Low KOOS diff (avg std) std) |
1.07 ± 1.20 | 1.04 ± 1.16 | 1.45 ± 1.47 | 0.99 ± 0.95 | 2.14 ± 2.16 |
| Test P-value | 0.48 | 0.95 | 0.86 | 0.98 | 0.95 |
KL > 1 diff (avg std) std) |
1.10 ± 1.11 | 1.13 ± 1.38 | 1.56 ± 1.43 | 1.008 ± 0.91 | 2.256 ± 2.70 |
KL0-1 diff (avg std) std) |
1.00 ± 0.91 | 0.81 ± 0.68 | 1.08 ± 0.97 | 0.91 ± 0.78 | 2.02 ± 1.92 |
| Test P-value | .88 | .04 | <.001 | .81 | .88 |
- Note: P-values are corrected for multiple comparison.
- Abbreviations: KOOS, Knee Injury and Osteoarthritis Outcome Score; KL, Kellgren and Lawrence; LF, lateral femur; LT, lateral tibia; MF, medial femur; MT, medial tibia; OA, osteoarthritis; PAT, patella.
No significant differences in performances were observed between obese subjects (BMI > 30) and normal weight, or gender differences. Both of those demographics are well-known OA risk factors and it is important to show no biases in algorithm behavior. No significant differences were observed in the performance of the model when applied to subjects with and without pain. While the two distributions were substantially overlapped as shown in Figure 3C the only significant worsening of performances was observed in the medial compartments in subjects with radiographic OA comparing with controls. The significant thinning of the cartilage specifically located in this area is probably the cause of a higher uncertainty in both manual and automatic process which translate in a worsening of performances. Figure 4 shows the correlation and Bland-Altman plots of errors of automatic segmentation in terms of T2 average calculation. Strong correlations and no biases were observed between manual and automatic methods. Intervariability or root mean square error (RMSE) of T2 differences, between manual and automatic segmentation was LT: 1.50, LF: 1.44, MT: 1.86, MF: 1.28, and PAT: 2.92.
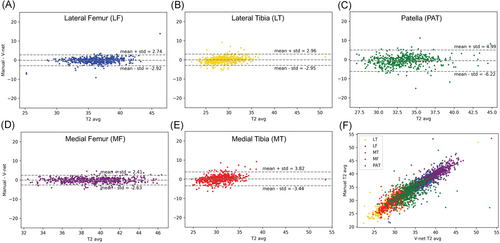
To understand the effect of DSC value on T2 calculation accuracy as measured by mean absolute error (MAE mm), we calculated the correlation of DSC vs T2 accuracy for the test dataset. For DSC more than 0.6 (which includes 78.13% of the entire data set, or 85.01% of the tibiofemoral dataset) the DSC and T2 error are uncorrelated (R-value > −.2) (Figure 5). In the femoral compartments data, 93.5% had DSC more than 0.6, and the MAEs are almost all within 3 ms (equal to ∼5-7% error).

3.2 T2 values, demographic data, pain and KL scores
Our analysis shows a strong association between the average T2 values of the LF, MT, and MF compartments with age, BMI, and sex (Table 3A).
| Independent variable | |||
|---|---|---|---|
| Age | BMI | Sex | |
| Dependent variable | Coefficient, P-value (95% CI for model coefficient) | Coefficient, P-value (95% CI for model coefficient) | (Coded as Male 1) coefficient, P-value (95% CI for model coefficient) |
| LT | 0.25, <.001 (0.24, 0.26) | 0.017, .012 (0.004, 0.03) | −0.11, .24 (−0.29, 0.07) |
| LF | 0.21, <.001 (0.20, 0.22) | 0.05, <.001 (0.04, 0.06) | −0.58, <.001 (−0.74, −0.42) |
| MT | 0.04, <.001 (0.036, 0.046) | 0.06, <.001 (0.05, 0.07) | 1.1, <.001 (0.99, 1.21) |
| MF | 0.15, <.001 (0.14, 0.16) | 0.038, <.001 (0.03, 0.05) | −0.59, <.001 (−0.74, −0.44) |
| PAT | 0.068, <.001 (0.06, 0.08) | 0.028, .0002622 (0.01,0.04) | −0.10158, .1994 (−0.26, 0.05) |
- Note: The P-value of feature significance is calculated using the likelihood ratio test.
- Abbreviations: BMI, basal metabolic index; LF, lateral femur; LT, lateral tibia; MF, medial femur; MT, medial tibia; OA, osteoarthritis; PAT, patella.
T2 values obtained from the PAT compartment showed significant associations with age (coeff = 0.068, P ≤ .001, CI = [0.06, 0.08]) and BMI (coeff = 0.03, P ≤ .001, CI = [0.013,0.04]), and weak associations with sex (coeff = −0.10, P = .20, CI = [−0.26, 0.05]). Females had significantly higher T2 values for all compartments except for MT (Table 3A).
Among the five compartments, MF T2 showed the strongest relationship with KOOS pain scores (coeff = −0.35, P ≤ .001, CI = [−0.44, −0.25]). We observed a strong association between KL and patella compartment T2 (coeff = −0.04, P = .002, CI = [−0.10, 0.019]) and weaker associations with LT and MT T2 (Table 3B).
| Independent variable | |||||
|---|---|---|---|---|---|
| LT | LF | MT | MF | PAT | |
| Dependent variable | Coefficient, P-value (95% CI for model coefficient) | Coefficient, P-value (95% CI for model coefficient) | Coefficient, P-value (95% CI for model coefficient)) | Coefficient, P-value (95% CI for model coefficient) | Coefficient, P-value (95% CI for model coefficient) |
| KOOS pain | 0.001, .98 (−0.09, 0.09) | −0.157, .002 (−0.26, −0.06) | 0.11, .021 (0.017, 0.20) | −0.34, <.001 (−0.44, −0.25) | 0.02, .37 (−0.025, 0.07) |
| KL grade | −0.046, .013 (−0.16, 0.06) | 0.019, 1 (−0.11, 0.15) | 0.05, .04 (−0.07, 0.18) | 0.03, .22 (−0.09, 0.15) | −0.04, .0017 (−0.10, 0.02) |
- Note: P-values are derived from likelihood ratio tests of the full model against model without the variable of interest.
- Abbreviations: KOOS, Knee Injury and Osteoarthritis Outcome Score; KL, Kellgren and Lawrence; LF, lateral femur; LT, lateral tibia; MAE, mean absolute error; MF, medial femur; MT, medial tibia; OA, osteoarthritis; PAT, patella.
3.3 T2 values and incident OA
The results of multivariate logistic regression models showed strong associations between T2 values and incident radiographic OA after 2 years and 4 years among all compartments except PAT (Table 4). Odds ratios suggest a higher risk of OA development with an increase in T2 values. For example, patients in the highest 25% quartile for LF (OR = 5.71, CI = (3.35, 10.27), P ≤ .001), MT (OR = 5.11, CI = (3.25, 8.29), P ≤ .001), and MF (OR = 5.53, CI = [3.32, 9.65], P ≤ .001) had a notably higher chance of development of OA after 2 years. The odds ratios were lower for 4 years of OA incidence prediction with wider confidence intervals.
| Response variable Independent variable | Adjusted OR, ref Q1 (CI 95%) | |
|---|---|---|
| 2 years' incidence N = 232, N control = 2108 | 4 years' incidence N = 150, N control = 2108 | |
| LT only | ||
| Q2 | 1.25 (0.73, 2.15) | 2.13 (1.182, 3.97) |
| Q3 | 2.80 (1.75, 4.60) | 1.96 (1.07, 3.71) |
| Q4 | 4.73 (3.02, 7.65) | 4.31 (2.50, 7.83) |
| P-value | <.001 | <.001 |
| LF only | ||
| Q2 | 2.23 (1.25, 4.14) | 1.40 (0.75, 2.70) |
| Q3 | 4.45 (2.61, 7.99) | 2.53 (1.43, 4.67) |
| Q4 | 5.71 (3.35, 10.27) | 3.16 (1.80, 5.81) |
| P-value | <.001 | <.001 |
| MT only | ||
| Q2 | 1.60 (0.96, 2.71) | 2.38 (1.33, 4.42) |
| Q3 | 2.70 (1.68, 4.44) | 2.34 (1.30, 4.36) |
| Q4 | 5.11 (3.25, 8.29) | 4.04 (2.33, 7.38) |
| P-value | <.001 | <.001 |
| MF only | ||
| Q2 | 2.12 (1.23, 3.79) | 2.17 (1.19, 4.16) |
| Q3 | 2.56 (1.50, 4.55) | 2.14 (1.167, 4.11) |
| Q4 | 5.53 (3.32, 9.65) | 3.44 (1.93, 6.52) |
| P-value | <.001 | <.001 |
| PAT only | ||
| Q2 | 0.73 (0.47, 1.10) | 0.66 (0.39, 1.11) |
| Q3 | 1.11 (0.75, 1.64) | 0.95 (0.59, 1.53) |
| Q4 | 1.15 (0.79, 1.70) | 1.14 (0.72, 1.80) |
| P-value | .11 | .18 |
- Note: Models are adjusted for sex, age, BMI and race.
- Abbreviations: BMI, basal metabolic index; LF, lateral femur; LT, lateral tibia; MF, medial femur; MT, medial tibia; OA, osteoarthritis; PAT, patella.
The average evaluation metrics over the 10-folds of cross validation for 2 years incidence reported as (base model, added T2 model) for the SVM model is sensitivity for test (0.650,0.73), and for train: (0.66,0.74), specificity test: (0.59,0.66), train: (0.60, 0.67), PPV test: (0.15, 0.19), train: (0.15, 0.20) and NPV test: (0.94,0.96), train: (0.94,0.96). The results obtained from the balanced bagging model has sensitivity test: (0.29,0.41), train: (0.95,0.96), specificity test: (0.77,0.79), train: (0.82, 0.85), PPV test: (0.12,0.18), train: (0.37,0.41) and NPV test: (0.91,0.92), train: (0.99,0.99). The results from the 10 folds cross validation for 4 years SVM model is sensitivity test: (0.71,0.67), train: (0.74,0.71), specificity test: (0.53,0.59), train:(0.53,0.59), PPV test: (0.096,0.104), train:(0.10,0.11), and NPV test: (0.96,0.96), train: (0.97,0.97) while the bagging model resulted in sensitivity test: (0.27,0.38), train:(0.93,0.96), specificity test: (0.76,0.80), train: (0.80,0.84), PPV test: (0.07,0.12), train:(0.25,0.30) and NPV test: (0.935,0.95), train:(0.994,0.996).
Figure 6 provides the mean ROC curves for both models for both datasets for comparison.
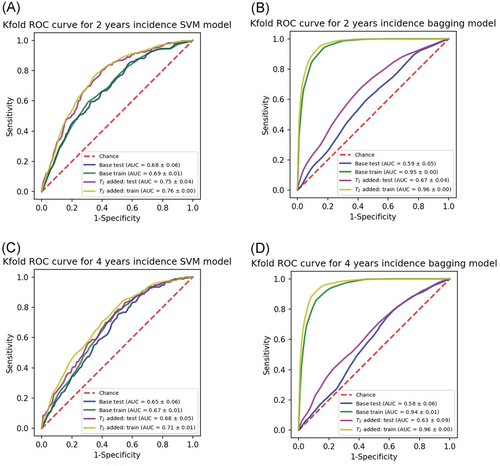
The addition of T2 variables has improved the most metrics across all methods and datasets, however, the improvement is more pronounced for the 2 years incidence prediction models. These findings are compatible with the strength of odds ratios which were higher for 2 years models.
3.4 T2 values and TKR
The results of the matched case model yielded a significant association between TKR and the MF T2 values 5 years prior to surgery (P = .036); the odds ratio for TKR was 1.32 per one standard deviation increase in the value of MF T2. No significant relationships were found between TKR and T2 values calculated 5 years prior, in the LT, LF, MT, and PAT compartments (Table 5).
| Response variable | ||
|---|---|---|
| 5 years' TKR incident | ||
| Independent variable | OR, P-value (CI 95%) | VIF for collinearity (<4) |
| LT | 1.009, .94 (0.78, 1.31) | 1.46 |
| LF | 1.0817, .60 (0.81, 1.45) | 1.81 |
| MT | 0.81, .09 (0.64, 1.03) | 1.21 |
| MF | 1.32, .0357 (1.02, 1.73) | 1.43 |
| PAT | 0.871, .25 (0.67, 1.10) | 1.12 |
- Note: OR is reported per one std increase in value of independent variable. P-values are adjusted for multiple comparison.
- Abbreviations: LF, lateral femur; LT, lateral tibia; MAE, mean absolute error; MF, medial femur; MT, medial tibia; OA, osteoarthritis; PAT, patella; VIF, variance inflation factor.
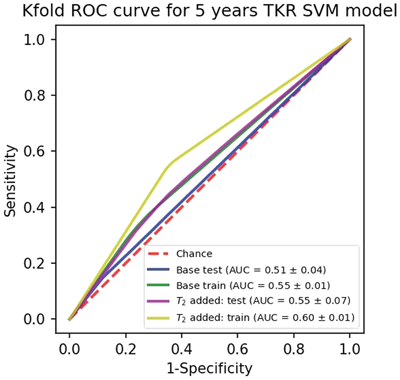
For the TKR predictive model built with base and added T2, results are as following. sensitivity test: (0.31,0.49), train: (0.35,0.55), specificity test: (0.72,0.61), train: (0.74,0.64), PPV test: (0.53,0.55), train: (0.58,0.61), and NPV test: (0.51,0.55), train: (0.53,0.59). Figure 7 shows the mean ROC curves for train and test folds.
4 DISCUSSION
In this study, we developed a deep learning-based method for cartilage T2 assessment which we used to analyze the entire OAI dataset (N = 25 729). Equipped with the largest sample of knee cartilage T2 and OA data to date, we reliably assessed the relationships of the T2 biomarker with demographic features,11, 21, 22 OA status, and clinical factors such as knee pain.23 We also explored the role of T2 as a predictor of future radiographic OA and TKR incidence.
The recent development of machine learning models has triggered massive research into the automation of medical image segmentation.24 Convolutional deep learning architectures are especially proficient for image data processing. Networks comprising encoding-decoding paths are capable of producing accurate segmentation. These architectures can handle either 2D or 3D images. With regard to the first type, U-Net25 has previously found application in the segmentation of cartilage and meniscus in knee MRI.26 Encoding-decoding networks suffer from loss of spatial information due to the pooling layers that are used to reduce the feature representation size. These details are to be recovered through the decoding path. To alleviate such a problem, U-Net utilizes feature concatenation between the compressing and decompressing paths improving the network's ability to reconstruct the lost details. A different decoding approach has been followed by SegNet,27 where instead of helping feature up-sampling by means of encoding-decoding connections, encoding max-pooling indexes are stored, and representation details are learned byways of trainable weights, namely using transpose convolutions.
While previous studies performed cartilage segmentation on high resolution, nearly isotropic sequences such as 3D DESS,28 we segmented cartilage in highly anisotropic T2 mapping images which poses a great challenge. Our model improves on previous attempts26 and achieves higher DSC on all the five compartments, which suggests greater accuracy. The calculated T2 averages per compartment show good correlation and agreement on Bland-Altman graphs with T2 averages from manual segmentations. Inter-variability, described as RMSE of T2 differences between manual and automatic methods, was comparable to previously reported manual segmentation inter-reader variability.29 The patella compartment had the highest deviation between manual and automatic T2. Difficulties in patella segmentation (compared to tibiofemoral compartments) were previously observed26; the proximity of the patella to the transmit-receive coil's edge and it's susceptibility to subject movement make this region the most affected by image artifacts—which are challenging for accurate segmentation.
The relationship between cartilage T2 values and gender, age, and BMI in knees with or without radiographic OA have been previously studied by.11, 21, 22 In a similar study of OAI subjects, Joseph et al,11 show a significant association between sex and MF T2; our models confirm but show a significant association between sex and T2 in LF, MT, and MF compartments. In agreement with the previous study, females have higher T2 in all compartments except for MT.11 Previous studies11 have found that T2 values increase with age but they did not warrant a conclusive verdict on the association between age and average T2 in all compartments. On the other hand, we show that there is a strong positive relationship between age and T2 for all compartments: LT, LF, MT, MF, and PAT. We also conclude that there is sufficient evidence of a significant positive relationship between T2 and BMI for LF, MT, and MF.
Average T2 values are significantly higher for subjects with knee pain (in one knee or both knees) compared to patients without pain.23 We confirmed that T2 values are positively associated with pain and the results show significant associations for LF, MT, and MF compartments. Our results agree with those from23 which show significant associations with pain for the medial compartment, but we also found significant results for LF vs LT.
The study performed by Dunn et al30 is one of the earliest studies on the relationship between T2 and radiographic OA graded by KL grade. The results of this study suggested a significant increase of T2 among patients with OA; in particular, MF and MT were found to have the strongest association. Our analysis of knees with OA and without OA show significant associations between KL grade and T2 in the LT, MT, and PAT compartments. However, none of these findings suggest a strong relationship.
Some demographic factors such as BMI and previous knee injury are significantly associated with the onset of OA incidence,31 OA progression, as well as MRI extracted biomarkers such as bone shape.19 Our models show that, when controlled for such risk factors, high T2 could be an early indication of OA incidence. In fact, patients with the highest T2 values are at much higher risk of OA development 2 and 4 years after. Our results reiterate the previous findings on the relationship between T2 and OA incidence (which were performed on a small sample size of 50 cases and 80 healthy control patients), but with much stronger confidence.32 For the patella, however, we did not find a significant association between average T2 and OA incidence. This may be because patella segmentation produced the lowest DSC and higher error, compared to manual segmentation.
Besides the segmentation issues, a weak association between the patella T2 and radiographic OA incidence, unlike what is observed for the tibiofemoral compartments, could be attributed to the fact that the KL grade is based on the tibiofemoral compartments and the PF compartment was not imaged by x-ray in OAI.
Our predictive models showed that T2 values incorporation with other biomarkers can improve the OA predictive ability and hence our automatic segmentation model can be used to improve such models in the future. However predictive model performances were weak. In addition, even though ensemble tree models are not normally prone to overfitting, the large gap between the performance of the model on train and test splits signals overfitting during the training of the bagging model. To avoid this problem, modifications such as the pruning of the individual trees (base classifiers) and tuning the hyperparameter for the tree depths can be performed.33
In reality, building highly accurate predictive and diagnostic models for OA requires rigorous feature engineering methods34, 35 work which is beyond the scope of this paper. We limited this initial study to the T2 analysis of average values across compartments, however, previous studies reported that spatial assessment of the knee cartilage relaxation times using laminar and sub-compartmental analyses could lead to better and probably earlier identification of cartilage matrix abnormalities36, 37 Extraction of second-order statistical information or texture analysis38, 39 has been widely used to overcome the limitation of the average-based approaches. Voxel-based relaxometry techniques have also been previously proposed40; this technique allows for the investigation of local cartilage composition differences, through voxel-based statistics as statistical parametric mapping,41 principal component analysis,42 or deep learning feature extractions.34
TKR is the most effective intervention for end-stage OA12; however, due to its costs and planning requirements, finding predictive variables for TKR is highly desirable. Previous research has found relationships between TKR and sex, BMI, and other risk factors in OAI12 and targeted analyses of high-risk sub-populations.43 Despite these extensive research efforts, the relationship between TKR and biochemical compositional biomarkers such as T2 is under-investigated. The results of our matched case-control models present new evidence of association with TKR incidence; we found a weak but significant association between MF, T2, and TKR incidence within 5 years (P = .036). Other confounding factors such as structural changes, knee symptoms, economic factors, and so on may be considered in a multivariate analysis in future research.
Despite the promising results of this study, some limitations need to be mentioned. The MRI images occasionally contained image artifacts that manual segmentation readers could exclude from segmentation, but our deep learning model produces complete segmentations for each slice where cartilage is visible. To verify that these artifacts are negatively affecting the model performance, we re-calculated the score after excluding the slices containing image artifacts; and we obtained improved DSCs for the test dataset: LT: 0.74 ± 0.11, LF:0.71 ± 0.12, MT:0.79 ± 0.10, MF:0.72 ± 0.11, and PAT:0.67 ± 0.17. Hence, future research into automatic identification of artifact slices could be helpful. While we consider the classical average analysis over the entire dataset an important first step to better understand the role of T2 as an early biomarker of OA, our future directions include the usage of more complex feature extractions to better exploit the complexity and the richness of information enclosed in cartilage T2 maps.
In conclusion, we built a reliable automatic method to extract T2 relaxation time measurements from the entire OAI dataset and demonstrated the association between elevated T2 and future OA incidence and TKR. This paper brings new important insights into the role of T2 as a quantitative biomarker for OA.
ACKNOWLEDGMENTS
This project was supported by R00AR070902 (VP), R61AR073552 (SM/VP) from the National Institute of Arthritis and Musculoskeletal and Skin Diseases, National Institutes of Health, (NIH-NIAMS).
AUTHOR CONTRIBUTIONS
A break-down of author's contribution is presented below. All the authors have reviewed and approved the submission of the manuscript to the Journal of Orthopaedic Research. Study design: VP, SM. Data processing: AR, FC, GBJ. Clinical expertize: TML. Manuscript draft: AR, VP, FL. Statistical expertize: AR, JL, FL, GBJ. Manuscript revision: All the authors. Obtaining funding: VP, SM.


