FE analysis of the effects of simplifications in experimental testing on micromotions of uncemented femoral knee implants
ABSTRACT
Experimental testing of orthopaedic implants requires simplifications concerning load application and activities being analyzed. This computational study investigated how these simplifications affect micromotions at the bone-implant interface of an uncemented femoral knee implant. As a basis, validated in vivo loads of the stance phase of gait and a deep knee bend were adopted. Eventually, three configurations were considered: (i) simulation of the complete loading cycle; (ii) inclusion of only tibiofemoral loads (ignoring patellofemoral loads); and (iii) applying only a single peak tibiofemoral force. For all loading conditions the largest micromotions found at the proximal anterior flange. Without the patellofemoral force, peak micromotions increased 6% and 22% for gait and deep knee bend, respectively. By applying a single peak tibiofemoral force micromotions were overestimated. However, the peak micromotions corresponded to the maximum tibiofemoral force, and strong micromotion correlations were found between a complete loading cycle and a single peak load (R2 = 0.73 and R2 = 0.89 for gait and deep knee bend, respectively). Deep knee bend resulted in larger micromotions than gait. Our study suggests that a simplified peak force can be used to assess the stability of cementless femoral components. For more robust testing, implants should be subjected to different loading modes. © 2015 Orthopaedic Research Society. Published by Wiley Periodicals, Inc. J Orthop Res 34:812–819, 2016.
Due to the aging population and an increasing number of younger patients, there is a stronger need for total knee replacements (TKR) with an improved endurance. Recent long-term follow up studies and registry reports have shown promising outcomes for uncemented femoral components in TKR.1-3 However, a higher incidence of implant loosening has been reported for younger patients and some high-flex designs,4, 5 which necessitates the improvement of existing designs.6, 7
Long-term stability at the bone-implant interface of cementless implants can be achieved by providing an adequate primary stability, which is mostly defined by the relative motion between bone and implant, also known as bone-implant micromotions.8-11 Small micromotions (<40–50 μm) provide the necessary condition for secondary biological fixation, induced by bone growth in- and onto the (porous) surface of implant. Hence, direct post-operative evaluation of micromotions at the bone-implant interface of a cementless implant is useful to gain insight into long-term implant fixation.
Experimental studies are known as the gold standard to assess micromotions.12-14However, various limitations are apparent in experimental testing set-ups. One limitation lies in the loads that can be applied. Generally, only simplified loading configurations can be used, representing the peak loads occurring during activities of daily living (ADL).15-17 Most experimental set-ups to test the stability of the femoral knee implant are even more simplified, in which only the tibiofemoral (TF) contact forces are being applied based on a proposed load set-up from the International Organization for Standardization (ISO 14243-1 and ISO 14243-3).18, 19 However, the effect of neglecting the patellofemoral (PF) force and using a simplified peak TF force on the micromotion is unclear. Furthermore, a femoral knee implant experiences a wide range of activities, which have variable impact on primary stability.20 Hence, it is important to assess the effects of different ADLs on the micromotions. However, it is quite complex to implement many different loading conditions in experimental set-ups.19
Another limitation of experimental set-ups is the limited capacity to assess the micromotion patterns at the whole bone-implant interface. Usually a limited number of measurement sites (e.g., 1–4 sites) are included using uni-directional motion sensors (e.g., linear variable differential transducers).16, 21 However, prior to testing, it is not known at which locations these sensors should optimally be placed. This problem is more apparent for a femoral knee implant due to its complex geometry.
We propose that the application of Finite Element (FE) modeling can be used as a complementary guidance tool to address these limitations. Recently, a validated FE model of the Kansas knee simulator22 has been developed, which successfully reproduced in-vivo forces measured by Kutzner et al.23 Such dynamic loading profiles can be utilized to predict micromotions under different complete physiological loading cycles, as well as simplified loading conditions. Hence, it provides insight into the differences in the micromotion due to variations in loading conditions and ADLs.
In FE analyzes, it is essential to have a clear definition of micromotions. In an experimental set-up, the micromotion is defined as the difference in displacements of bone and implant, measured between an un-loaded and loaded state.18 In an FE analysis, micromotions can be defined to correspond exactly to the experimental definition. Thus, when a complete loading cycle is being incrementally applied, the micromotion can be obtained at each incremental load with respect to the initial position. However, it is likely that a full trajectory of motion under a complete loading cycle results in a greater range of micromotion. This suggests a second definition of micromotion: To monitor the trajectory of motion and determine the largest distance between all increments.24 Therefore, it is important to use the most adequate definition for addressing our research questions.
The objective of the current study, therefore, was to investigate how micromotions of an uncemented femoral knee implant subjected to different physiological loading conditions compared against those induced by simplified loading conditions. Using FE analysis, we aimed to answer following research questions: (i) What is the effect of omitting the PF forces on the micromotions; and do the largest micromotions occur during the peak TF force? (ii) What is the effect of two very different ADL's (gait and deep knee bend) on the micromotion? (iii) What are the most relevant measurement sites in an experimental set-up based on the predicted micromotions at bone-implant interface? (iv) What is an adequate measure for micromotion to compare different loading conditions?
METHODS
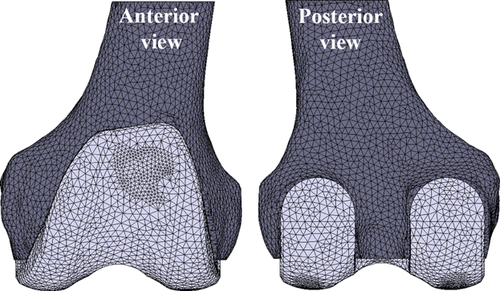
A 3D model of full femur was created from cadaveric CT-data using medical imaging software (Mimics 14, Materialise, Belgium). Bone cuts were made following the manufacturer instruction by using a cutting guide and only the distal part was kept for a length of about 10 cm. The CAD file of size three uncemented PFC® Sigma® Cruciate-retaining (CR) femoral knee implant was provided by the manufacturer (DePuy Synthes Joint Reconstruction, Warsaw, IN). Both models were imported into FE software Marc/Mentat 2007 (MSC. Software Corporation, Santa Ana, CA) to create an FE mesh. The mesh density was based on a convergence study, in which the percentage of surface area less than five micron did not change by more than 2% and also the distribution of micromotion was similar for three different models with average edge length of 0.5 mm, 1 mm, and 2 mm. Therefore, solid linear four-noded tetrahedral elements with the average edge length of 2 mm was used for both implant and bone meshes (coarser elements were used for the inside of the bone), resulting in 43,476 and 33,406 of elements for bone and implant, respectively (Fig. 1).
The implant and the bone were modeled as an isotropic linear elastic material. The implant was assigned with material properties of cobalt-chrome alloy (Young's modulus (E): 210 GPa, Poisson's ratio (ν): 0.3). To assign realistic bone material properties to the FE model, a calibration phantom (solid, 0, 50, 100, 200 mg/ml calcium hydroxyapatite, Image Analysis) was scanned along with the cadaver. Using in-house software, the Hounsfield Units were converted to equivalent calcium values and subsequently, these were related to the Young's modulus (47.8–14,240 MPa).25, 26
Contact Parameters
A single-sided touching contact algorithm was defined between bone and implant. We used a Coulomb bilinear (displacement) friction model with a coefficient of friction of 0.95, provided by the manufacturer for a Porocoat® surface coating (DePuy Synthes Joint Reconstruction, Leeds, UK). Around the femoral pegs, which had a grit-blast surface, a coefficient of friction of 0.4 was used.27 To apply a sensible value of interference fit at the bone-implant interface, we simulated a pull-off test, which was performed by the DePuy Synthes Joint Reconstruction (Warsaw, IN), using the same implant design and a polyurethane foam block that had been hand cut by experienced surgeons. The results of this verification study showed that using the interference closure option of MSC.Marc, an interference fit in the anteroposterior (AP) direction of 180–300 μm provided a similar range of pull-out forces (925 ± 215 N (mean ± SD)) as found in the experiment (886.1 ± 147.4 N (mean ± SD)). In the current study, we applied two interference fits of 20 and 200 μm, as a worst case interference fit and a more realistic interference fit, respectively. In addition, no interference fit was applied around the pegs.
Loading Conditions
The bone model was fully constrained proximally. To derive the implant-specific boundary conditions for the micromotions analysis, a previously published FE model of the lower limb,22 developed in Abaqus/Explicit, was utilized. Briefly, the model included the femur, tibia and patella, tibiofemoral ligaments, extensor mechanism, quadriceps and hamstrings muscles, and mechanical actuators (used to apply loads at the hip, ankle, and muscles). Target TF joint loading profiles for stance phase of gait (SG) and deep knee bend (DKB) activities were adopted from published data from an instrumented telemetric tibial tray measuring in vivo knee joint loads.23, 28
The lower limb model was initially implanted with the same TKR component design as the telemetric patients, and simulations were performed with a series of proportional-integral-derivative (PID) controllers, which applied the external loads (quadriceps and hamstrings muscle force, vertical hip force, ankle flexion-extension torque, internal-external torque, and varus-valgus torque) required to reproduce the experimentally-measured loading conditions at the TF joint for each activity.
Subsequently, these external loading conditions were applied directly to the model which was virtually implanted with a rotating-platform (RP) Sigma® CR design, and SG and DKB simulations were performed. TF and PF force vectors acting on the femoral component as a result of contact with the tibial insert and patellar button were recorded and used as input for the current study. Subsequently, four other simplified loading conditions, mimicking typical loading profiles that would be used in an experimental set-up were also simulated. In the first variation, for both the SG and DKB activity, the PF contact force was excluded from the loading profile, applying only the TF contact force. In the second variation, only the single peak TF contact force of both activities was applied, omitting the remainder of the loading cycle. Hence, in total, six different loading cases were defined. All models were analyzed using linear analyses, in which the stance phase of gait and the deep knee bend were simulated in a quasi-static manner (MSC.Marc2007r1, MSC. Software Corporation, Santa Ana, CA).
Micromotions
The relative displacement of the implant with respect to the bone was calculated using the same technique as Van der Ploeg et al.24 Briefly, the implant nodes in contact with the bone surface were projected onto the closest bone contact face at each time increment. The nodes at the tip of the pegs and those in the overhang area at the anterior flange, which had a large gap, were excluded from the micromotion analyzes. The deformation of bone was accounted for in the computational algorithm and both the magnitude and direction of the micromotions were calculated by tracking the trajectory of the projections.
Two different measures of micromotions were defined in each increment: (i) the micromotion relative to the initial position of the implant (un-loaded phase), which is equivalent to the micromotions that would be measured in an experimental set-up (referred to as reference micromotion); and (ii) the largest possible distance between two points of all projected displacements, occurring during a discretized full cycle (referred to as resulting micromotion) (Fig. 2). The resulting micromotion provides more information on the largest possible displacement between bone and implant during a full physiological cycle of an activity.
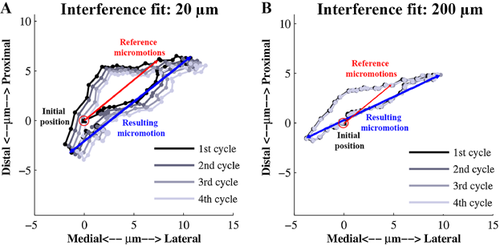
To account for initial settling of the implant, for each activity, four consecutive cycles were run. Between each of the four cycles, an extra increment was added in which no force was applied. The micromotion results presented here were obtained in the fourth loading cycle, only.
For each simulation, the percentage of the implant surface area (excluding overhang area) with resulting micromotions less than a defined threshold was calculated to illustrate the effect on the ingrowth potential. In addition, the peak and average of both reference and resulting micromotions of implant nodes were obtained.
RESULTS
The preliminary “settling” simulations revealed a migration pattern when the interference fit was 20 μm. However, for the higher interference fit, no settling of the implant was observed and the motion paths were virtually identical for the four loading cycles (Fig. 2).
Both reference and resulting micromotions depended on the interference fit and type of activity. When looking at the incremental changes, the average of the reference micromotions clearly followed the pattern of the applied TF contact force, with a peak micromotion corresponding to the maximum TF force especially for the SG loading (Fig. 3). However, the peak micromotion during SG loading at the maximum TF force was reduced remarkably when the interference fit was increased (Fig. 3C). In addition, it appeared that omission of the PF force did not change the observed trend. Therefore, the first peak observed in the micromotions evolution was probably a result of the maximum flexion angle that was reached at that point in the loading curve (Fig. 3).
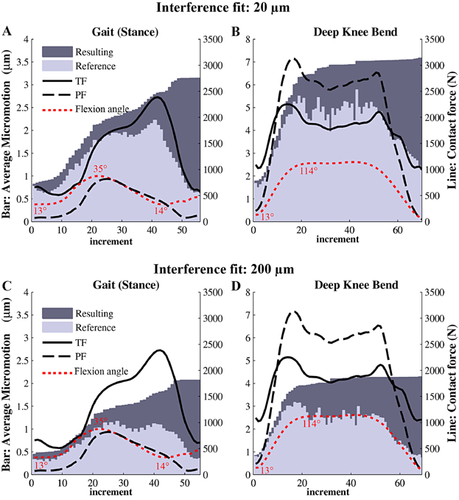
The maximum of the average reference micromotions was 25–50% less than the average resulting micromotions of the last incremental load (Fig. 3). Based on this comparison, the resulting micromotions were chosen as the main measure of micromotions to compare different loading conditions. In the following results, “micromotion” refers to the resulting micromotions, unless stated otherwise.
By increasing the interference fit, the peak micromotions under the DKB loading cycle decreased from 46 to 38 μm, and the surface area with micromotions lower than 5 μm increased from 56% to 76%. The effect of interference fit was less pronounced under SG loading, with an increase of the surface area with micromotions lower than 5 μm from 78% to 92%. However, at a threshold of 50 μm, no differences were seen between the two levels of interference fit.
All loading conditions resulted in a similar distribution of micromotions. The largest micromotions were present at the proximal part of the anterior flange, which appeared to be the most relevant measurement site (Fig. 4). The posterior condyles also showed relatively high micromotions, especially for the SG loading (Fig. 4), while the lowest values were found in the distal region.
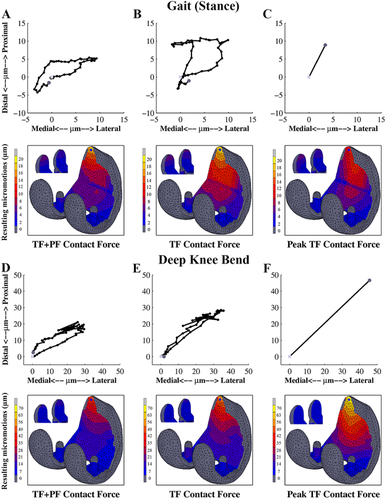
The peak micromotion during the DKB was about 2.5 times higher than the SG loading condition (Fig. 4A and D). Although the distribution was similar, the trajectory of a node in the proximal part of the anterior flange was slightly different between SG (Fig. 4A) and DKB (Fig. 4D). The trajectory generally followed the same direction, first heading in the proximo-lateral direction, and subsequently returning back in the opposite direction forming a loop pattern.
In the absence of the PF force, the peak micromotions were larger (6% and 22% for the SG (Fig. 4B) and the DKB (Fig. 4E) activity, respectively). These differences slightly reduced when the interference fit was increased. In addition, the trajectory of micromotions in the proximal part of the anterior flange showed a larger motion towards the proximal direction in the absence of PF force (Fig. 4B and E). Applying a single peak TF contact force resulted in a slight decrease of peak micromotion under the SG load (Fig. 4C), while it noticeably increased the peak micromotion of the DKB loading case (Fig. 4F).
The correlation between the nodal micromotions at the implant interface under the complete physiological load (TF + PF) with the loading condition without the PF force was strong, with an R2 = 0.90 and R2 = 0.93 for SG and DKB loads, respectively (Fig. 5A and B). The micromotions of the loading condition with the single peak TF contact force were also correlated with the complete loading cycle, which showed slightly weaker correlations with R2 = 0.73 and R2 = 0.89 for SG and DKB loads, respectively (Fig. 5C and D). Despite these rather high correlation coefficients, the micromotions were generally overestimated when neglecting the PF contact force (Fig. 5A and B) or by considering only the peak TF force (Fig. 5C and D) as can be seen by the slope of the correlations.

DISCUSSION
We developed an FE model of an implanted distal femur to predict micromotions at the bone-implant interface of an uncemented femoral knee component under different physiological loading conditions as a complementary guidance tool for in-vitro tests. Using this model, we investigated the effect of simplification of loading condition, whether peak micromotions occur during the peak TF force, and the effect of activity. In addition, we aimed to determine the most relevant regions to measure micromotions in an experimental set up. However, first it was important to determine an adequate measure of micromotion before answering each specific research question. As far as we know, only Van der Ploeg et al.24 have utilized the same definition for resulting micromotion in a simulation of the hip stem, which was also shown to result in a greater range of values compared to other measures of micromotion. In the current study, the comparison between two measures of micromotion showed that the reference micromotions underestimated the micromotions as predicted over a complete cycle (resulting). This indicates that the definition of micromotion affects the magnitude of the predicted values, and it is therefore important to explicitly explain the technique to obtain the micromotions. Based on our results we would recommend computing the micromotion from a full cycle rather than with respect to the initial position in a computational model.
There are only a few studies that have investigated the primary stability of femoral knee implants.18, 19, 21, 29, 30 One possible reason for the limited amount of research is probably the excellent long-term outcome of femoral knee implants.3 However, recent applications of new materials such as ceramic and PEEK,30, 31 or the application of new porous materials at the interface32 necessitates development of new pre-clinical testing approaches. In addition, the distal femur is subjected to a complex loading regime during different ADLs, in which the position and direction of the contact loads change constantly, which requires the utilization of a sophisticated experimental set-up. As already mentioned, most experimental set-ups are designed for a limited flexion angle, mainly representing gait, and usually patellofemoral contact forces are omitted.18, 19Only Wackerhagen et al.29 designed a custom-made set-up to apply both the TF and PF force. However, the effect of the PF force on the primary stability is yet unknown. Therefore, the current FE study aimed to assess the effect of the simplification of loading conditions. We found that ignoring the PF contact force slightly increased the magnitude of the micromotions, with the most pronounced effect during the deep knee bend load. The predicted micromotions under the most simplified loading condition, applying a single peak TF force, showed increased overestimation of micromotions in comparison with the loading condition omitting only the PF contact force. However, based on the good correlation, the similar motion pattern, and the fact that the maximum average reference micromotion was found at the maximum TF contact force, we suggest that a simplified loading condition consisting of the peak TF force is an acceptable alternative for the complex loading regime during experimental measurement of micromotions. Nonetheless, this study clearly shows that by applying a complete physiological loading profile, using simulation techniques or a sophisticated experimental set-up, more comprehensive and accurate data about the primary stability of these implants can be obtained.
In the current study, we combined an advanced micromotion analysis with an implant-specific physiological loading configuration, based on dynamic FE analyzes fed with in vivo patient measurements, and validated against experimental data. Our results showed that the DKB loading case would result in a higher range of micromotions. We also found that both the magnitude and the angle of the TF force vector had a clear effect on the micromotions (Fig. 3). Conlisk et al.19 demonstrated that the micromotion of a femoral knee implant increases with a higher flexion angle. Kassi et al.17 reported a higher range of micromotions during stair climbing in a hip stem. Chong et al.16 also found higher micromotions for a cementless tibial implant with stair climbing. Similarly, our results show that for a femoral knee implant the deep knee bend activity has a more detrimental effect on the primary stability than the stance phase of walking. Expansion of the range of activities and incorporating these in the methodology presented here may aid in improving implant safety and may assist implant design optimization for cementless femoral TKR components.
Relative to micromotion values reported in the literature, which were in the order of 0–250 µm, we found smaller ranges of micromotion.18, 19, 29 This is attributable to the fact that we did not model plasticity or visco-elastic behavior of the bone, which are important factors for the primary stability of cementless implants.33, 34 To include the effect of bone plasticity and the visco-elastic effects on implant stability, future studies can focus on improving a more realistic continuum model of the mechanical behaviour of bone. In addition, experimental studies used transducers to quantify the displacements between the bone and implant, while our micromotions were calculated at the actual interface, which also affects the comparison.35 Therefore, it is important to develop an accurate experimental approach to capture micromotions as adjacent as possible to the interface for validation purposes.
Furthermore, we found that the peak micromotions occurred at the proximal part of the anterior flange, regardless of the loading conditions. Zelle et al.20 reported higher shear stresses beneath the proximal part of the anterior flange particularly during deep flexion, which is consistent with our findings. This suggests that the proximal area of the anterior flange is the most relevant site to estimate the maximum range of micromotions during in-vitro tests. In addition, distal regions can provide an estimate of a minimum range of micromotions, which can indicate whether the necessary condition for bone ingrowth is present or not.10 Hence, these two regions are suggested as the most relevant sites to estimate the range of micromotion of a femoral knee implant. From clinical point of view, there is a higher risk of inadequate bone ingrowth due to larger micromotions at the anterior region. However, it should be realized that our simulations only represent the situation immediately post-operatively, and did not include the effect of progressive bone ingrowth. In the long term, secondary fixation due to bone ingrowth in locations with a low micromotion may provide the additional stability required to decrease micromotions at the proximal side of anterior flange, which was not simulated in the current study.
Obviously, this study has a number of limitations. In the current study, implant-specific kinematic data was used and applied to a single femur. Hence, an alternative implant design or femur with a different bone quality may result in a different outcome. The interference fit values were extracted from experimental data using a PU foam block. We were unable to find suitable data in the literature on an appropriate interference fit for a femoral knee implant, likely due to the complex nature of the measurement. Abdul-Kadir et al.15 studied the interference fit in a femoral hip stem and concluded that small values of interference fit (10–100 μm of diametrical interference fit) are adequate to stabilize the hip stem to a large extent. Gebert et al.34 investigated the effect of interference fit on the primary stability of cementless femoral hip resurfacing implants. They found that a diametrical interference fit of about 140 μm would result in an acceptable primary stability. Hence, we applied an interference fit that was close to reported values in the literature for other implant designs next to a more drastic situation. In addition, we found a migration pattern with a low value of interference fit, which indicates that a certain amount of interference fit is necessary to achieve adequate primary stability.
CONCLUSION
The present study has shown that the micromotion of a full cycle of activity would be larger than micromotion of any single load points with respect to the un-loaded phase. Therefore, it is important to use an adequate measure of micromotion for prediction of micromotion. We have found an overestimation of micromotion while applying the most simplified loading condition using the single peak TF force of activity. However, the maximum micromotions of an uncemented femoral knee implant, do indeed, occur at the peak of TF contact force. Furthermore, strong correlation between nodal micromotions under a simplified loading condition with a complete physiological loading was found and also the micromotion distribution was quite similar between different loading conditions. Therefore, we suggest that the single peak TF force of an ADL would be adequate for in-vitro tests to assess the primary stability. In addition, due to the clear effect of activity on the micromotions, it is essential to assess micromotion under different type of activities. Finally, we would recommend measuring in-vitro micromotion in the proximal side of anterior flange and distal regions to detect regions of high and low micromotion, respectively, to estimate the range of micromotion of a femoral knee implant.
AUTHORS’ CONTRIBUTIONS
S.B. conducted the modeling and analysis of the results. S.B., D.J., D.W., M.W., and N.V. carried out the design of study and drafted the manuscript. C.K.F. and P.J.K. developed the lower body model and provided the boundary condition data and partially revised the manuscript. All authors have read and approved the final version of the submitted manuscript.
ACKNOWLEDGMENTS
This study was funded by DePuy Synthes Joint Reconstruction, Leeds, UK. One of the authors is under employment of DePuy Synthes Joint Reconstruction. DePuy Synthes played no role in the interpretation of results.


