Hip range-of-motion (ROM) is less than normal after rotational acetabular osteotomy for developmental dysplasia of the hip: A simulated ROM analysis
ABSTRACT
The optimal reorientation of the acetabulum for developmental dysplasia of the hip (DDH) is unknown in terms of hip range-of-motion (ROM). The simulated ROMs of 52 DDHs after rotational acetabular osteotomy (RAO) with several patterns of femoral head coverage and those of 73 normal hips were analyzed using computer models reconstructed from CT images. After RAO with a lateral center edge angle (LCEA) of 30° and an anterior center edge angle (ACEA) of 55° producing coverage similar to that of normal hips, the maximal flexion and maximal internal rotation at 110° flexion with 20° adduction were significantly smaller than those of the normal group. To achieve ROMs after RAO similar to those of the normal group, an LCEA of 30° with an ACEA of 45°, an LCEA of 25° with an ACEA of 45° to 50°, and an LCEA of 20° with an ACEA of 50° could be preferred angles to target, even though they provided smaller coverage than that of normal hips. After RAO producing femoral head coverage similar to that of normal hips, the maximal flexion and the maximal internal rotation at 110° flexion with 20° adduction were significantly smaller than those of the normal group. © 2015 Orthopaedic Research Society. Published by Wiley Periodicals, Inc. J Orthop Res 34:217–223, 2016.
There are several types of acetabular redirection osteotomies for developmental dysplasia of the hip (DDH) with mild degenerative change of the cartilage, including Wagner spherical acetabular osteotomy, Eppright dial osteotomy, Tagawa rotational acetabular osteotomy (RAO), and Ganz periacetabular osteotomy (PAO).1 These procedures aim at reducing contact pressure in the hip joint and preventing progressive subluxation in order to halt osteoarthritic changes in patients with DDH. There are some differences among these osteotomies. The first is the design of the osteotomy, which affects the bone contact area and the ease of redirection of the acetabular fragment. The second is the direction of acetabular movement, which affects the postoperative range of motion and the vulnerability to femoro-acetabular impingement (FAI). RAO is one of the established acetabular redirection osteotomies for DDH. To increase femoral head coverage, lateral, anterior, or both rotations of the acetabulum are performed based on the magnitude of the acetabular dysplasia. It has been suggested that, in order to reduce contact pressure during gait, both lateral and anterior rotations are more effective than lateral rotation alone.2 On the other hand, the redirection of the acetabulum generates a mismatch between the acetabulum and femoral neck, which reduces flexion and internal rotation of hip range-of-motion (ROM) and can lead to FAI after periacetabular osteotomy.3 There have been no reports of simulated RAO to mimic the femoral head coverage of normal hips. The purpose of this study was to analyze simulated ROM after RAO with several patterns of femoral head coverage.
MATERIALS AND METHODS
Subjects
A consecutive series of RAOs performed in patients with DDH from April 2006 to December 2012 was retrospectively reviewed. The CT images that had been taken for preoperative surgical planning were used in this study. The inclusion criteria were Crowe Group-I DDH4 with a center-edge (CE) angle ≤ 20° on plain anteroposterior radiography,5 with neither signs of advanced or terminal osteoarthritis (OA) (Tönnis classification ≥ grade 2)6 nor of Perthes-like femoral head deformity. The DDH group comprised 52 hip joints from 29 women with an average age of 32 years (range, 16–48 years). As controls, CT images of 73 normal hip joints from 49 healthy female volunteers with an average age of 72 years (range, 63–80 years) were obtained from a CT image database according to the following criteria: no hip symptoms, no signs of OA (Tönnis classification ≥ grade 1) or acetabular dysplasia (CE angle ≤ 20°), and no previous hip surgery. The entire pelvis and bilateral femora were scanned using a helical CT scanner with a slice pitch of 1 mm and 1.25 mm thickness. Individual names were removed from the scans, and all study protocols were approved by the institutional review board.
Coordinate Systems
Standard pelvic and femoral coordinates were defined for morphological study and ROM simulation.7, 8 The pelvic reference coordinates were defined by sagittal pelvic tilt in the supine position and bilateral anterior superior iliac spines. The femoral reference coordinates were defined by the posterior femoral plane, including the most posterior point of the greater trochanter and the posterior femoral condyles, the center of the femoral head, and the knee center. The preoperative femoral head center determined by a best-fit sphere technique was set to be the center of acetabular redirection and femoral motion. The neutral position of the hip was defined as the position at which both the pelvic and femoral coordinates were parallel.
Morphological Study
Three orthogonal planes (coronal, sagittal, and axial) were reconstructed using 3D viewer software (3D template: Japan Medical Materials, Osaka, Japan). The following parameters were measured as morphological factors. Lateral and anterior center edge angles were measured on coronal and sagittal views through the femoral head center, respectively. Femoral anteversion, alpha angle, and neck-shaft angle were measured as previously reported.7, 9
RAO Simulation
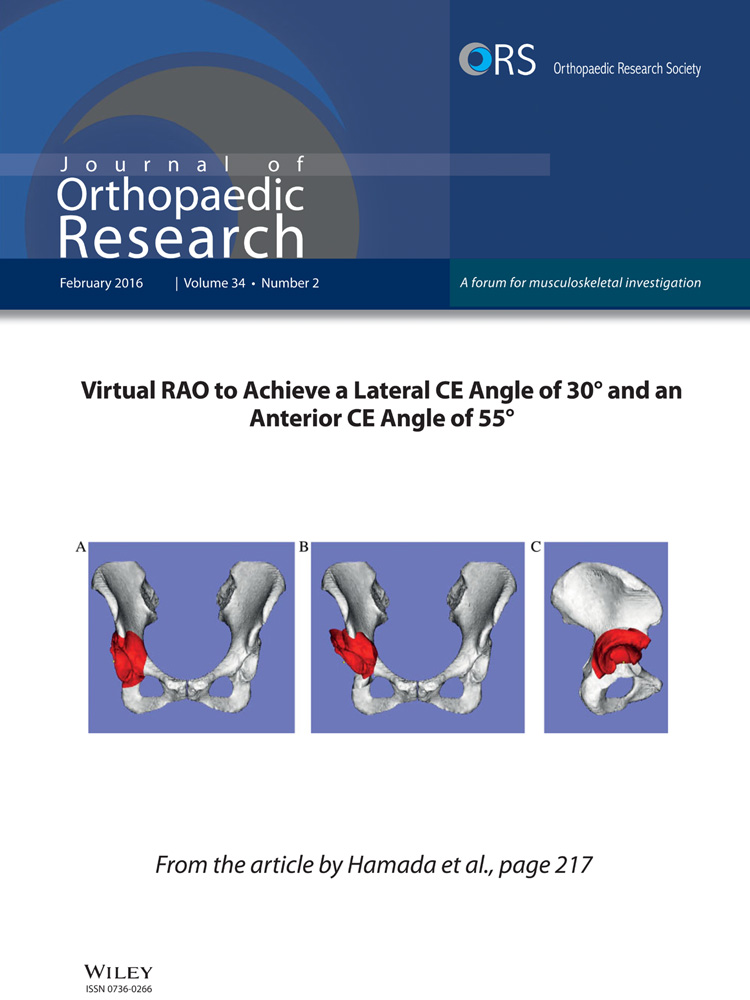
3D surface models of the pelvis and femur were reconstructed from the CT images. Virtual acetabular osteotomy was performed on the pelvic models by a sphere with a radius of 40 mm from the femoral head center, which was similar to our RAO technique. Based on morphological study of femoral head coverage, redirection of the acetabulum was performed to mimic normal coverage of the femoral head. Lateral rotation of the acetabulum to achieve a postoperative lateral center edge angle of 30° and sagittal rotation to achieve an anterior CE angle (ACEA) of 55° after lateral rotation were performed (Fig. 1).7, 10 Eight patterns of redirection with different combinations of LCEA and ACEA were also performed, as follows: LCEAs of 20°, 25°, and 30° combined with ACEAs of 45°, 50°, and 55°.

ROM Simulation
Maximal flexion, extension, external rotation, and internal rotation at 90° of flexion were measured in each patient model after virtual RAO by collision detection of the pelvis and femur models (Fig. 2). Additionally, two motion patterns corresponding to the anterior and posterior impingement tests were evaluated. For the anterior impingement test, maximal internal rotation was measured in 10° increments between 80° and 110° of flexion and 0° and 20° of adduction. For the posterior impingement test, maximal external rotation was measured in 10° increments between 0° and 30° of extension and 0° and 20° of adduction.

Impingement type was specified as intra- or extra-articular impingement according to the location of the impingement. Impingement between the rim and neck was defined as intra-articular impingement, and that between all other anatomical areas was defined as extra-articular impingement.11
Statistical Analysis
Statistical comparisons of the morphological parameters of the femur and ROMs were made between the normal group and the RAO group with several combinations of LCEAs and ACEAs using the Mann–Whitney U-test. The chi-square test or Fisher's exact test was used to detect differences in the prevalence of intra- and extra-articular impingement. Reproducibility of setting for femoral head coverage was tested. The lateral rotation angle to achieve an LCEA of 30° and the sagittal rotation angle to achieve an ACEA of 55° after lateral rotation in all cases were independently measured by two observers to assess inter-observer reproducibility. The first observer measured each angle again 12 weeks later to assess intra-observer reproducibility. The inter- and intra-observer reproducibilities were assessed according to the Bland and Altman method. This method calculates 95% limits of agreement (LOA).12
Evidence level: 3.
RESULTS
Hip ROMs of the DDH group before RAO, after RAO with an LCEA of 30°, and an ACEA of 55° and of the normal control group are shown in Table 1. Maximal flexion, extension, and internal rotation at 90° flexion after RAO decreased significantly from before RAO. Maximal flexion after RAO became 8° smaller than the normal group on average, and maximal flexion was significantly smaller than that of the normal group. Rim-neck impingement became the main impingement pattern, as in the normal group. Maximal extension after RAO was still 7° larger than that of the normal group on average. To obtain an ACEA of 55° after lateral rotation of the acetabulum that gave an LCEA of 30°, the required sagittal rotation of the acetabulum ranged from 24° anteriorly to 17° posteriorly; 29 hips (56%) needed posterior rotation.
| Before RAO | After RAO | Normal | p-Value* | p-Value** | ||||
|---|---|---|---|---|---|---|---|---|
| Mean flexion (°) (range) | 130.5 | (103.0–153.0) | 120.8 | (95.0–141.0) | 129.2 | (113.5–146.5) | < 0.001 | < 0.001 |
| No. of intra-articular impingements (%) | 18 | (35%) | 45 | (87%) | 58 | (79%) | < 0.001 | 0.43 |
| No. of extra-articular impingements (%) | 34 | (65%) | 7 | (13%) | 15 | (21%) | ||
| Mean extension (°) (range) | 65.3 | (18.0–146.0) | 57.8 | (32.0–90.0) | 50.6 | (0.5–95.0) | < 0.05 | < 0.05 |
| No. of intra-articular impingements (%) | 52 | (100%) | 51 | (98%) | 73 | (100%) | N.A. | N.A. |
| No. of extra-articular impingements (%) | 0 | (0%) | 1 | (2%) | 0 | (0%) | ||
| Mean external rotation (°) (range) | 34.6 | (7.5–68.0) | 34.6 | (7.5–68.0) | 35.3 | (0.5–67.5) | 0.11 | 0.76 |
| No. of intra-articular impingements (%) | 0 | (0%) | 5 | (10%) | 44 | (60%) | N.A. | p < 0.001 |
| No. of extra-articular impingements (%) | 52 | (100%) | 47 | (90%) | 29 | (40%) | ||
| Mean internal rotation at 90° flexion (°) (range) | 74.0 | (36.0–109.0) | 51.5 | (8.0–82.0) | 49.6 | (27.5–80.5) | < 0.001 | 0.44 |
| No. of intra-articular impingements (%) | 49 | (94%) | 51 | (98%) | 71 | (97%) | 0.61 | 0.77 |
| No. of extra-articular impingements (%) | 3 | (6%) | 1 | (2%) | 2 | (3%) | ||
- N.A. indicates date cannot be analyzed statistically by χ-square analysis.
- * Comparison between before RAO and after RAO.
- ** Comparison between normal group and after RAO.
Hip ROMs after RAO with nine patterns of femoral head coverage compared to ROMs in the normal group are shown in Table 2. Maximal flexion was significantly smaller than that of the normal group after RAO with an LCEA of 30° and an ACEA of 55°, RAO with an LCEA of 30° and an ACEA of 50°, RAO with an LCEA of 25° and an ACEA of 55°, and RAO with an LCEA of 20° and an ACEA of 55°. On the other hand, maximal flexion was significantly larger than that of the normal group after RAO with an LCEA of 20° and an ACEA of 45°. Maximal extension was significantly larger than that of the normal group after RAO with LCEAs of 20°, 25°, or 30° combined with an ACEA of 55°. No significant differences were seen in maximal external rotation. Maximal internal rotation at 90° of flexion was significantly larger than that of the normal group after RAO, except after RAO with an LCEA of 30° and an ACEA of 55°.
| Lateral CEA | |||||||||
|---|---|---|---|---|---|---|---|---|---|
| 20° | 25° | 30° | |||||||
| Anterior CEA | |||||||||
| 45° | Flex | 132.8° ± 8.6° | * | Flex | 130.1° ± 7.8° | Flex | 128.3° ± 7.2° | ||
| Ext | 50.0° ± 15.6° | Ext | 49.3° ± 14.5° | Ext | 47.8° ± 14.0° | ||||
| ER | 34.1° ± 12.2° | ER | 33.9° ± 12.2° | ER | 34.3° ± 12.3° | ||||
| IR@90flex | 68.2° ± 13.1° | * | IR@90flex | 62.9° ± 12.7° | * | IR@90flex | 58.2° ± 13.1° | * | |
| 50° | Flex | 128.8° ± 8.6° | Flex | 126.5° ± 8.1° | Flex | 124.7° ± 7.9° | ** | ||
| Ext | 55.0° ± 15.5° | Ext | 54.3° ± 14.5° | Ext | 52.4° ± 14.0° | ||||
| ER | 34.2° ± 12.2° | ER | 34.6° ± 12.3° | ER | 34.2° ± 12.3° | ||||
| IR@90flex | 65.3° ± 12.9° | * | IR@90flex | 60.3° ± 12.9° | * | IR@90flex | 55.3° ± 12.9° | * | |
| 55° | Flex | 124.9° ± 9.0° | ** | Flex | 122.9° ± 9.0° | ** | Flex | 120.8° ± 8.5° | ** |
| Ext | 60.0° ± 15.5° | * | Ext | 59.3° ± 14.5° | * | Ext | 57.8° ± 14.0° | * | |
| ER | 34.9° ± 12.3° | ER | 35.4° ± 12.4° | ER | 34.6° ± 12.3° | ||||
| IR@90flex | 61.5° ± 12.9° | * | IR@90flex | 56.5° ± 12.9° | * | IR@90flex | 51.5° ± 12.9° | ||
- Flex 129.1° ± 8.6°; Ext 50.6° ± 19.0°; ER 35.3° ± 13.8°; IR@90Flex 49.6° ± 13.0°. Asterisks (*) show the ROM of the RAO group was significantly greater than that of the control group. Double-asterisks (**) show the ROM of the RAO group was significantly reduced compared with that of the control group.
In the anterior impingement test simulation, maximal internal rotation at 110° flexion with 20° adduction after RAO with an LCEA of 30° and an ACEA of 55° became significantly smaller than that of the normal group (Fig. 3). However, the other composite movements for the anterior impingement test did not show significant differences between the normal group and the DDH group after RAO with an LCEA of 30° and an ACEA of 55°. There were also no significant differences in maximal internal rotation at any combination of flexion and adduction after RAO with the other eight patterns of acetabular rotation.

In the posterior impingement test simulation, the maximal external rotation at 30° extension with 0° adduction after RAOs with the nine patterns of acetabular reorientation was significantly smaller than that of the normal group (Fig. 4). There were no significant differences in the maximal external rotation at the other combinations of extension and adduction between the normal group and the DDH group after RAOs with the nine patterns of acetabular reorientation.

The DDH group showed significantly greater alpha angle and femoral anteversion than the normal group (Table 3). One hip in the DDH group (1.9%) had an alpha angle of more than 55°. Nine hips in the DDH group (17%) had femoral anteversion of more than 50°. Differences and LOAs for lateral and sagittal rotation angles aiming for fixed targeted coverage of the femoral head with intra-observer and inter-observer reproducibilities are shown in Table 4.
| DDH | Normal | p-Value* | |
|---|---|---|---|
| Femoral anteversion (°) | 35.8 (4.0–66.0) | 25.1 (1.0–47.5) | < 0.01 |
| Alpha angle (°) | 38.5 (31.0–59.0) | 35.4 (27.5–47.5) | < 0.01 |
| Neck shaft angle (°) | 126.0 (114.0–139.0) | 125.6 (113.1–137.0) | 0.66 |
- * Mann–Whitney U-test.
| Intra-Observer | Inter-Observer | |||
|---|---|---|---|---|
| Mean Difference | 95% LOA | Mean Difference | 95% LOA | |
| Lateral rotation angle (°) | − 0.1 | − 1.6–1.5 | − 0.51 | − 4.1–3.0 |
| Sagittal rotation angle (°) | 0.2 | − 2.2–2.7 | 1.1 | − 3.2–5.4 |
DISCUSSION
In DDH, increased coverage of the femoral head after RAO reduces flexion and internal rotation of hip ROM, and excessive anterior rotation of the acetabulum may lead to anterior FAI. No reports have analyzed the effect of postoperative femoral head coverage on ROM after RAO. This is the first study to have analyzed hip ROM until bony impingement after RAO with several combinations of lateral and anterior rotations of the acetabulum.
This study had a number of limitations. First, medialization of the acetabulum, which is often performed with rotation of the acetabulum in RAO according to the degree of subluxation, was not considered. This could change the location of extra-articular impingement and alter ROM. Second, asphericity of the femoral head and acetabulum, joint instability, and movement of the rotational center in DDH were not considered, even though an inclusion criterion for our study group was similar to the practical indication for RAO, and subjects with an aspherical femoral head or joint incongruency were excluded. Third, the present study analyzed only bony impingement without considering the soft tissue structures. For anterior impingement motions, ROM is generally defined with bony impingement.13 Simulated ROM is overestimated by approximately 3° with a similar methodology.14 Fourth, the subjects of the present study were exclusively female. Analysis of males could result in different conclusions. Fifth, the control group was much older than the DDH group. The pelvis tends to tilt backward with degenerative changes in the spine,15 which may have affected the results of the analysis of hip ROM in the normal group. However, no subjects in the normal group showed atypical backward tilt of the pelvis. Therefore, despite their old age, the normal group was appropriate as a control in providing normal ROM.
After RAO with an LCEA of 30° and an ACEA of 55° producing femoral head coverage similar to that of the normal group, the maximal flexion and the maximal internal rotation at 110° flexion with 20° adduction were significantly smaller than those of the normal group. Postoperative clinical ROM can be further aggravated by restriction resulting from the surrounding tissue after surgery compared with simulated ROM. We should avoid overcoverage of the femoral head compared with the normal hip during RAO. In order to achieve hip ROMs after RAO similar to those of the normal group, an LCEA of 30° with an ACEA of 45°, an LCEA of 25° with an ACEA of 45° to 50°, and an LCEA of 20° with an ACEA of 50° were the preferred angles to target, even though they provided smaller coverage than that of normal hips.
Target coverage for the femoral head after RAO remains controversial. In a previous study of failure after periacetabular osteotomy, a postoperative LCEA of less than 30° or more than 40° was identified as a predictor of conversion to total hip arthroplasty, with a hazard ratio of 2.0.16 Another study identified an LCEA of less than 22° as a predictor of radiographic progression of osteoarthritis with a hazard ratio of 2.2.17 In the natural course of DDH, subjects with an LCEA of less than 25° have a 4.3-fold increased risk of a more than 1-mm decrease in joint space width compared to subjects without DDH.18 Another study showed that no patient in whom the hip functioned well until the age of 65 years had an LCEA of less than 16°.19 These studies suggest that we should not reduce the target LCEA to less than 20° after RAO.
In the present study, the ACEA was measured on the sagittal view of CT images through the femoral head center as a parameter of anterior femoral head coverage instead of the vertical–center–anterior angle on false-profile radiographic views.20 The ACEA in subjects with normal hips was approximately 55°, which was similar to that reported in previous studies.7, 10 In this study group, only lateral rotation of the acetabulum to achieve an LCEA of 30° resulted in larger anterior coverage than an ACEA of 55° in half of the DDH cases. To achieve a constant ACEA after RAO, anterior-to-posterior rotation of the acetabulum of 40° was needed, because acetabular deficiency in DDH shows a variable pattern of anterior and lateral coverage.
Although the acetabula were accurately re-oriented to achieve anterior and lateral coverage similar to that in normal hips, simulated ROMs after RAO became smaller than those of normal hips. This variability of femoral anteversion and neck–shaft angle in DDH could be attributed to the differences in ROM after RAO with fixed target coverage.21, 22 Furthermore, the unique shape of the acetabular rim near the anterior inferior iliac spine in DDH and the smaller head–neck ratio in DDH than normal hips23, 24 may play roles in reducing maximal flexion after acetabular rotation. In the present study, the mean alpha angle in Japanese DDH subjects was 38.5°, which was smaller than the previously reported mean alpha angle of 75.1° in Caucasian DDH patients.23 Cam deformity was not as common in Japanese DDH patients as in Caucasian DDH patients, which is consistent with previous reports.7, 25 In the present study, cam deformity may have affected ROM less than in Caucasian DDH patients. Because the anatomical parameters of the femur and pelvis can affect ROM after RAO, further study to elucidate the morphological factors of the femur and pelvis correlating with ROM after RAO would be of value to prevent reduced hip ROM after RAO.
In conclusion, after RAO with an LCEA of 30° and an ACEA of 55°, which produces femoral head coverage similar to that of the normal group, the maximal flexion and the maximal internal rotation at 110° flexion with 20° adduction were significantly smaller than those of the normal group. We should avoid overcoverage of the femoral head compared with the normal hip during RAO.
AUTHORS’ CONTRIBUTIONS
Drafting the article critically for important intellectual content: all authors. Final approval of the version to be submitted: all authors. Study conception and design: Hidetoshi Hamada, Masaki Takao, and Nobuhiko Sugano. Acquisition of data: all authors. Analysis and interpretation of data: Hidetoshi Hamada, Masaki Takao, and Nobuhiko Sugano.