Zonal differences in meniscus MR relaxation times in response to in vivo static loading in knee osteoarthritis
ABSTRACT
This study assessed the effects of static loading on MRI relaxation times of menisci in individuals with and without radiographic knee OA. High-resolution fast spin-echo (FSE) and T1ρ/T2 relaxation time MR sequences were obtained with and without loading at 50% body weight in 124 subjects. T1ρ/T2 relaxation times were calculated in menisci, and meniscus lesions were assessed through clinical grading. Student's t-test compared OA and control unloaded relaxation times as well as within-group changes with loading, Generalized Linear Models evaluated zonal variation, and ANCOVA compared loading response between groups. Unloaded T1ρ and T2 in the middle and inner zones of the lateral anterior horn and outer zone of the medial posterior horn were significantly higher in OA and suggest that meniscal OA change occurs unevenly. Zonal T1ρ and T2 showed differing patterns between anterior and posterior horns, suggesting differences in macromolecular organization. Significant increases with loading were seen largely in the T2 of controls and less frequently in subjects with OA. In the medial posterior horn, T1ρ and T2 decreased with loading in OA but changed negligibly in controls; these significantly different loading responses between groups may indicate load transmission failure in OA menisci. © 2015 Orthopaedic Research Society. Published by Wiley Periodicals, Inc. J Orthop Res 34:249–261, 2016.
Knee menisci are vital to the health of the joint, aiding joint stability, assisting with load distribution, and reducing friction between articular surfaces.1 Meniscal injury or degeneration disrupts this ordered structure and may play a role in the initiation of knee osteoarthritis (OA).2-9 Meniscal fibrocartilage is largely composed of type I collagen and a small percentage of proteoglycans (PG) embedded within the dense collagen matrix.1 Quantitative T1ρ and T2 magnetic resonance (MR) relaxation time sequences provide non-invasive means to evaluate the macromolecular composition of the knee meniscus in health and disease. In articular cartilage, T1ρ relaxation times have shown associations with PG content, while T2 relaxation times have been associated with collagen integrity.10, 11 Previous studies have demonstrated significantly elevated meniscus T1ρ and T2 with increasing OA severity and with meniscus lesions.12, 13 Our previous work on loading in articular cartilage has revealed significant differences in the response of relaxation times to load transmission in subjects with OA.14, 15 Given the vital role of the meniscus in healthy knee function, understanding the role of the meniscus in OA development is just as important. In vivo loaded knee imaging allows real-time assessment of meniscus function and can potentially help characterize early degeneration.
It is also important to investigate zonal responses to load due to the heterogeneous composition of the meniscus. The medial and lateral menisci are asymmetrical, with different biomechanical properties. For instance, the medial meniscus is less mobile16, 17 and hence more prone to tears.18, 19 The menisci also have compositional circumferential divisions, i.e., the inner, middle, and outer zones. The thick, vascularized outer border of the meniscus is largely composed of circumferential collagen fibers that experience tensile “hoop” stresses with loading, while the tapered, avascular inner edge features higher PG content.20, 21
One recent study on a different patient population assessed the effects of loading on the radial zones of the meniscus.22 However, this study included a small number of subjects (n = 30) and only evaluated the changes with loading in the meniscal body. The effect of in vivo loading on the meniscus horns using T1ρ and T2 relaxation times has not yet been evaluated. Meniscal tears are most commonly seen in the posterior horns, particularly the medial posterior horn.23-25 Since meniscus pathology is strongly associated with OA progression, understanding the response of the meniscal horns to loading can provide a more complete perspective on meniscus function in people with and without knee OA.
Hence, our primary objectives were to evaluate differences in T1ρ and T2 relaxation times of meniscus horns and zones in subjects with OA compared to controls, to identify trends in zonal variation between and within the meniscus horns, and to compare the changes in T1ρ and T2 relaxation times with static loading in the zones of the meniscus horns in individuals with and without radiographic OA. We hypothesized that the OA subjects will show greater prevalence of meniscus lesions and higher T1ρ and T2 relaxation times than controls in the posterior horns, that the medial and lateral menisci will demonstrate different zonal patterns with regards to T1ρ and T2, and that the difference in response to loading between OA and controls will be most pronounced in the posterior horns, particularly the medial posterior horn.
MATERIALS AND METHODS
Subjects
For this Level III Case-Control study, 124 subjects older than 35 years were recruited from the community. To determine presence and severity of OA, all subjects underwent bilateral weight-bearing, fixed-flexion postero-anterior knee X-ray with a Synaflexer device (Synarc, Newark, CA). A radiologist with more than 20 years of experience in musculoskeletal imaging (TML) performed Kellgren-Lawrence scoring of the tibio-femoral compartment from these radiographs.26 Inclusion criteria for OA patients were: age >35 years, knee symptoms consistent with OA such as pain, aching, or stiffness on most days per month during the past year, or use of medication for knee pain on most days per month during the past year, and definite radiographic evidence of knee OA (Kellgren-Lawrence score >1).
Inclusion criteria for controls were: age >35 years, lack of OA symptoms in either knee, and minimal to no radiographic evidence of OA (Kellgren-Lawrence score ≤ 1) on either knee. Exclusion criteria for all subjects were: (i) concurrent use of an investigational drug; (ii) history of intra-articular fracture or surgery in the study knee; (iii) contraindications to MRI. Of the 124 subjects, 85 were in the control group and 39 were in the OA group. All subjects signed a written informed consent form approved by the University of California, San Francisco Committee on Human Research.
MR Imaging
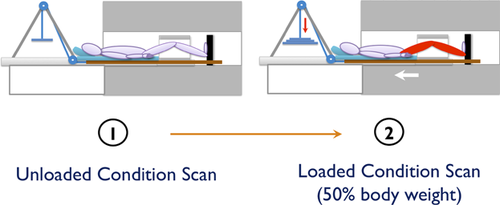
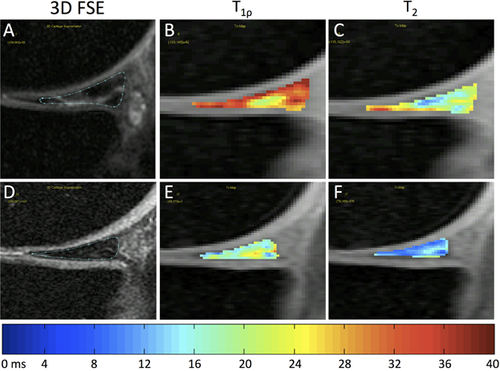
All knee studies were acquired on a 3-T GE MR 750w Scanner (General Electric, Milwaukee, WI) using an eight-channel knee coil (Invivo, Orlando, FL) and an MR-safe loading apparatus. For OA subjects, the knee with more severe findings on the radiographs was imaged; if the KL grade was the same for both knees, the more symptomatic knee was imaged. Control subjects chose the knee to be imaged. All subjects were positioned supine with their knee in neutral rotation and full extension. To reduce movement, the foot of the subject was secured in place, the study knee was stabilized with padding, and a belt was secured across the patient's waist. Images were acquired from one knee under two conditions: unloaded imaging (after a period of 45 min of non-weight-bearing), and loaded imaging at 50% body weight. Subjects arrived at the imaging center and were unloaded (seated in a chair) for a 45 min period, after which the following sequences were acquired: (i) a high-resolution 3D fast spin-echo (FSE) CUBE sequence for meniscus grading and segmentation; (ii) the T1ρ relaxation time sequence; (iii) the T2 relaxation time sequence. Sequence parameters are detailed in Table 1. Next, a load equivalent to 50% of the subject's body weight was applied to the foot using MRI compatible weights and a pulley system built into the loading device in order to simulate static standing (Fig. 1). The same three sequences described above were then acquired after a period of 10 min. Prospective registration algorithms were used to ensure similar field of view between the unloaded and loaded scans.27
| Sequence | Parameters | Purpose |
|---|---|---|
| High-resolution 3D fast spin-echo CUBE sequence | Repetition time (TR)/echo time (TE) = 1500/26.69 ms, field of view = 14 cm, matrix = 384 × 384, slice thickness = 0.5 mm, echo train length = 32, bandwidth = 50.0 kHz, number of excitations (NEX) = 0.5,acquisition time = 10.5 min | Meniscus grading and segmentation |
| T1ρ relaxation time sequence | TR/TE = 9/2.6 ms, time of recovery = 1500 ms, field of view = 14 cm, matrix = 256 × 128, slice thickness = 4 mm, bandwidth = 62.5 kHz, time of spin-lock (TSL) = 0/2/4/8/12/20/40/80 ms, frequency of spin-lock = 500 Hz, acquisition time = 11 min | T1ρ relaxation time quantification |
| T2 relaxation time sequence | Same as the T1ρ quantification except for magnetization preparation TE = 0/1.8/3.6/7.3/14.5/29.1/43.6/58.2, acquisition time = 11 min | T2 relaxation time quantification |
MR Analysis: Quantitative
The high-resolution 3D FSE images were rigidly registered to the first echo of T1ρ images and used to segment the anterior and posterior horns of the lateral and medial menisci using in-house software developed with Matlab (Mathworks, Natick, MA). For each region of interest, equal numbers of slices were segmented on both unloaded and loaded images from each subject. In addition, the segmentations were divided into outer, middle, and inner zones with Matlab-based software. Each zone was defined as 1/3 of the anterior-posterior length of the segmented meniscus horn on each slice (Fig. 2). The outer zone roughly corresponded to the highly vascularized “red” zone of the meniscus, the inner zone roughly corresponded to the avascular “white” zone, and the middle zone corresponded to the transitional “red-white” zone.
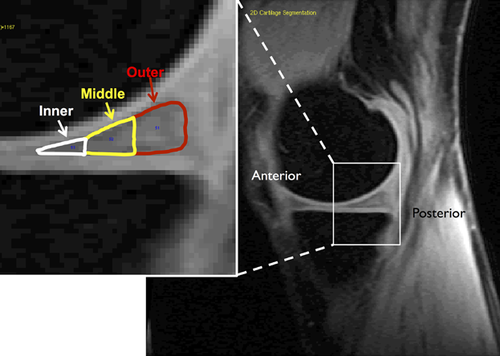


The meniscus horn segmentations were overlaid onto the registered T1ρ and T2 maps (Fig. 1). Stringent quality control was implemented, as the regions of interest were manually adjusted in order to avoid synovial fluid or surrounding anatomy. To eliminate artifacts due to partial volume effects with synovial fluid, voxels with relaxation time >40 ms on both T1ρ and T2 maps were excluded from the data. Mean T1ρ and T2 values were calculated for whole meniscal compartments and for the outer, middle, and inner zones of each compartment.
MR Analysis: Morphological
Meniscus pathology was graded on the 3D FSE CUBE images by a radiologist with over 5 years of experience with musculoskeletal MRI (LN) using a 5-point modified Whole Organ Magnetic Resonance Imaging Score (mWORMS) system: Grade 0: no lesion; Grade 1: intrasubstance abnormalities; Grade 2: non-displaced tear; Grade 3: displaced or complex tear without deformity; Grade 4: maceration of the meniscus.28 An mWORMS meniscus grade >1 indicated the presence of a meniscal tear. The type of meniscal tear (horizontal, oblique, complex, etc.) was also recorded.
Statistical Analysis
Fisher's exact test was used to compare the prevalence of definite meniscus lesions between OA and control groups in all four meniscus compartments, and a chi-squared test was used to compare gender distribution between groups. Student's t-tests were used to compare age, BMI, and T1ρ and T2 times between the unloaded and loaded conditions within groups. Student's t-tests adjusted for age, gender, and BMI were used to compare unloaded T1ρ and T2 times between the OA and control groups in whole meniscus compartments and in meniscus zones. Age was included in the analysis since it was significantly different between groups; BMI was included because the difference between groups approached significance. Though gender was not different between groups, it was included in the statistical analysis because knee OA is more prevalent in women than men. Zonal differences within OA and control groups were evaluated using generalized linear models (GLMs). Data showed non-normal distributions based upon Shapiro-Wilk tests and were log-transformed prior to GLM analysis. Zone, age, gender, and BMI were analyzed as factors. Analysis of covariance (ANCOVA) with age, gender, and BMI as covariates was used to compare response to loading (Condition) in the whole-compartment and zonal T1ρ and T2 between the OA and control groups (Group). All statistical analyses were performed using JMP statistical software (SAS Institute, Cary, NC) with an alpha level of p < 0.05.
RESULTS
Subject Characteristics
Age was significantly different between the two groups and the difference in BMI between Control and OA approached significance; patient characteristics are shown in Table 2.
| Variable | Control (n = 85) Mean ± Std. Dev. | OA (n = 39) Mean ± Std. Dev. | P |
|---|---|---|---|
| Age (yrs) | 49.6 ± 9.3 | 56.7 ± 9.2 | 0.0001 |
| BMI (kg/m2) | 24.0 ± 3.4 | 25.2 ± 3.8 | 0.081 |
| Gender (M:F) | 35:50 | 14:25 | 0.577 (per χ2-test) |
- Bold text indicates p < 0.05; italicized text indicates 0.10 < p < 0.05.
Grading of Meniscus Lesions
Meniscal tears (mWORMS grades >1) in the medial posterior horn were significantly more prevalent in the OA group (n = 19, 48.7%) as compared to controls (n = 7, 8.2%; p < 0.0001; Table 3). Lesions in the lateral anterior horn were more prevalent in the OA group (n = 2, 5.1%) compared to controls (n = 0); this finding approached significance (p = 0.097; Table 3). The distribution of meniscus lesions by type in the various compartments as well as in the OA and Control groups is shown in Table 4.
| Compartment | Group | mWORMS 0–1 Number (%) | mWORMS 2–4 Number (%) | P (Fisher's Exact Test) |
|---|---|---|---|---|
| Lateral Anterior Horn | Control | 85 (100%) | 0 (0%) | 0.097 |
| OA | 37 (94.9%) | 2 (5.1%) | ||
| Lateral Posterior Horn | Control | 76 (89.4%) | 9 (10.6%) | 0.263 |
| OA | 32 (82.0%) | 7 (18.0%) | ||
| Medial Anterior Horn | Control | 84 (98.8%) | 1 (1.2%) | 0.233 |
| OA | 37 (94.9%) | 2 (5.1%) | ||
| Medial Posterior Horn | Control | 78 (91.8%) | 7 (8.2%) | <0.0001 |
| OA | 20 (51.3%) | 19 (48.7%) |
- Bold text indicates p < 0.05; italicized text indicates 0.10 < p < 0.05.
| Compartment | Group | Subjects With Lesions | Horizontal Tear | Oblique Tear | Other Simple Tear Without Deformity | Complex Tear Without Deformity | Complex Tear With Deformity | Maceration |
|---|---|---|---|---|---|---|---|---|
| Lateral Anterior Horn | Control | 0 | 0 | 0 | 0 | 0 | 0 | 0 |
| OA | 2 | 0 | 0 | 0 | 2 | 0 | 0 | |
| Lateral Posterior Horn | Control | 9 | 1 | 1 | 3 | 2 | 2 | 0 |
| OA | 7 | 0 | 0 | 1 | 2 | 3 | 1 | |
| Medial Anterior Horn | Control | 1 | 0 | 0 | 1 | 0 | 0 | 0 |
| OA | 2 | 0 | 0 | 1 | 1 | 0 | 0 | |
| Medial Posterior Horn | Control | 7 | 4 | 0 | 2 | 1 | 0 | 0 |
| OA | 19 | 0 | 0 | 3 | 5 | 5 | 6 |
Zonal Differences in Unloaded T1ρ and T2 within Groups
In all four meniscus horns of the control and OA groups, the T1ρ values in the middle zone were the lowest of the three zones. For both OA and control subjects, T1ρ in the middle zone was significantly lower than the inner zone (p < 0.05) in the medial anterior horn, lateral posterior horn, and medial posterior horn (Fig. 3). The T1ρ in the middle zone was lower than the outer zone (p < 0.05) in the medial anterior horn for both control and OA, and in the lateral anterior horn of the control group (Fig. 3). The outer zone T1ρ was lower than the inner zone (p < 0.05) in the lateral posterior horn for both control and OA, and medial posterior horn for OA (Fig. 3).
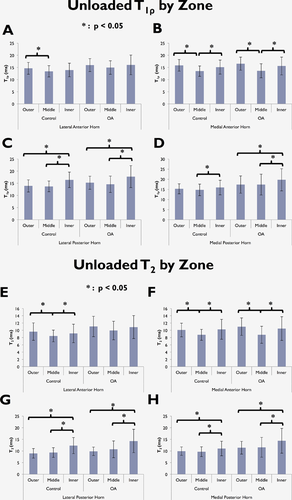
Similar to T1ρ, with the exception of the lateral anterior horn in OA individuals, T2 in the middle zone was significantly lower than the inner zone in all compartments for both OA and control groups (all p ≤ 0.040, Fig. 3). Additionally, T2 in the middle zone was lower than outer zone (p < 0.05) in both control and OA in the medial anterior horn, and for the control only in the lateral anterior horn (Fig. 3). The outer zone T2 was lower than the inner zone (p < 0.05) in the medial and lateral posterior horns for both control and OA (Fig. 3).
Group Differences in Unloaded T1ρ and T2 in the Meniscus Horns
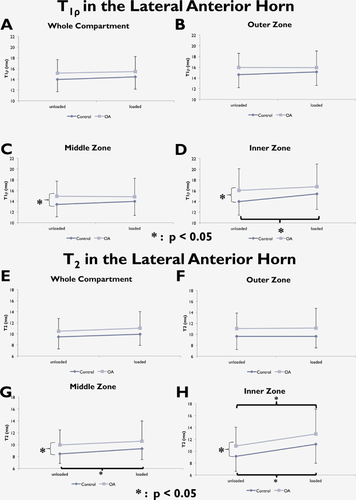
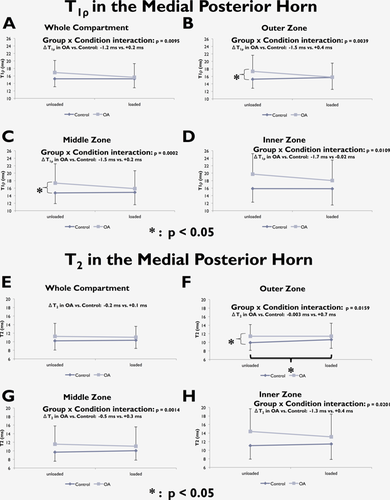
Zonal analyses showed that the OA group had higher T1ρ and T2 in the middle and inner zones of the lateral anterior horn (for T1ρ: p = 0.024 in middle zone, p = 0.016 in inner zone; for T2: p = 0.0078 in middle zone, p = 0.016 in inner zone; Fig. 4). In the medial posterior horn, both T1ρ and T2 in the OA group were significantly higher in the outer zone (for T1ρ: p = 0.029; for T2: p = 0.0078, Fig. 5), and T1ρ for the OA group was significantly higher in the middle zone (p = 0.013, Fig. 5).
Changes in T1ρ and T2 with Loading
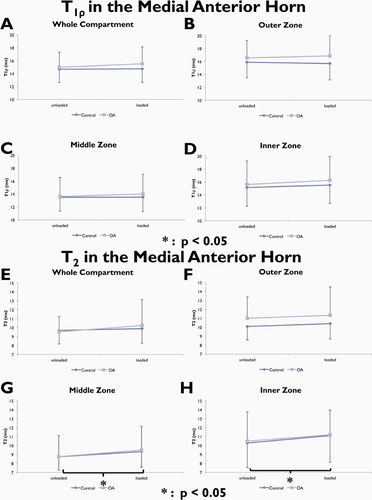
When considering the main effect of loading, there were no significant differences in whole compartment T1ρ or T2 with loading in either group. Zonal analyses showed a significant T1ρ increase with loading in the inner zone of the lateral anterior horn of controls (p = 0.0030). Zonal analysis of T2 revealed significant increases with loading in the middle and inner zones of both medial and lateral anterior horns in controls [lateral anterior horn: p = 0.002 (middle), p < 0.001 (inner); medial anterior horn: p = 0.028 (middle), p = 0.008 (inner), Fig. 4 and Fig. 6], the inner zone of the lateral anterior horn in OA subjects (p = 0.026, Fig. 4), and the outer zone of the medial posterior horn in controls (p = 0.007; Fig. 5).
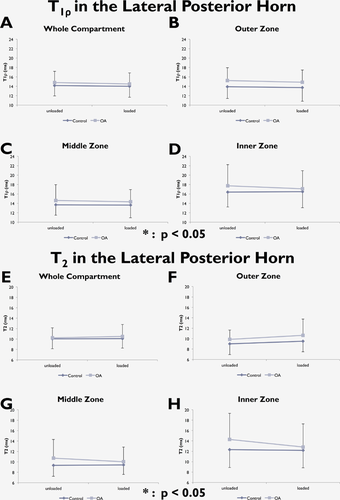
A significant “Group x Condition” interaction was observed in whole compartment analysis of T1ρ in the medial posterior horn. Loading had a different effect on T1ρ and T2 in subjects with OA than it did for controls. The OA group showed a decrease in T1ρ, while the control group showed minimal change (ΔT1ρ in Control = +0.2 ms, in OA = −1.2 ms; p = 0.0095; Fig. 5). This interaction was also observed for all three zones of the medial posterior horn (ΔT1ρ outer zone: Control = +0.4 ms, OA = −1.5 ms, p = 0.0039. ΔT1ρ middle zone: Control = +0.2 ms, OA = −1.5 ms, p = 0.0002. ΔT1ρ inner zone: Control = −0.02 ms, OA = −1.7 ms, p = 0.0109; Fig. 5). There was an increase in medial posterior horn T2 in all three zones with loading in controls but a decrease in OA (ΔT2 outer zone: Control = +0.7 ms, OA = −0.003 ms, p = 0.0159. ΔT2 middle zone: Control = +0.3 ms, OA = −0.5 ms, p = 0.0014. ΔT2 inner zone: Control = +0.4 ms, OA = −1.3 ms, p = 0.0201; Fig. 5). No significant results were observed in the Lateral Posterior Horn (Fig. 7).
DISCUSSION
This study investigated the effects of loading on the T1ρ and T2 relaxation times of the meniscus horns and their radial zones in individuals with OA and controls. In our cohort, meniscus tears of the medial posterior horn were more prevalent in the OA group and a similar close to significance trend was observed for the lateral anterior horn (Table 3). These clinical observations are supported by the results from quantitative T1ρ and T2 relaxation time mapping. We observed that the T1ρ and T2 values were significantly elevated in the outer zone of the medial posterior horn and the middle and inner zones of the lateral anterior horn in individuals with knee OA compared to controls. Elevated T1ρ and T2 values indicate increased motion of water molecules, suggesting disrupted or degraded proteoglycan and collagen structure in the OA meniscus.12 Our finding also complements a prior study of zonal differences in the meniscus body, suggesting that osteoarthritic change occurs unevenly in the meniscus, affecting some zones and compartments earlier or more severely than others.22
When considering within-group zonal comparison in the unloaded condition, similar trends were observed between T1ρ and T2 measurements as well as between OA and control groups in the medial anterior, lateral posterior, and medial posterior horns. For both OA and controls, the lateral and medial posterior horns showed higher T1ρ and T2 in the inner zone compared to the middle and outer zones; similar results were found in the meniscus body by Subburaj et al.22In contrast, the medial anterior horn shows lower T1ρ and T2 in the middle zone compared to the outer and inner zones for both OA and controls. These differing patterns remain consistent regardless of OA presence or imaging parameter. In an ex vivo study of the medial meniscus, Sweigart et al. reported that the anterior horn was stiffer than the posterior horn.29 This variation, according to Fithian et al. was not attributed to compositional differences between meniscus regions, but rather differences in macromolecular organization such as collagen ultrastructure and possible collagen cross-linking.30 While our observed zonal T1ρ and T2 distinctions in the lateral posterior horn remain consistent between OA and controls, the OA fibrocartilage in the lateral anterior horn loses the zonal T1ρ and T2 distinction found in controls. Further study is necessary to explain how the lateral anterior horn more readily acquires these changes with OA.
Significant zonal increases with loading were observed mostly in controls rather than OA individuals. Elevated values with loading in the meniscus were also observed by Subburaj et al. and are contrary to trends found in articular cartilage.14, 22, 31 Fithian et al. reported that the interaction of negatively-charged proteoglycans with fluid cations helps create an environment allowing the tissue to resist compression and take in fluid.30 The influx of fluid into the tissue during loading thus contributes to increases in meniscus relaxation time. Furthermore, these significant changes were observed more frequently in the T2 values. Prior studies have associated T2 relaxation time with collagen orientation in articular cartilage, and the observed changes may underscore the role of collagen in generating circumferential hoop stresses when resisting load. While proteoglycans contribute to load resistance due to their physicochemical properties, electron microscopy has detected numerous points of interaction between collagen and proteoglycan in the tissue.32 Also, the abundance of collagen relative to proteoglycan in meniscus tissue may contribute to the significant effects on T2 relaxation time.1
We observed that loading had a different effect on T1ρ and T2 in the medial posterior horn of menisci of subjects with OA than it did for controls. The control group showed negligible change in T1ρ and T2 with loading whereas the OA group showed a decrease. Biomechanical studies have shown that the medial posterior horn experiences greater axial compression with loading than the medial anterior horn, and that the posterior horn and root of the medial meniscus experience increased force compared to other regions of the meniscus during loaded conditions.33-35 The medial posterior horn in a meniscus with insufficient collagen and PG structure would experience an even greater extent of compression and strain than normal. In addition, Wenger et al. describe significant changes in extrusion and shape of the meniscus body with loading in OA subjects compared to controls. The authors of that study propose that the medial meniscus in the loaded OA knee is not only squeezed axially, but also toward the joint capsule due to loss of hoop tension caused by a meniscal tear.36 We speculate that the same phenomenon is occurring in the medial posterior horn of our OA subjects, and that water escapes the osteoarthritic medial posterior horn as it fails to resist and transmit load appropriately, resulting in the observed T1ρ and T2 decrease (Fig. 5).
There are some limitations to our study. We include very few subjects with KL 4 due to the difficulties of delineating the highly degraded knee anatomy of individuals with advanced OA. As a result, the OA values reported are more indicative of moderate OA. Due to the large disparity in sample size between those with and without meniscus lesions of mWORMS Grade 2–4 in this study, it is doubtful in our opinion that statistical comparisons stratified by presence or absence of meniscus lesion would be meaningful in most cases (Table 3). However, the OA group had roughly equal distribution of subjects with lesions of the medial posterior horn (n = 19) and without (n = 20). When comparing these two sub-groups, we found significantly greater T1ρ and T2 in the whole medial posterior horn and zones (all p < 0.0002 for T1ρ, all p < 0.0018 for T2) in subjects with lesions, illustrating the effect of meniscus tears upon local relaxation time (Fig. 8).
There were also some controls (15 subjects) with mWORMS > 1 meniscus lesions, which could also serve as a confounding factor. Excluding these subjects from the statistical analysis reduced the standard deviations of the control group; however, the vast majority of the results remained similar, with the exception of whole-compartment T1ρ and T2 of the medial posterior horn. The differences between OA and control subjects were statistically significant in the whole medial posterior horn (p = 0.0095 for T1ρ, p = 0.0420 for T2), whereas these differences were not significant when considering the complete control cohort.
Due to the slice thickness of the sagittal sequences used, the meniscus body was not visible for all subjects and was not quantified. During loaded imaging, subjects supported 50% of their body weight. Subjects likely introduced slight movement artifacts while withstanding this load, resulting in large standard deviations. Securing the patient's lower leg and the knee coil could help minimize artifacts and the resulting deviation. Whether meniscus pathology is a cause or effect of osteoarthritic change in the knee is still not completely clear,37 and quantitative MR techniques associated with biochemical structure may prove useful in detecting meniscal changes that precede radiographic manifestation of OA. Finally, our interpretation of meniscus composition from T1ρ and T2 relaxation times is based on literature on articular cartilage and may not necessarily be true for fibrocartilage. Since articular cartilage and fibrocartilage contain similar components, albeit in different quantities, any conclusions about composition are likely to be similar between the two tissue types. Nonetheless, we are unable to evaluate this based on the current study.
In conclusion, zonal T1ρ and T2 relaxation times in conjunction with static loading were able to reveal differences in the horns of the meniscus between OA and control subjects. T1ρ and T2 were elevated in the middle and inner zones of the lateral anterior horn and the outer zone of the medial posterior horn, indicating disrupted macromolecular matrix in these subregions and suggesting that OA changes occur unevenly in the meniscus. Differing patterns in zonal T1ρ and T2 between the anterior and posterior horns suggest differences in macromolecular organization between these compartments. In the medial posterior horn, T1ρ and T2 change scores due to loading were significantly different between groups; relaxation times decreased in those with OA but changed marginally in controls. Quantitative MRI provides information on meniscus changes at the molecular level, while in vivo loading allows additional characterization of early degeneration. Further work is necessary to better understand the effects of loading on the menisci of healthy and unhealthy knees, particularly in the medial posterior horn.
AUTHORS' CONTRIBUTIONS
Acquisition of data, NEC, DK, KS, JSi, JSc, LN, TML. All authors contributed to analysis and interpretation, drafting of the article, and final approval of the manuscript. Authors Calixto ([email protected]) and Kumar ([email protected]) take full responsibility for the integrity of this work as a whole.
ACKNOWLEDGMENTS
The content is solely the responsibility of the authors and does not necessarily reflect the views of NIH-NIAMS.The funding source had no involvement in the study design, collection, analysis or interpretation of data, in the writing of the manuscript, or in the decision to submit the manuscript for publication.


