Morphological and transcriptomic analysis revealing morphological variations and genetic clues in one Lentinula edodes abnormal browning strain
Mubashar Hussain and Ting Wu contributed equally to this work.
Abstract
Strain abnormal browning is a common problem during cultivation of Lentinula edodes. In this study, the L. edodes strain mycelia isolated from Le-WB and cultured on MYG (Le-WP) isolated from an abnormal browning bag was compared with its normal control mycelia isolated from Le-BB and cultured on MYG (Le-BP). The aerial hyphae of Le-WP were white, and the hyphal growth was significantly reduced. Morphological observation of Le-WP under scanning electron microscope (SEM) and transmission electron microscopy (TEM) revealed abnormal organelle structures. Through transcriptomic analysis, more differentially expressed genes (DEGs) were expressed in the metabolic process and catalytic activity in Le-WP than Le-BP. Two Kyoto encyclopedia of genes and genomes (KEGG) pathways named pentose and glucorunate interconversions, and starch and sucrose metabolism were found to be enriched in Le-WP. The gene expression profiles involved in these two pathways were further analyzed and 12 key genes were selected to be verified by quantitative real-time PCR (qRT-PCR), and the results showed that most of these genes were upregulated in Le-WP. Additionally, the content of 1,3-beta-glucan in Le-WP was also significantly higher than in other samples. This research suggests that abnormal strains may be related to the abnormal synthesis of 1,3-beta-glucan, and it needs further research. This research exhibits possible morphological and genetic clues of Le-WP and lays the foundation for understanding the degeneration of L. edodes strains.
Abbreviations
-
- GO
-
- gene ontology
-
- KEGG
-
- Kyoto encyclopedia of genes and genomes
-
- Le-BB
-
- normal browning bag
-
- Le-BP
-
- mycelia isolated from Le-BB and cultured on MYG
-
- Le-WB
-
- abnormal browning bags
-
- Le-WP
-
- mycelia isolated from Le-WB and cultured on MYG
-
- MYG
-
- maltose, yeast and glucose medium
-
- qRT-PCR
-
- quantitative real-time PCR
-
- SEM
-
- scanning electron microscope
-
- TEM
-
- transmission electron microscopy; UDP, uridine diphosphate glucose
1 INTRODUCTION
Filamentous fungi grown in the nutritionally rich medium have been frequently observed as morphological and physiological variations [1-4] and a high frequency of instability is often encountered in the absence of any external mutagenic agent. The morphological variations include a loss or reduction in sporulation and virulence, production of fluffy sterile mycelia, the elevation of pigment secretion, and lower mycelial vitality [2, 4], and the physiological variations include reduction in virulence and secondary metabolite decline [3].
Several mushroom species, such as Agaricus bisporus, Flammulina velutipes, and Cordyceps militari, were reported to exhibit aging or degeneration frequently arising during cultivation, which leads to large production and economic losses [1, 5]. During the cultivation of A. bisporus, phenotypic instability can be observed on agar plates, grain, compost, and the casing material during fruiting, appearing as fluffy patches of rapidly growing mycelium or as thick, rubbery areas of matted growth [6]. Recently, some morphological and metabolic changes in the aged A. bisporus cultivar widespread in China (As2796) were reported, including increased vacuoles, cell rupture/autolysis, elevated pigment secretion, decreased mycelial vitality and fruiting body yield, increased chitin level and cell wall thickness, permeability, the production of pigment, mycelial peels and the outflow of intracellular substances, and so on [5]. In Volvariella volvacea, prolonged subculturing of mycelia for six generations led to a decrease in growth rate, mycelia biomass, protein, carbohydrate, polyphenol, flavone, and total amino acid and mineral element content [7].
Lentinula edodes (Berk.) Pegler, also known as Xianggu and shiitake, is the most common edible mushroom produced in Asia and has the highest total production among all domesticated mushrooms in the world. Lentinula edodes was first cultivated in China more than 800 years ago [8], the modern cultivation of L. edodes began in the 1930s by inoculating spawn on hardwood short logs outdoors. Currently, this labor-intensive method has been replaced by cultivation using sawdust-based substrates. During the cultivation of L. edodes, the spawn was preserved by serial passaging and then cultivated by serial mycelial propagation in culture on nutritionally rich media, frequently exhibiting abnormal mycelial growth, abnormal browning, and poor yields. However, little is reported about this area. Here, L. edodes strain Qi he No. 7, a Chinese commercial cultivated strain, was found to be showing abnormal browning of about a thousandth proportion of the bags during the late stage of the cultivated bag production. In this study, the morphological characteristics of mycelia from this kind of abnormal browning bags were analyzed, and transcriptomic sequencing was used for the analysis of genetic clues involved in the abnormal browning strain of L. edodes.
2 MATERIALS AND METHODS
2.1 Research materials
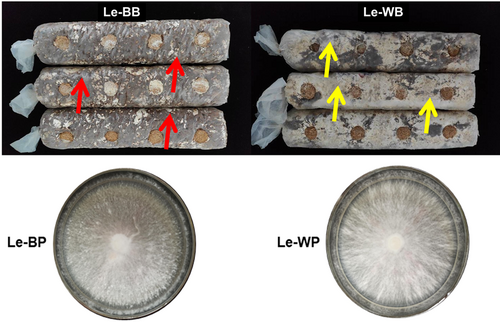
Normal and abnormal browning bags were used to isolate mycelial material Le-BP and Le-WP under laboratory conditions, respectively (Figure 1). The strain name of both kinds of bags is Qi he No. 7, coming from Qi he Edible Mushroom Co., Ltd. normal browning bag (Le-BB) and abnormal browning bags (Le-WB) were inoculated on the same date and cultured in the same laboratory in Qi he Edible Mushroom Co., Ltd, and the abnormal browning phenomenon of Le-WB began to be observed after 45 days. Le-BP and Le-WP were cultured on the maltose, yeast, and glucose (MYG) medium and preserved in the Institute of Applied Mycology, Huazhong Agricultural University.
2.2 Culture test
The mycelial disk was grown on MYG solid medium at 25°C in dark conditions. The culture characteristics were observed after incubation for 10, 20, 30, and 40 days, respectively. The mycelial growth rate was also measured. The experiment was performed using five biological replicates.
2.3 Observation of mycelia by scanning electron microscope and transmission electron microscope
The mycelial disk was inoculated on the center of sterile cellophane and covered on a sterile Petri dish containing solid MYG. When the mycelium grows to 1/2 of the Petri dish (9 cm in diameter), the cellophane containing the outermost edge of the colony was cut into small pieces of 2 mm2 using sharp scissors, and then fixed with 2.5% (v/v) glutaraldehyde solution at 4°C for 48 h. Air was pumped for 30 min to completely submerge the pieces in the liquid. Subsequently, the mycelia were washed three times with 0.05 mol/L phosphate buffer (pH 6.8) and later dehydrated in a graded ethanol series (30%, 50%, 70%, 90%, and 100%, v/v) each for 20 min. Samples were then dried in liquid CO2 at the critical point and sputter coated with palladium-gold, finally examined under scanning electron microscopy (SEM) (JSM-6390LV, JEOL). For the transmission electron microscopy (TEM) study, the mycelia were obtained similar to the SEM method. The samples were prefixed in a 2.5% glutaraldehyde solution adjusted to pH 7.4 with 0.1 M phosphate buffer. Air was pumped for 30 min to completely submerge the pieces in the liquid. The samples were placed in a refrigerator to fix overnight at 4°C. Subsequently, the mycelia were washed three times with 0.1 mol/L phosphate buffer solution for 30 min and then fixed in 1% (w/v) osmic acid (SPI, SPI Chem) solution for 2 h. Later, washed again three times with PBS for 30 min. Next, the mycelia pieces were dehydrated with gradient acetone (Sinopharm), then infiltrated with gradient Spurr resin (SPI, SPI Chem) acetone solution and polymerized and embedded with pure Spurr resin at 60°C for 48 h. The embedded mycelia were cut into 60–70 nm ultra-thin sections with an ultramicrotome (UC6, Leica). Then, the sections were fished on a copper net and 2% (w/v) uranyl acetate (SPI, SPI Chem) aqueous solution. The stain was used for 30 min under a voltage of 80 KV. A transmission electron microscope (H-7650, Hitachi) was used to observe the stained ultrathin sections. Later, the observation results were collected with a CCD camera (Model832 ORIUS, Gatan). At least three to nine independent mycelia plugs (5 mm) for each material were used. After that, at least three ultrathin sections for each mycelia plug (5 mm) were used for TEM observation.
2.4 Sequencing samples and transcriptome sequencing
Le-WP and Le-BP hyphae were respectively inoculated on the MYG solid medium covered with cellophane, and cultured at 25°C for 10 days. The sequenced mycelial samples of Le-BB and Le-WB were collected on the 60th day after inoculation. Then, the mycelia of the two strains were collected and stored at −80°C for further transcriptomic sequencing. Samples from three different Petri dishes or cultivated bags were defined as three biological repeats for each group. Isolation of total RNA was performed from each mycelium sample using the TRIzol method as per the manufacturer's instructions. The integrity of the RNA samples was determined through 1% denaturing agarose gel electrophoresis. The quality and concentration of the RNA samples were analyzed with a NanoDrop spectrophotometer (Denovix, DS-11). Library construction and sequencing were performed by Wuhan GooAl Gene Technology Co., Ltd. The complementary DNA (cDNA) library was established using NEBNext® UltraTM II RNA Library Prep Kit (New England Biolabs Inc.). Illumina X-Ten sequencing platform was used to sequence the L. edodes samples. No less than 6 GB of clean data were obtained for each sample.
2.5 Transcriptome analysis
FastQC v0.11.8 was used to examine the read data's quality. With Trimmomatic v0.39, reads were trimmed by excluding nucleotides with a quality score of less than 30 and keeping only reads longer than 50 nucleotides [9]. Clean reads were mapped to the L. edodes reference genome (https://mycocosm.jgi.doe.gov/LedB17_3/LedB17_3.home.html) using Hisat2 [10], duplicate reads were eliminated using Picard (http://broadinstitute.github.io/picard/), and the mapping rate was estimated using Qualimap [11]. By using HTseq [12], the mapped clean reads count was assessed, and TBtools translated the results to Transcripts Per Million (TPM) data [13]. EdgeR [14] was utilized to find differentially expressed genes (DEGs) with |log2 (fold change)| greater than 1 and a false discovery rate (FDR) below 0.01. Blast2GO annotated DEGs [15]. By using BLAST, all of the genes were mapped to the seqdb database [16], and gene2go was used to determine each gene's GO ID [17]. Gene ontology (GO) enrichment analysis was carried out with Fisher's test and FDR 0.01 correction. The soft of KEGG Orthology-Based Anotation System carried out Kyoto Encyclopedia of Genes and Genomes (KEGG) pathway enrichment analysis [18]. The ggplot2 was used to present GO and KEGG data (http://had.co.nz/ggplot2/).
2.6 Gene expression validation by quantitative real-time PCR (qRT-PCR)
RNA-Seq results were verified by selecting 12 genes on the basis of significant “q” values from the Kyoto encyclopedia of genes and genomes (KEGG) pathways and analyzed by qRT-PCR. The 12 genes included gene_2896, gene_8542, gene_20562, gene_41402, gene_31666, gene_32475, gene_17327, gene_5406, gene_12275, gene_29922, gene_22010, and gene_10464 (Supporting Information: Table S1). The primer pairs were designed using primer premium 5 (Premier Biosoft International) (Supporting Information: Table S1). LedActin was used as a reference gene for qRT-PCR validation. Reverse-transcription of RNA was performed using HiScript RT Supermix for qPCR (+gDNA wiper) (Vazyme Biotech) SYBR green fluorescent dye (Vazyme Biotech) was used to perform the qPCR reactions on a Bio-Rad CFX Connect Real-Time System (Bio-Rad Laboratories). The relative expression values of each gene were calculated using the method. The experiment was performed using nine biological replicates [19].
2.7 Aniline blue assay of 1,3-beta-glucan
The enzymatic activity of 1,3-beta-glucan was calculated by performing an aniline blue assay, according to a previous study [20]. The fluorescence readings were recorded by using a fluorimeter (Tecan Infinite M200), with 460 nm emission and 405 nm excitation. The unit used for the expression of values is (mg/g) of the mycelial tissue, by using Le-BB, Le-WB, and Le-BP, Le-WP. The experiment was performed in triplicate.
2.8 Statistical analysis
The statistical analysis was performed by using Statistix 8.1 (Analytical Software Inc.). The standard error and mean values were calculated using Excel (Microsoft Corp.). Multiple comparisons with least significant difference test at significant difference p < 0.05 were used to determine significant differences among the different treatments, and one-way analysis of variance (ANOVA) was performed to find the expression values of genes by qRT-PCR. Origin Pro 8.5.1 (Origin Lab Corporation) was used for making the graphs.
3 RESULTS
3.1 Comparison of culture characteristics between the colony phenotypes of Le-BP and Le-WP
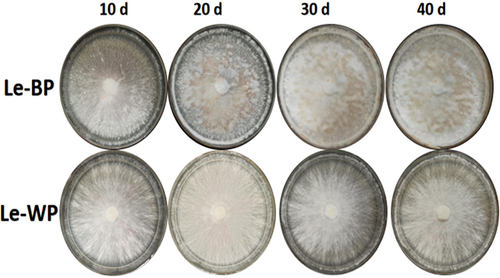
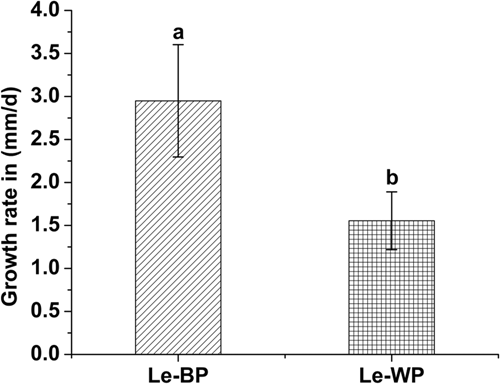
The colony phenotypes of Le-BP (normal) and Le-WP (abnormal) had different changes visible to the naked eye during the growth process (Figure 2). The Le-BP hyphae germinated the next day after inoculation, mycelia appeared grey-floss-shaped. The Le-WP mycelium appeared close-packed and radiating outward, and the colonies were whiter than the ones of Le-BP. After 20 days of culture, some “mycelium aggregates” were formed on the surface of Le-BP colonies. As the number of cultivation days increased, the “mycelium aggregates” in Le-BP colonies grew together and formed thicker mycoderma, and pigment deposition increased. However, the Le-WP colony had no obvious changes, except for the colonies became denser with the increase of culture time (Figure 2). The growth rates of Le-BP showed an upward growth trend, while the Le-WP strain showed a downward growth trend. The growth rate of abnormal mycelium Le-WP was slower than that of normal mycelium Le-BP (Figure 3).
3.2 Comparison of ultrastructure characteristics between the colony phenotypes of Le-BP and Le-WP
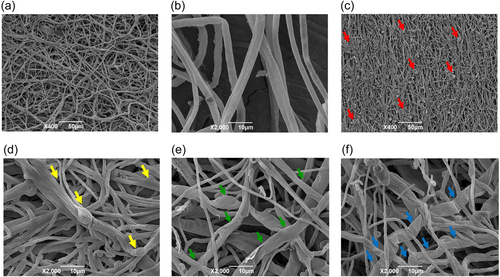
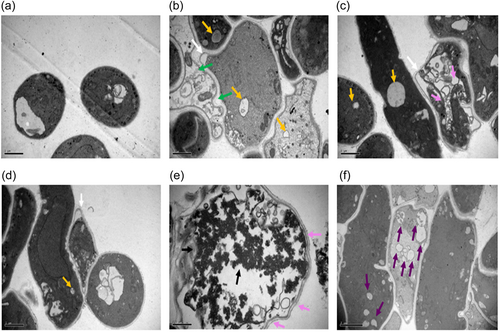
The differences in microscopic features between the normal Le-BP and the abnormal Le-WP mycelia are revealed more clearly observed by scanning electron microscopy (SEM) (Figure 4). The surface of the Le-BP colony is flat and has no “spherical mass formations” (Figure 4a), and the hyphae are regular (Figure 4b). However, multiple “spherical mass formations” can be observed on the surface of the Le-WP colony (Figure 4c), and hyphae adhesions are commonly observed in Le-WP (Figure 4d), and some hyphae of Le-WP are twisted together (Figure 4d), and become swollen (Figure 4d,e). Some of the adhesive hyphae become wrinkled and obvious uneven thickness, and some hyphae appeared completely shrunk (Figure 4e,f). Observation under TEM revealed, that Le-WP hyphae cells had some signs of aging or degeneration characteristics, such as separation of cytoplasm, increment of lipid droplets, cell shrinkage and vacuolization, cytoplasmic vacuolar and thicker and loose cell wall structures in some cells (Figure 5).
3.3 RNA sequencing data and screening of differentially expressed genes
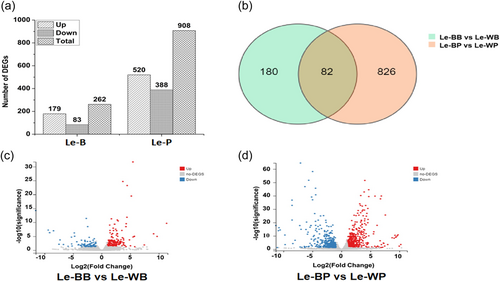
In Le-BB, Le-WB, Le-BP, and Le-WP, total raw reads, clean reads, total clean bases, clean read ratio, total mapping, and unique mapping average values are shown in Table 1. Data were divided into three replicates. To reflect the correlation of gene expression between samples, Pearson correlation coefficients for all gene expressions between every two samples were calculated. In the case of correlation between samples, we compared Le-BB and Le-WB (Supporting Information: Figure S1). In Le-BB versus Le-WB total number of DEGs found was 262, among them 179 were upregulated, and 83 were downregulated. In Le-BP versus Le-WP, 908 DEGs were identified, 520 were upregulated and 388 were downregulated (Figure 6a). There were 82 overlapping genes between these two comparisons (Figure 6b). In addition, the volcano map is showing the degree of significance and up and downregulation of the DEGs between Le-BB versus Le-WB and Le-BP versus Le-WP. It can be seen clearly that the significant degree of DEGs in the Le-BP versus Le-WP is much higher than those in the Le-BB versus Le-WB (Figure 6c,d).
| Sample | Total raw reads (M) | Total clean reads (M) | Total clean bases(Gb) | Clean reads Q20(%) | Clean reads Q30(%) | Clean reads ratio(%) | Total mapping (%) | Uniquely mapping (%) |
|---|---|---|---|---|---|---|---|---|
| Le-BB | 47.19 | 46.95 | 6.98 | 98.39 | 94.89 | 99.49 | 85.92 | 84.47 |
| Le-WB | 48.68 | 48.46 | 7.20 | 98.44 | 95 | 99.53 | 83.12 | 81.44 |
| Le-BP | 44.98 | 44.27 | 6.66 | 98.17 | 94.49 | 98.44 | 81.78 | 77.18 |
| Le-WP | 43.90 | 43.35 | 6.45 | 98.23 | 94.59 | 98.75 | 79.13 | 76.79 |
- Abbreviations: Le-BB, normal browning bag; Le-BP, mycelia isolated from Le-BB and cultured on MYG; Le-WB, abnormal browning bags; Le-WP, mycelia isolated from Le-WB and cultured on MYG.
3.4 Go function and enrichment analysis revealed catalytic activity and metabolic process were enriched in Le-WP
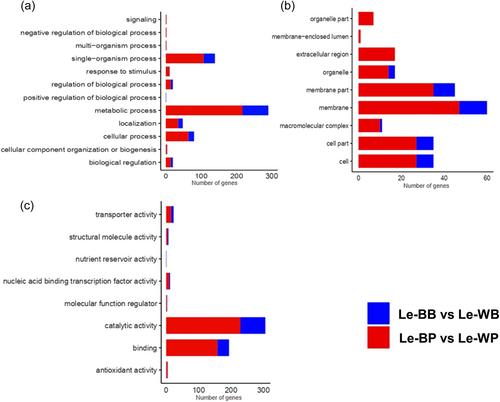
In Le-BP versus Le-WP, there was a total of 11 different biological processes, in which various DEGs were expressed. Among these DEGs, 250 DEGs were expressed in the metabolic process and 120 DEGs were expressed in the single-organism process, in the cellular component, the most DEGs were involved in membrane (50 DEGs) and membrane part function (40 DEGs). In molecular function, DEGs expression was found in nine functions, having the maximum number (280 DEGs) in catalytic activity followed by the binding activity with 150 DEGs.
In Le-BB versus Le-WB, there were nine different biological processes, in which various DEGs were expressed. Among these DEGs, 70 DEGs were involved in the metabolic process and 30 DEGs were recorded in the single-organism process. There was a total of six different cellular component functions in Le-BB versus Le-BP, containing 15 DEGs involved in membrane activities. In the case of molecular function (Le-BB vs. Le-WB), there was a total of eight functions in which DEGs were expressed. Among these functions, catalytic activity contains 78 DEGs and the binding function contains 38 DEGs. Most of the genes involved in the metabolic process and single organism process through the molecular function of catalytic and binding activities were more expressed in Le-BP versus Le-WP and were significant (Figure 7), suggesting that these parameters are of great significance.
GO enrichment terms were selected on the basis of Q value less than 0.005. In both Le-BP versus Le-WP and Le-BB versus Le-WB, the highly enriched and significant terms included catalytic activity and metabolic process, with 229 and 217 DEGs, and with 77 and 73 DEGs, respectively (Supporting Information: Figure S2).
3.5 KEGG enrichment analysis revealed pentose and glucuronate interconversions and starch and sucrose metabolism were enriched in Le-WP
KEGG enrichment analysis revealed that starch and sucrose metabolism were enriched in Le-BP versus Le-WP and Le-BB versus Le-WB treatment, while the pentose and glucoronate interconversions pathway was only enriched in Le-BP versus Le-WP (Supporting Information: Figure S3). The genes having log2 values of more than twofold change were selected.
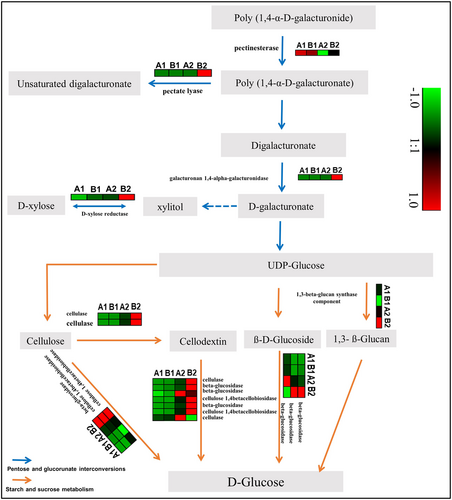
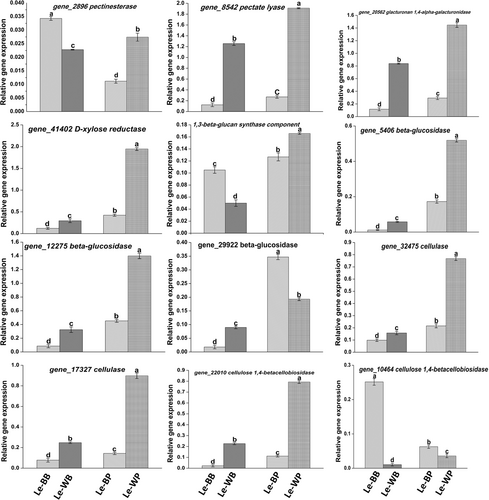
Pectinesterase and galacturonan 1,4-alpha-galacturonidase were involved in the synthesis of uridine diphosphate (UDP)-glucose in the pentose and glucuronate interconversions pathway. In the pentose and glucuronate interconversions pathway, two genes were identified encoding for pectinesterase (gene_2896, EC 3.1.1.11) and galacturonan 1,4-alpha-galacturonidase (gene_20562, EC 3.2.1.67), and only the latter gene was upregulated in Le-WP.
UDP-Glucose acted as a substrate to initiate the starch and sucrose metabolism pathway from three ends. Three ends included 1,3-beta-glucan, beta-d-glucoside, and cellulose, respectively. In starch and sucrose metabolism pathway, 10 genes were identified encoding for 1,3-beta-glucan synthase component (gene_31666), cellulase (gene_17327 and gene_32475, EC 3.2.1.4), beta-glucosidase (gene_5406, gene_12275, gene-21409, gene-46088 and gene_29922, EC 3.2.1.21), and cellulose 1,4-betacellobiosidase (gene_22010 and gene_10464, EC 3.2.1.91), respectively. 1,3-beta-glucan was synthesized by 1,3-beta-glucan synthase component (gene-31666), was upregulated in Le-WP, and was responsible for d-glucose synthesis. Cellulose was synthesized by cellulase (gene_17327 and gene_32475) and was upregulated in Le-WP. Cellulose was leading to two ends. At one end, it acted as substrate of cellodextin and was responsible for d-glucose synthesis, cellulase (gene_32475), beta-glucosidase (gene_5406, gene_12275 and gene_29922), and cellulose 1,4-betacellobiosidase (gene_22010 and gene_10464) were upregulated in Le-WP. At the second end, cellulose was directly responsible for d-glucose synthesis, at this end, beta-glucosidase (gene-21409) and cellulose 1,4-betacellobiosidase (gene_22010 and gene_10464) were upregulated in Le-WP (Figure 8). qRT-PCR was conducted to verify the above results, and the results showed that it was in compliance with the transcriptome data analysis (Figure 9).
3.6 Aniline blue assay of 1,3-beta-glucan
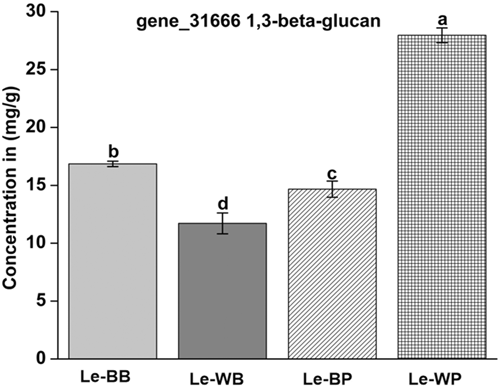
The enzyme analysis unveiled that the enzymatic activity of the 1,3-beta-glucan component was 28.30 mg/g in Le-WP comparison to Le-BB, Le-WB, and Le-BP, having an enzymatic activity of 16.5, 11.3, and 16 mg/g, respectively (Figure 10). These results were similar to those observed in transcriptome data analysis.
4 DISCUSSION
In this study, we firstly explored a variety of phenotypic changes in the abnormal browning L. edodes sample, showing decreased mycelial vitality and growth ability, increased shrinkage, and other abnormal organelle structures (Figures 3 and 4). In addition, it was clearly observed from TEM that the cell wall thickness of Le-WP was significantly greater than that of Le-BP (Figure 5). This result is consistent with some phenomena of fungal degenerating or aging samples reported by previous studies, such as the degeneration of edible mushrooms characterized by incomplete morphological structure, digested cell membranes, autophagy, and fragile and slow-growing mycelia [21, 22]. Moreover, aging is characterized by the leakage of a large number of pigments, mycelial peels, drying and shrinkage, a large number of swollen and deformed cells, and empty or burst cells [5]. This result indicates L. edodes strain Qi he No. 7, the original strain of Le-WP, is subjected to degeneration or aging.
Through comparisons of transcriptomic analysis in this study, it exhibited that more DEGs were expressed in the metabolic process and catalytic activity in Le-WP than Le-BP. Additionally, two KEGG pathways named pentose and glucuronate interconversions, and starch and sucrose metabolism were found to be enriched in Le-WP. Most of these genes involving in these two KEGG pathways were upregulated in Le-WP, and this result was also verified by qRT-PCR. The content of 1,3-beta-glucan in Le-WP was also significantly higher than in other samples. These results indicated the relationship between the abnormal synthesis of 1,3-beta-glucan and the abnormal browning of L. edodes. A chemical analysis of purified 1,3-beta-glucans indicates that they can exist in a single-stranded helical conformation in solution, and they can also form stable three-stranded helices [23, 24]. The 1,3-beta-glucan helix is considered to work as a spiral spring-like framework that gives the cell wall some flexibility and structural rigidity [25]. The phenotypic changes of Le-WP mentioned above show that the cell wall thickness of Le-WP was significantly greater than that of the normal control. Therefore, the abnormal synthesis of 1,3-beta-glucan resulted in cell wall abnormalities including excessive production of d-Glucose, and other phenotypic changes were hypothesized, but it needs further research.
ACKNOWLEDGMENTS
This study was supported by the earmarked fund for Modern Agroindustry Technology Research System on Edible Fungus of China (CARS-20), and the cooperation project between government and school “Technology innovation and technology system construction of edible mushroom industry in Jinmen city, Hubei, China”. The authors offer special thanks to Aamir Hamid khan from the National Key Lab of Crop Genetics Improvement, College of Plant Science and Technology, Huazhong Agricultural University, Wuhan, 430070, China for his help in the analysis of data.
CONFLICT OF INTEREST
The authors declare no conflict of interest.
Open Research
DATA AVAILABILITY STATEMENT
The data that support the findings of this study are available from the corresponding author upon reasonable request.


