Do BDNF and NT-4/5 exert synergistic or occlusive effects on corticostriatal transmission in a male mouse model of Huntington's disease?
Abstract
Brain-derived neurotrophic factor (BDNF) and neurotrophin-4/5 (NT-4/5) are trophic factors belonging to the neurotrophin family; in addition to their trophic role, both neurotrophins play an important role in modulating corticostriatal synaptic transmission. Failures in BDNF supply and mitochondrial dysfunction are among the factors involved in the striatal degeneration that occurs in Huntington's disease (HD). While the effects of BDNF have been widely studied in striatal degeneration, the role of NT-4/5 has been less addressed. NT-4/5 does not appear to exert effects similar to those of BDNF in HD. The physiological roles of these molecules in corticostriatal transmission have been evaluated separately, and we have demonstrated that sequential exposure to both neurotrophins results in different modulatory effects on corticostriatal transmission depending on the exposure order. In the present study, we evaluated the effects of BDNF followed by NT-4/5 or NT-4/5 followed by BDNF on corticostriatal synaptic transmission with field recordings in a male mouse model of HD produced by in vivo treatment with the mitochondrial toxin 3-nitropropionic acid. Here, we show that these neurotrophins elicit an antagonistic or synergistic effect that depends on the activation of the truncated isoform or the stimulation of the full-length isoform of the tropomyosin receptor kinase B.
Significance
This study shows that NT-4/5 signaling can potentiate corticostriatal transmission if it acts alone or if it is followed by BDNF-TrkB-signaling. However, NT-4/5-TrkB-signaling can exhibit an antagonistic effect against BDNF-mediated modulation of corticostriatal transmission if it follows BDNF exposure in the context of striatal degeneration that mimics HD.
1 INTRODUCTION
Huntington's disease (HD) is an inherited and progressive neurodegenerative disorder that affects mainly projection cells in the striatum. Patients with HD exhibit cognitive and movement alterations as the main symptoms (Hernández-Echeagaray, 2010; Raymond et al., 2011; Walker, 2007); the disease is the result of a mutation in the interesting transcript 15 (IT15) gene, or HD gene. The mutation originates an expansion in CAG repeats in a protein called huntingtin (htt). Among the mechanisms responsible for cellular damage in HD are deficits in neurotrophic supply and mitochondrial dysfunction (Panov et al., 2002; Zuccato & Cattaneo, 2007).
Experimental evidence has shown that brain-derived neurotrophic factor (BDNF) is necessary for the survival of medium-sized spiny neurons (MSNs); in fact, the striatal degeneration observed in HD is believed to occur in part due to a reduction in BDNF supply. Indeed, some studies reported that BDNF levels are reduced in the serum of HD patients (Brouillet, Conde, Beal, & Hantraye, 1999; Ciammola et al., 2007). In some genetic models of HD, there is a decrease in the synthesis and release of BDNF at corticostriatal synaptic connections along with a decrease in the expression of the receptor for BDNF, the TrkB, in the striatum (Gauthier et al., 2004; Ginés et al., 2006; Park, 2018; Zuccato et al., 2001).
In addition to a failure of trophic support, biochemical studies have indicated an alteration in mitochondrial function in HD that includes modifications in complexes II and III that lead to reductions in ATP synthesis (Browne, Ferrante, & Beal, 1999; Coles, Edmondson, & Singer, 1979; Gu et al., 1996). Indeed, treatment with the complex II inhibitor 3-nitropropionic acid (3-NP) causes pathological changes mimicking those observed in HD postmortem tissue (Beal et al., 1993; Deshpande et al., 2006).
Using a 3-NP model of HD to emulate early stages of the illness, we have shown that BDNF and TrkB expression is reduced in the striatum (Espíndola, Vilches-Flores, & Hernandez-Echeagaray, 2012; Mendoza et al., 2014); however, the striatal expression levels of NT-4/5, unlike those of BDNF, are not altered in tissue from mice treated with 3-NP. This is interesting because NT-4/5 and BDNF exert their effects on synaptic transmission by stimulating TrkB, which in turn activates different signaling pathways (Amaral & Pozzo Miller, 2007; Gottschalk et al., 1999; Koponen, Lakso, & Castren, 2004; Poo, 2001; Reichardt, 2006).
BDNF is synthesized in the pyramidal neurons of the cortex, and it is transported to the striatum through the corticostriatal pathway (Altar & Di Stefano, 1998); however, the origin of NT-4/5 is less clear. We have shown that BDNF levels decline in the postnatal period, while NT-4/5 levels increase during the first two postnatal months in the striatum (Zermeño, Espindola, Mendoza, & Hernandez-Echeagaray, 2009).
BDNF and NT-4/5 each increase the amplitude of corticostriatal synaptic population spikes (Mendoza et al., 2014); however, sequential application of these neurotrophins produces different effects depending on the application order. If BDNF application is followed by NT-4/5 application, NT-4/5 inhibits the effects of BDNF on corticostriatal synapses. In contrast, if BDNF application follows NT-4/5 administration, BDNF does not produce any further effect. Our group established that the NT-4/5 antagonistic effect is due to upregulation of truncated isoforms of TrkB (TrkB-T1) and to downregulation of the full-length (TrkB-FL) isoform of TrkB (Torres-Cruz et al., 2019). We have also demonstrated that in a 3-NP-induced model of HD, BDNF and TrkB-FL mRNA expression levels, but not NT-4/5 expression levels, are reduced (Espíndola et al., 2012). In the present study, we sought to determine whether NT-4/5 antagonizes the effect of BDNF on corticostriatal transmission in HD given that BDNF is reduced. Alternatively, we wondered whether the impact of NT-4/5 on TrkB activation in HD would be different from that we have already described in the healthy striatum because BDNF levels are reduced. Thus, this study evaluated whether BDNF and NT-4/5 exhibit synergistic or antagonistic effects on the modulation of corticostriatal synapses in a toxin model of HD.
2 MATERIALS AND METHODS
Forty C57BL/6 mice (Envigo, México) that were ~35 days old were used. Only male mice were used to avoid hormonal variations in physiological responses. The mice were housed in groups of five in Plexiglas boxes with free access to food and water at room temperature (24–26°C) under a 12:12 hr light/dark cycle. Twenty mice were randomly assigned to a control group (vehicle: phosphate buffer, PB; 0.01 M, pH 7.4, i.p.), and the other 20 mice were assigned to a 3-NP (15 mg/kg, i.p.) group and treated for 5 days. Experimental evaluations were carried out 2 days after the last 3-NP or vehicle treatment. All experimental procedures were approved by the local bioethics committee and followed national (NOM-062-ZOO-1999) and international guidelines for the care and use of experimental animals.
2.1 Electrophysiology
For electrophysiological experiments, 10 mice from the control group and 10 from the 3-NP treated group were used. Two days after the last injection of 3-NP or vehicle, the mice were anesthetized with halothane in an induction chamber; then, the mice were decapitated to obtain the brains. The brains were placed in low-calcium physiological Ringer's solution that was chilled (4°C) and constantly oxygenated (95% O2, 5% CO2) and contained, in mM, 130 NaCl, 3 KCl, 1 CaCl2, 5 MgCl2, 1.25 NaH2PO4, 26 NaHCO3, and 10 glucose (298–300 mOsm, pH 7.4). Sagittal brain slices (400 µm) containing the striatum were obtained through a vibroslicer (Pelco 1000, Ted Pella Inc., Redding, CA, USA). The slices were maintained at room temperature (25°C) in oxygenated physiological saline for 1 hr prior to recording to recover from slicing.
2.2 Stimulation parameters and electrophysiological recordings
For these experiments, synaptic population activity was measured in a recording chamber perfused with physiological saline (in mM; 3 KCl, 125 NaCl, 2 CaCl2, 1 MgCl2, 26 NaHCO3, 0.2 thiourea, 0.2 ascorbic acid, and 10 glucose, pH 7.4) that was constantly bubbled (95% O2, 5% CO2) at a constant flow rate (1 ml/min) and a controlled temperature (32 ± 1°C).
Population spikes were generated by stimulating cortical afferents to the striatum with stimuli of variable intensity and duration (5–30 V, 50–200 μs) at 0.1 Hz with an isolated stimulator (Digitimer DS2, Letchworth Garden City, UK) through a concentric bipolar tungsten electrode (50 µm, CBCEE75, FHC, Inc., Bowdoinham ME, USA) placed in the corpus callosum. To analyze neurotrophin-induced changes on corticostriatal transmission, a paired-pulse (PP) protocol was used with a 30- to 50-ms interval, and paired-pulse ratio (PPR, S2/S1 * 100) was evaluated. The PP protocol is based on the residual calcium hypothesis, which establishes that changes in PPR result from changes in intracellular levels of Ca2+ in response to a pair of stimulus of same intensity and duration given in a short period of time (Atluri & Regehr, 1996; Dittman, Kreitzer, & Regehr, 2000; Zucker & Regehr, 2002).
To record the signal, borosilicate glass electrodes (30-30-1, FHC, Inc.) were pulled (P-97, Sutter Instruments, Novato, CA, USA) and filled with NaCl, 0.9%. The electrophysiological signal was amplified (AC, GRASS P15, Quincy, MA, USA), filtered (1 kHz), and acquired with an interface coupled to a PC running LabVIEW 6.1 (National Instruments, Austin, TX, USA).
To isolate glutamatergic activity, (-)-bicuculline methiodide (10 µM) was used in all experiments to block GABAergic inhibitory responses. Population spikes were recorded for 10 min before neurotrophin treatment. After 10 min of stable recordings, BDNF or NT-4/5 (10–50 ng/ml, PeproTech, Inc.) dissolved in distilled water (following the vendor instructions) was applied, and after 20 min, the other neurotrophin was added (BDNF → NT-4/5 or NT-4/5 → BDNF) for 10–30 min.
The data were digitized, stored, and analyzed offline with the aid of Microcal Origin 9.1 (Microcal Origin, Lab Corp., Northampton, MA, USA, RRID:SCR_002815).
2.3 Western blot analysis of cerebral slices
To evaluate changes in receptor protein expression, cerebral slices from 10 control mice and 10 3-NP-treated mice containing the striatum were incubated at RT in physiological saline for electrophysiological experiments that contained bicuculline and was bubbled (95% O2 and 5% CO2). Then, the slices were exposed to (a) BDNF, (b) BDNF → NT-4/5, (c) NT-4/5, or (d) NT-4/5 → BDNF for 10 min. Then, striatal tissue from each group was homogenized manually in lysis buffer (Tris–HCl 26 mM, 1% Triton X-100, glycerol 1.3 M, NaCl 130 mM) with cOmplete Mini phosphatase inhibitor tablets (Roche, Indianapolis, IN, USA), and proteins were obtained following the methodology described previously (Torres-Cruz et al., 2019).
For electrophoresis, each well of 10% acrylamide/bisacrylamide gels was loaded with 30 µg of protein (quantified by the Bradford method). For protein separation, a current of 90 V and 15 A was applied for 1 hr 40 min in an electrophoresis chamber (Mini-PROTEAN® Tetra Handcast System, Bio-Rad Laboratories, Inc., Hercules, CA, USA) containing running buffer. After electrophoresis, the proteins were transferred to polyvinylidene fluoride (PVDF) membranes and blocked with 10% nonfat milk and bovine serum albumin (BSA, 5%) in PBS overnight (4°C). Once the proteins had been transferred to the PVDF membranes, the membranes were incubated with primary antibodies against total TrkB (1:20,000, Cell Signaling Technology Cat# 4603, RRID:AB_2155125), phosphor-Tyr816-TrkB (1:500–1:2,000, Millipore Cat# ABN1381, RRID:AB_2721199), and actin (1:1,000; Diaz-Barriga et al., 1989) for 12 hr at 4°C. After rinsing, the membranes were then incubated for 1–2 hr at room temperature with secondary antibodies (1:20,000) conjugated with horseradish peroxidase (HRP). The secondary antibodies, used were horseradish peroxidase-conjugated goat anti-mouse IgG (Thermo Fisher Scientific Cat# 62-6520, RRID:AB_2533947) and horseradish peroxidase-conjugated goat anti-rabbit IgG (Thermo Fisher Scientific Cat# 65-6120, RRID:AB_2533967). The proteins were visualized with the chemiluminescence method (Gel Documentation System, Biosens SC 645, Shanghai Bio-Tech Co., Ltd) and imaged with Kodak photographic plates. The plates were scanned, and the signal obtained was analyzed by densitometry with the aid of ImageJ software (NIH). To obtain the relative density, we used the following equation: Relative density = phosphorylated protein/total protein.
2.4 COS-7 cell culture and transfection
Cell culture and transfection was performed with methodology previously described (Torres-Cruz et al., 2019). Briefly, COS-7 cells from the American Type Culture Collection (ATCC; Manassas, VA, USA) were grown in Dulbecco's modified Eagle's medium (DMEM) supplemented with 10% fetal bovine serum (FBS; Gibco, Grand Island, NY, USA), 2 mM L-glutamine, 100 U/ml penicillin, and 100 μg/ml streptomycin and maintained in a humidified atmosphere (5% CO2, 37°C). Once the cells reached 50%–60% confluence, the medium was changed to serum-free Opti-MEM specialized medium (Gibco), and the cells were cotransfected with 1 μg of TrkB DNA constructs [plasmids pGFP-N1-TrkB (RRID:Addgene_32500) and pRc/CMV HA-TrkB.T1 (RRID:Addgene_39980)] using the Lipofectamine 2000 reagent (Invitrogen) following the manufacturer's instructions. Four hours after transfection, the cells were incubated in fresh 10% FBS-supplemented DMEM and kept at 37°C for 48 hr. The transfected cells were washed in ice-cold phosphate-buffered saline (PBS, pH 7.4), and the cell cultures were incubated with 3-NP (100 µM) for 12 hr and later treated with 10 ng/ml BDNF followed by 10 ng/ml NT-4/5 (BDNF → NT-4/5) or 10 ng/ml NT-4/5 followed by 10 ng/ml BDNF (NT-4/5 → BDNF) for 30 min.
2.5 Electrophoresis of cell extracts and Western blotting
After treatment with neurotrophins, the cells were processed for Western blot analysis as previously described (Torres-Cruz et al., 2019). In brief, the cell cultures were washed twice with PBS, and the cells were removed and lysed in radioimmunoprecipitation assay (RIPA) buffer containing a cocktail of protease inhibitors. The lysate was then centrifuged (4,500 rpm for 10 min), and the supernatant was collected for protein determination by the mini-Bradford assay (Bio-Rad Laboratories, Inc.). The proteins were separated by 10% sodium dodecyl sulfate polyacrylamide gel electrophoresis (SDS-PAGE) and transferred onto nitrocellulose membranes for immunoblot analysis. The membranes were blocked in 10% nonfat dried milk + 5% BSA in PBS with 0.1% Tween 20 (PBS-tw) overnight (4°C) and then incubated with the primary antibodies used in tissue slices (Cell Signaling Technology, Danvers, MA, USA) against p-TrkB (1:2,000), TrkB (1:20,000), and actin (1:1,000) diluted in PBS-tw + 10% nonfat dry milk + 2.5% BSA. The membranes were rinsed and incubated with HRP-conjugated secondary antibodies (1:20,000, horseradish peroxidase-conjugated goat anti-mouse IgG, and horseradish peroxidase-conjugated goat anti-rabbit IgG) for 1–2 hr (RT). The immunoblots from at least two independent experiments were analyzed and visualized as described above, and the data were normalized to control condition.
2.6 Statistical analysis
All data were analyzed with Sigma Plot 12.3 (Systat Software, Inc, San Jose, CA, USA, RRID:SCR_003210) using parametric or nonparametric tests as appropriate. The data from the electrophysiological experiments were normalized to control condition and analyzed with one-way ANOVA followed by post hoc analysis if the variance and distribution were normal or with nonparametric analysis of variance if the normality test and equal variances failed. Significance was set at p < 0.05 and the results are expressed as the mean ± SEM unless otherwise specified.
2.7 Reagents
All reagents were purchased from Sigma-Aldrich Co., LLC (St Louis, MO, USA), unless otherwise stated.
3 RESULTS
3.1 BDNF → NT-4/5 treatment
All electrophysiological recordings were normalized to control as the 100% to analyze neurotrophin modulation on the population synaptic spike.
Figure 1 depicts the effect of BDNF followed by NT-4/5 (BDNF → NT-4/5). BDNF increased the amplitude of the synaptic spike (Figure 1a–c); nevertheless, NT-4/5 administration significantly inhibited the effect of BDNF as expected from our previous study ( = 6.5, p = 0.039, one-way repeated measures ANOVA on ranks, Tukey test, post hoc, multiple comparisons, n = 4, Figure 1a–c). Analysis of the PPR (S2/S1) did not show differences among experimental conditions (Figure 1d).
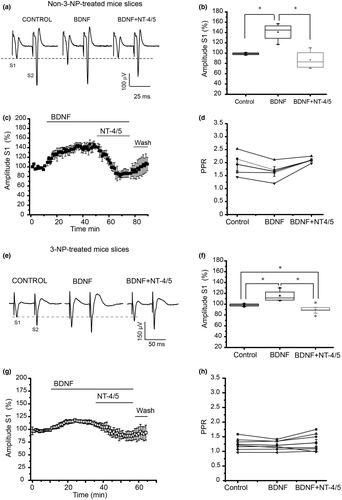
The application of BDNF to cerebral slices from mice treated with 3-NP in vivo significantly increased the spike amplitude (Figure 1e). This increase was not in the same proportion as that obtained in control slices (Figure 1f vs. 1b). The application of NT-4/5 after BDNF (BDNF → NT-4/5) significantly reduced the population spike amplitude (Figure 1g), indicating that NT-4/5 exerts an inhibitory effect in early striatal degeneration produced by 3-NP treatment as well as it did in control tissue (F2,26 = 29.928, p = <0.001; one-way repeated measures ANOVA, n = 9, Holm–Sidak multiple comparisons test, n = 9). Analysis of the PPR did not show differences among the treatments (Figure 1h).
Four experiments receiving BDNF → NT-4/5 did not show any modulatory effect on synaptic transmission. Moreover, in two experiments where BDNF did not show any modulatory effect on corticostriatal synapses in tissue from 3-NP-treated mice, administration of NT-4/5 increased the population spike amplitude (data not shown).
3.2 NT-4/5 → BDNF treatment
Figure 2 illustrates the effects of NT-4/5 → BDNF treatment in control and 3-NP-treated tissue. In slices from control mice, NT-4/5 significantly increased the amplitude of the population spike, an effect that was not inhibited by BDNF when BDNF followed NT-4/5 (F2,17 = 204.29, p = 0.001, one-way repeated measures ANOVA, Holm–Sidak multiple comparisons test, n = 6, Figure 2a–c). The PPR analysis found significant differences between control and treatments (F3,19 = 73.413, p < 0.001; one-way ANOVA, Holm–Sidak multiple comparisons test), indicating that the effect of NT-4/5 was presynaptically mediated in control tissue (Figure 2d).
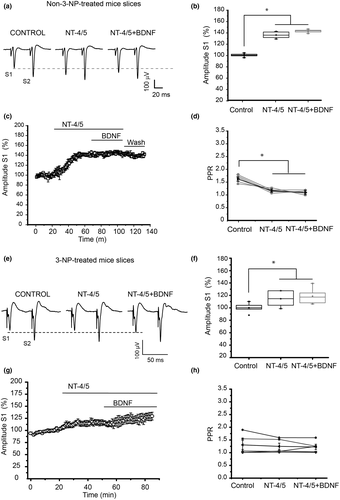
NT-4/5 application in slices from 3-NP-treated mice produced a small but statistically significant increase in the amplitude of the population spike (Figure 2e–g). Moreover, administration of BDNF after NT-4/5 produced a small increase in the spike amplitude in comparison to NT-4/5 alone ( = 9.0, p = 0.011, Friedman repeated measures ANOVA on ranks, Tukey test post hoc multiple comparisons test, n = 6). Analysis of the PPR did not show significant differences among treatments (Figures 2h). There were two experiments where NT-4/5 → BDNF treatment did not induce changes in the synaptic spike amplitude.
To specifically investigate the mechanism by which the sequential application of neurotrophins produced synergistic or antagonistic effects on corticostriatal synapses in slices from mice with 3-NP-induced striatal degeneration, we evaluated whether 3-NP treatment modified the protein levels and phosphorylation of TrkB in the presence of BDNF → NT-4/5 or NT-4/5 → BDNF by means of Western blot analysis of lysates from striatal slices.
3.3 3-NP treatment in vivo modifies the expression of TrkB in the striatum
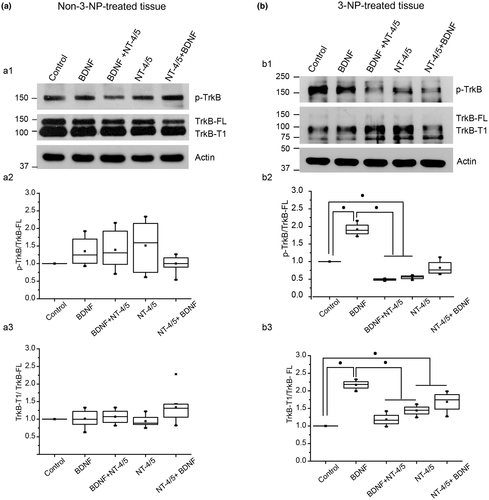
Analysis of the protein expression in lysates of striatal slices did not show differences in the expression of p-TrkB or TrkB-T1 isoform in non-treated tissue under neurotrophin treatment (Figure 3a). The analysis of the protein expression of TrkB receptors in striatal lysates of slices from mice treated with 3-NP showed a reduction in the expression of the TrkB-FL which was very weak under all treatments (Figure 3b, b1), in comparison to non-treated tissue (Figure 3a, a1). There was a statistical difference in p-TrkB/TrkB level under BDNF, BDNF → NT-4/5 and NT-4/5, and NT-4/5 → BDNF compared to control. Also there were statistical differences between BDNF and BDNF → NT-4/5, and BDNF and NT-4/5 treatments (H4 = 12.523, p = 0.014, Kruskal–Wallis ANOVA, Student–Newman–Keuls, multiple comparisons, Figure 3b, b2). The decrease in the phosphorylation of TrkB was accompanied by an increase in the level of the truncated isoform of TrkB in BDNF → NT-4/5, NT-4/5 but not in NT-4/5 → BDNF (F4,14 = 12.593; p = 0.001, one-way ANOVA, Holm–Sidak method, multiple comparisons, Figure 3b, b3). The reduction in phosphorylation under BDNF → NT-4/5 exposure and the increase in TrkB-T1 are consistent with the antagonistic effect observed in electrophysiological experiments. No increase was observed in TrkB-T1 expression level under NT-4/5 → BDNF, which agrees with the synergic effect on population spike amplitude observed in the physiology.
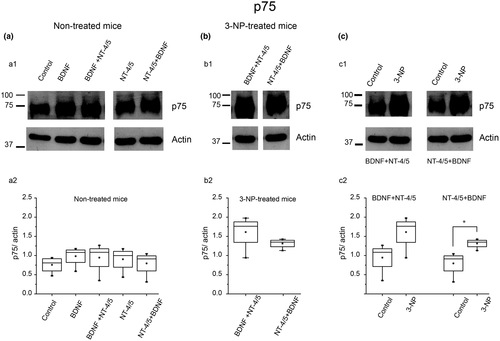
There is experimental evidence that suggests that in the absence of TrkB, BDNF binds to the p75 receptor and elicits effects contrary to those activated through TrkB stimulation (Woo et al., 2005). Thus, we evaluated the expression of the p75 receptor under our experimental conditions. We found no evident changes in p75 protein expression under neurotrophins application in non-3-NP-treated slices (Figure 4a). In slices from 3-NP-treated mice, there was an increase in the p75 receptor when tissue was exposed to BDNF → NT-4/5 or NT-4/5 → BDNF (Figure 4b). Figure 4c illustrates protein expression of p75 receptors in non-3-NP-treated and 3-NP-treated tissue under the administration of BDNF → NT-4/5 or NT-4/5 → BDNF. Note that p75 receptor expression only showed differences under NT-4/5 → BDNF when compared to non-3-NP-treated tissue slices (t6 = −2.938; p = 0.026, two-tailed, t test).
3.4 TrkB-FL and p-TrkB are reduced and TrkB-T1 is upregulated in 3-NP-treated COS-7 cell exposure to BDNF → NT-4/5
To further investigate the participation of TrkB isoforms and their changes under 3-NP treatment with neurotrophin exposure, we utilized a cell line system to avoid contamination with a mixed population of neuronal and glial cells, to express TrkB-FL, TrkB-T1, or TrkB-FL + TrkB-T1 receptor isoforms in COS-7 cells. The cells were transfected and treated with neurotrophins and thereafter (see methods), cell lysates from two independent experiments were analyzed by PAGE and Western blotting.
BDNF → NT-4/5 treatment induced the expression of p-TrkB, TrkB-FL, and TrkB-T1, but TrkB-T1 expression is upregulated and TrkB-FL expression is downregulated when TrkB-FL and TrkB-T1 are coexpressed in COS-7 cells (Figure 5a, 4th column). NT-4/5 → BDNF treatment induced p-TrkB and TrkB-FL expression. When both receptor isoforms were coexpressed in COS-7 cells, NT-4/5 → BDNF treatment activated TrkB in less proportion, as observed by the weak p-TrkB band, and slight expression of TrkB-FL. Note that the phosphorylation level was different from that obtained with BDNF → NT-4/5 treatment (8th column). The phosphorylation level of TrkB was different between BDNF → NT-4/5 and NT-4/5 → BDNF but densitometry analysis did not show statistical significance (Figure 5a, a2). However, the truncated isoform expression was different between BDNF → NT-4/5 and NT-4/5 → BDNF treatments (Figure 5a, a3; T4 = 26, p = 0.029, Mann–Whitney U test).
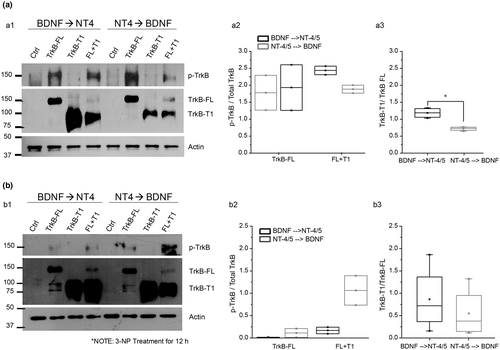
The results obtained after the treatment of cultured COS-7 cells with 3-NP are illustrated in Figure 5b. The cells were incubated for 12 hr with 3-NP and later treated with BDNF → NT-4/5 or NT-4/5 → BDNF.
3-NP-treated COS-7 cells showed a reduction in the expression of p-TrkB after BDNF → NT-4/5 or NT-4/5 → BDNF treatment compared with untreated-COS-7 cells (Figure 5a vs. 5b). The reduction in p-TrkB was a specific consequence of 3-NP treatment and was indicative of poor activation of TrkB in the presence of neurotrophins.
The expression of the TrkB-FL band was obtained in the presence of BDNF → NT-4/5 or NT-4/5 → BDNF when the TrkB-FL isoform was transfected alone (2nd and 6th columns, Figure 5b), but when both the FL and T1 isoforms were cotransfected, pale bands were observed (4th and 8th columns, Figure 5b). Interestingly, when BDNF → NT-4/5 treatment was administered, an upregulation of the truncated isoform was observed in cells cotransfected with both the FL and T1 isoforms (column 4, Figure 5b, b1) that coincided with reductions in p-TrkB and TrkB-FL, consistent with an antagonistic effect of NT-4/5. The upregulation of the truncated isoform was not present as much in cells subjected to the NT-4/5 → BDNF treatment when the TrkB-FL and TrkB-T1 isoforms were coexpressed, and did not present significant differences between treatments (Figure 5b, b3); instead, there was a slight increase in p-TrkB (8th column, 5B,b1). This result is consistent with the synergistic effect of BDNF in the NT-4/5 → BDNF treatment in the electrophysiology experiments.
4 DISCUSSION
In the present study, we evaluated the modulatory effects of sequential exposure to BDNF and NT-4/5 on corticostriatal synaptic transmission in a toxin model of HD.
Both neurotrophins applied individually increase the amplitude of the corticostriatal synaptic population spike in a HD model but to a lesser extent than they do in healthy striatal tissue. Indeed, 3-NP treatment increases the amount of stimulation needed to produce a threshold response, suggestive of a disconnection of corticostriatal synapses, a phenomenon we have reported before (Mendoza et al., 2014) and occurs in other HD experimental models (Cepeda et al., 2003; Raymond et al., 2011). Dendritic changes, spine loss, and synaptic dysfunction observed in HD models are associated with altered TrkB signaling (Kowianski et al., 2018; Spires et al., 2004; Zuccato & Cattaneo, 2007). For example, in the R6/1 and R6/2 mouse models of HD, striatal TrkB receptor phosphorylation is reduced at tyrosine residues Y705 or Y515 producing deficits in signaling of AKT, ERK1/2, and PLCγ. Interestingly, no changes in the phosphorylation of tyrosine residue Y817 of TrkB in R6/2 and YAC128 mouse models of HD were detected (Nguyen, Rymar, & Sadikot, 2016; Simmons et al., 2013).
Although BDNF and NT-4/5 bind to the same Trk receptor, in the present study their sequential application resulted in either antagonistic (BDNF → NT-4/5) or synergistic (NT-4/5 → BDNF) effect depending on the administration order in the context of striatal degeneration induced by 3-NP.
To determine whether BDNF and NT-4/5 produce their modulatory effects by affecting neurotransmitter release or by affecting postsynaptic receptors, PPR analysis was carried out in each electrophysiological experiment. BDNF and NT-4/5 exerted their individual modulatory effects through presynaptic or postsynaptic mechanisms. However, in the synergistic and antagonistic mechanisms triggered by the sequential application of neurotrophins, the antagonistic effect of NT-4/5 and the synergistic effect of BDNF were mediated by postsynaptic mechanisms.
In a recent study, we demonstrated that NT-4/5 inhibits BDNF by upregulating the truncated isoform of TrkB (Torres-Cruz et al., 2019); in the present study, we investigated the protein expression of different TrkB isoforms in striatal lysates of 3-NP-treated tissue and in a cell line system that enabled better control of receptor expression. We found that mitochondrial inhibition reduced the phosphorylation of TrkB and reduced the expression of TrkB-FL, but did not affect the expression of the TrkB-T1 receptor isoform. Exposure to BDNF → NT-4/5 produces antagonistic effects on corticostriatal transmission by upregulating TrkB-T1, while NT-4/5 → BDNF treatment did not up regulate TrkB-T1 in cells cotransfected with TrkB-FL and TrkB-T1; furthermore, under this experimental condition, p-TrkB level increased. This result explains the synergistic effect of NT-4/5 → BDNF treatment.
4.1 Antagonistic versus synergistic effects of BDNF and NT-4/5 and NT-4/5 → BDNF
BDNF and NT-4/5 exposure produced an antagonistic effect in 3-NP-treated tissue, as the one observed in non-3-NP-treated tissue. Individually, each neurotrophin increased the spike amplitude; however, mitochondrial inhibition lessened the effect of BDNF and NT-4/5 on corticostriatal transmission. The decrease in the modulatory effect of these neurotrophins on corticostriatal synapses is due, in part, to reductions in TrkB expression, as demonstrated through Western blot experiments, and these results are in agreement with our previous studies (Espíndola et al., 2012; Mendoza et al., 2014). BDNF → NT-4/5 exposure antagonized the effects of BDNF in slices from 3-NP-treated mice, in the majority of the experiments, as reported in healthy tissue (Torres-Cruz et al., 2019).
With the COS-7 cell system, we demonstrated that BDNF → NT-4/5 treatment resulted in the downregulation of TrkB-FL and p-TrkB when the TrkB-FL and TrkB-T1 isoforms were coexpressed in COS-7 cells treated with 3-NP (Figure 5b). The antagonistic effect of NT-4/5 can be explained by the stimulation of TrkB-T1 which has been shown to antagonize TrkB-FL activity (Ardelt, Flaris, & Roth, 1994; Biffo, Offenhauser, Carter, & Barde, 1995, Eide et al., 1996; Gupta, You, Gupta, Klistorner, & Graham, 2013; Quarta et al., 2018).
NT-4/5 → BDNF treatment of slices from 3-NP-treated mice produced a synergistic effect on spike amplitude. We assume that when NT-4/5 is not competing with BDNF to stimulate TrkB, it triggers the cellular response responsible for increasing spike amplitude (we have shown that PI3K, MAPK, and PLC are responsible for neurotrophin modulation in corticostriatal transmission; Torres-Cruz et al., 2019). The additive effect of further exposure to BDNF results from BDNF activation of TrkB as observed in WB experiments. In addition, 3-NP treatment causes a morphological disconnection of the corticostriatal pathway and also 3-NP reduces BDNF levels (Mendoza et al., 2014); thus, it should permit NT-4/5 and BDNF to cooperate to stimulate TrkB-FL isoforms. The experiments with COS-7 cells indicate that NT-4/5 → BDNF did not upregulate TrkB-T1 but increased p-TrkB (column 8, 1st and 2nd row, Figure 5b), explaining the synergistic effect of BDNF.
The differential responses to BDNF → NT-4/5 and NT-4/5 → BDNF exposure show that these neurotrophins elicit specific responses by interacting with specific TrkB isoforms, which in turn activate multiple signaling pathways. In the context of striatal pathology more attention should be paid to TrkB isoforms, especially because the overexpression of TrkB-FL receptor improves neural survival in an HD model (Silva et al., 2015). Moreover, while the expression of the TrkB-FL receptor regulates gene expression related to plasticity (Koponen et al., 2004), the overexpression of TrkB.T1 inhibits synaptic plasticity (Li et al., 1988). Truncated TrkB.T1 receptor is a regulator of TrkB-FL signaling (Biffo et al., 1995). Further experiments are necessary to understand the physiological role of the truncated isoforms in the healthy and degenerated striatum, especially because this TrkB receptor isoform is highly expressed in the adult brain.
We don't know why NT-4/5 is more prone to stimulate TrkB-T1. The role of NT-4/5 in striatal physiology of HD has not been explored in detail. Our results suggest that NT-4/5 inhibits BDNF modulatory effects; this antagonistic effect has not been described previously in HD. Most of the studies indicate that BDNF and NT-4/5 exhibit similar effects; however, they can activate the same receptor but in different regions, which produces diverse physiological responses (Fan et al., 2000; Minichiello et al., 1998; Proenca, Song, & Lee, 2016).
We evaluated if p75 receptor had a role in the antagonistic or synergistic effect observed in our experiments. However, p75 did not change under neurotrophin treatments, although it was upregulated with the 3-NP treatment and significant differences were found under NT-4/5 → BDNF treatment between non-3-NP-treated tissue and 3-NP-treated tissue. Further experiments will be necessary to understand if the upregulation of p75 has other physiological roles. The increase in p75 has been associated with apoptosis in excitotoxicity (Hanbury et al., 2002; Nykjaer, Willnow, & Petersen, 2005; Underwood & Coulson, 2008), and we have documented its augmentation in our model of striatal degeneration (Espíndola et al., 2012).
4.2 Mitochondrial inhibition alters the expression of TrkB
In vivo inhibition of mitochondrial complex II with 3-NP produces oxidative stress, mitochondrial dysfunction (Alston, Mela, & Bright, 1977; Beal et al., 1993; Brouillet et al., 1999; Coles et al., 1979; Gu et al., 1996; Rodriguez et al., 2010), as well as structural modifications of corticostriatal synapses, which cause anatomical and physiological disturbances such as reductions in the number of dendritic spines on MSNs (Mendoza et al., 2014), in which glutamate receptors are densely located (Deshpande et al., 2006; Nishino et al., 1997). In addition, 3-NP treatment reduces TrkB receptors in the striatum (Espíndola et al., 2012; Mendoza et al., 2014). In this study, we demonstrated that mitochondrial inhibition alters the expression of TrkB isoforms, modifying the modulation of synaptic activity, which is relevant to understanding HD pathophysiology as well as other neurodegenerative disorders that present with mitochondria dysfunction.
DECLARATION OF TRANSPARENCY
The authors, reviewers, and editors affirm that in accordance with the policies set by the Journal of Neuroscience Research, this manuscript presents an accurate and transparent account of the study being reported and that all critical details describing the methods and results are present.
ACKNOWLEDGMENTS
This study was supported by CONACyT Grants 255224 to FGS and 180660 to EHE, DGAPA-PAPIIT IN216515, and PAPCA Grants to EHE. FM Torres Cruz is a postdoctoral trainee and receives a fellowship from the Programa de Becas Posdoctorales de la DGAPA-UNAM
CONFLICT OF INTEREST
There is no conflict of interest.
AUTHOR CONTRIBUTIONS
Conceptualization, F.G. and E.H.; Formal Analysis, F.M.T., E.M., I.C.V., and E.H.; Writing – Original Draft, E.H.; Funding Acquisition, F.G. and E.H.
Open Research
DATA AVAILABILITY STATEMENT
The data that support the findings of this study are available on request from the corresponding author.


