Circadian dysfunction in the Q175 model of Huntington's disease: Network analysis
Abstract
Disturbances in sleep/wake cycle are a common complaint of individuals with Huntington's disease (HD) and are displayed by HD mouse models. The underlying mechanisms, including the possible role of the circadian timing system, have been the topic of a number of recent studies. The (z)Q175 mouse is a knock-in model in which the human exon 1 sequence of the huntingtin gene is inserted into the mouse DNA with approximately 190 CAG repeats. Among the numerous models available, the heterozygous Q175 offers strong construct validity with a single copy of the mutation, genetic precision of the insertion and control of mutation copy number. In this review, we will summarize the evidence that this model exhibits disrupted diurnal and circadian rhythms in locomotor activity. We found overwhelming evidence for autonomic dysfunction including blunted daily rhythms in heart rate and core body temperature (CBT), reduced heart rate variability, and almost a complete failure of the sympathetic arm of the autonomic nervous system to function during the baroreceptor reflex. Mechanistically, the Q175 mouse model exhibits deficits in the neural output of the central circadian clock, the suprachiasmatic nucleus along with an enhancement of at least one type of potassium current in these neurons. Finally, we report a novel network analysis examining the phase coherence between activity, CBT, and cardiovascular measures. Such analyses found that even young Q175 mutants (heterozygous or homozygous) show coherence degradation, and suggests that loss of phase coherence is a variable that should be considered as a possible biomarker for HD.
Significance
Here, we summarize evidence that several of the phenotypes of the Q175 line were found to vary with a diurnal and circadian phase dependence. Thus, the time of measurement and the circadian cycle should be considered a critical factor in the expression and assessment of HD symptoms. The Q175 mouse model of HD exhibits cardiovascular symptoms similar to those seen in HD patients with a prominent sympathetic dysfunction during the resting phase. This line of mice provides a suitable model for preclinical studies of therapeutics designed to prolong the health span in HD. A network analysis found evidence for disrupted phase coherence between activity, core body temperature, and cardiovascular measures even in young Q175 mutants. This result suggests that loss of phase coherence is a variable that should be considered as a possible biomarker for HD.
1 INTRODUCTION
1.1 Huntington's disease is a genetically determined neurodegenerative disease
Huntington's disease (HD) patients suffer from a progressive neurodegenerative disorder that inflicts cognitive, psychiatric, and motor impairments (Bates et al., 2015; McColgan & Tabrizi, 2018). HD is caused by a CAG repeat expansion within the first exon of the huntingtin (HTT) gene, which produces a polyglutamine repeat leading to protein misfolding, soluble aggregates, and inclusion bodies (Ciammola et al., 2006; Saft et al., 2005). The normal function of the protein (Huntingtin) is unknown; however, the mutated form leads to dysfunction of a broad range of cellular processes including cytoskeletal organization, metabolism, and transcriptional activities. Based on the broad distribution of the HTT, the mutation would be expected to produce symptoms throughout the body. Indeed, recent work suggests HD is a systemic illness affecting the entire body and data from animal studies imply that core features of the disease can be modified by treatments targeting other tissues besides the central nervous system (Carroll, Bates, Steffan, Saft, & Tabrizi, 2015).
1.2 Sleep and circadian dysfunction are an integral component of Huntington's disease pathophysiology
Sleep disorders are prevalent in HD patients and have detrimental effects on the daily functioning and quality of life of patients and their caregivers (Goodman et al., 2011; Morton et al., 2005). The most common symptoms include a delay in sleep onset, fragmented sleep during the night, and daytime sleepiness. Importantly, these disruptions in the sleep/wake cycle occur early in the disease progression and so could serve as a biomarker for HD as well as a target for interventions. The sleep/wake cycle is conceptualized as being driven by two anatomically distinct processes: a homeostatic sleep mechanism (process S) as well as by the circadian timing system (process C). To date, there is little evidence that HD impacts sleep homeostasis in patients, but there is growing evidence for HD-driven disruption in circadian timing. Still, it is difficult to determine whether the disease alters the circadian timing system in humans and animal models provide critical insights.
To further preclinical research, a large number of animal models of HD have been developed, each with strengths and weaknesses (Rangel-Barajas & Rebec, 2018). These models display a rapid and progressive breakdown of the circadian rest/activity cycle with close resemblance to the human conditions, e.g., loss of consolidated sleep, increased activity during the rest phase, and sleepiness during wake (Table 1). Importantly, these disruptions are present whether the animals are held under the regular light/dark (LD) cycle or in constant darkness (DD). The latter is critical to identify a compromised circadian system. Disorganized circadian timing alters the function of key organ systems throughout the body (Colwell, 2015). Collectively this prior research supports the hypothesis that circadian dysfunction should be recognized as an integral component of HD pathophysiology. Here, we summarize our progress using Q175 line of mice to explore the role of circadian system in HD and describe findings obtained by carrying out a computational/network analysis of our published data.
| Phenotype | Models | Citations |
|---|---|---|
| Low amplitude activity rhythms | R6/2, BACHD, Q175, HD rats, HD sheep | Morton et al. (2005); Bode et al. (2009); Kudo et al. (2011); Oakeshott et al. (2011); Balci et al. (2013); Loh et al. (2013); Morton et al. (2014); Kuljis et al. (2016) |
| Hypoactivity during active phase | BACHD, Q175, | Morton et al. (2005); Kudo et al. (2011); Loh et al. (2013); Kuljis et al. (2016) |
| Hyperactivity during rest phase | BACHD, Q175 | Kudo et al. (2011); Loh et al. (2013); Kuljis et al. (2016) |
| Increase in cycle to cycle variation | BACHD, Q175 | Kudo et al. (2011); Loh et al. (2013); Kuljis et al. (2016) |
| Disrupted rhythms in sleep, sleep fragmentation | R6/2, R6/1, Q175 | Fisher et al. (2013); Kantor et al. (2013); Loh et al. (2013); Lebreton, Cayzac, Pietropaolo, Jeantet, and Cho (2015); Fisher et al. (2016) |
| Low amplitude rhythms in autonomic driven rhythms in heart rate, core body temperature | R6/1, R6/2, BACHD, Q175 | Kudo et al. (2011); Kiriazis et al. (2012); Mielcarek et al. (2014); Schroeder et al. (2016); Cutler et al. (2017) |
| Disrupted rhythms in hormones | R6/2 | Dufour and McBride (2016); Rudenko et al. (2019) |
| Loss of melanopsin-expressing retinal ganglia cells that carry light information to the central circadian clock (SCN) | R6/2, N171-82Q | Ouk et al. (2016); Lin et al. (2019) |
| Disrupted rhythms in electrical activity in the SCN | BACHD, Q175 | Kuljis et al. (2016); Kuljis et al. (2018) |
| Disrupted gene expression rhythms in central clock | R6/2 | Morton et al. (2005) |
| Disrupted gene expression rhythms outside SCN | R6/2 | Morton et al. (2005); Maywood et al. (2010) |
| Pathology in central clock | R6/2, BACHD | Fahrenkrug, Popovic, Georg, Brundin, and Hannibal (2007); Kuljis et al. (2016) |
| Circadian-based treatments improving function | R6/2, BACHD, Q175 | Pallier et al. (2007); Maywood et al. (2010); Cuesta et al. (2014); Skillings, Wood, and Morton (2014); Wang et al. (2017); Whittaker et al. (2017); Wang et al. (2018) |
2 METHODS
The methods and raw data used in this study have been previously published (Cutler et al., 2017; Kuljis, Kudo, Tahara, Ghiani, & Colwell, 2018; Loh, Kudo, Truong, Wu, & Colwell, 2013). In the present study, we re-analyzed this prior work using new standards of statistical analysis and graphical representation of the data.
2.1 Animals
All the experimental protocols used to collect the data presented in this report were approved by the UCLA Animal Research Committee, and followed the guidelines and recommendations for animal use and welfare set by the UCLA Division of Laboratory Animal Medicine and National Institutes of Health. Data were collected using mice homozygous (Hom) and heterozygous (Het) for the Q175 allele as well as wild types (WT) from 3 to 12 months of age. The Q175 mice arose from a spontaneous expansion of the CAG repeat in the CAG140 transgenic knock-in line (Menalled et al., 2012) and have around 190 CAG repeats. Mutant mice were obtained from the Jackson Laboratory (Bar Harbor, Maine) from a colony managed by the CHDI Foundation. Only male mice were used in this study as female mice exhibit a delay in the expression of the symptoms (Kuljis et al., 2016). Genotyping was performed at 15 days of age by tail snips, and after weaning, littermates were group housed by sex. All animals were housed in sound proof, humidity-controlled chambers with controlled lighting conditions, using a 12 hr light, 12 hr dark cycle (12:12 LD, intensity 300 lux) for at least 2 weeks prior to experimentation.
2.2 Modeling
Telemetry data were collected from the same mice when they were young (3–6 months-old, mo) and middle age (9–12 mo) under constant dark (DD) conditions. The analysis examined five variables in each recording, all binned to means of 20 s intervals: heart rate (HR), heart rate variability (HRV), R-R interval (RR), core body temperature (CBT), and locomotor activity (Act). Missing data were impugned using a linear interpolation. Data were then transformed into Z-scores for each individual in each age group.
Frequency characteristics of each variable within each individual were generated using wavelet transformations (Leise, 2013; Smarr, Grant, Zucker, Prendergast, & Kriegsfeld, 2017) which were then compared using wavelet coherence (Chang & Glover, 2010). Briefly, wavelet transforms provide frequency-by-time information for non-stationary signals (those with inconstant frequency); this is as opposed to a Fourier transform, which lacks temporal resolution. Here, we used a morlet wavelet, which is appropriate because it has an established history of use in distinguishing circadian and ultradian changes in rodents and humans (Leise, 2013; Smarr et al., 2017; Smarr, Zucker, & Kriegsfeld, 2016). Wavelet coherence is a method to compare wavelet transforms of two different variables, providing a measure of how much change in frequency strength at a given time in one corresponds to similar change in the other—how coherent are the two signals, as measured by frequency-by-time. Wavelet transforms were run for all individuals for all variables, and ultradian bands were extracted by taking the timepoint-by-timepoint median power across all frequencies between 2 and 5 hr, creating an average power of ultradian frequency per time. Ultradian bands of each pair of variables were then compared by wavelet coherence, and the circadian band of coherence was then extracted by taking the timepoint-by-timepoint median power across all frequencies between 23 and 25 hr, creating an average power of circadian frequency per time. This, in summary, generated a quantitative measure of the extent to which ultradian rhythms for each pair of variables within an individual are being similarly modulated by the time of day.
Networks were constructed of nodes connected by edges. Each variable was defined as a node, or intersection point on the network. Edges were then defined by connecting each unique variable pair with an edge of weight equal to the sum over time of power of the pair's circadian coherence band. Network graphs were created for each individual at each age, and group representative networks were constructed using the medians of these edge weights. Edge weights were then normalized across all 6 graphs (3 genotypes × 2 ages) so that colors could be assigned by relative edge weight to allow for visual comparison across graphs.
2.3 Statistical analysis
Statistical significance for the behavioral and physiological experiments was determined by two-way analysis of variance (ANOVA) with genotype (WT, Het Q175, Hom Q175) and time as factors. If the data did not exhibit a normal distribution, a two-way ANOVA on ranks was used. Post hoc t test was applied to determine significant differences when appropriate. If the measurements were obtained at only one age, we used one-way ANOVA followed by Bonferroni's multiple comparison test or one-way ANOVA on ranks. Statistical analyses were performed using the SigmaStat statistical software (San Jose, CA). Values are reported as the mean ± standard deviation (SD).
For network analyses, comparisons of average graph edge weights by condition, as well as within-individual comparisons of specific edge-weight change with age, were accomplished using the Kruskal–Wallis nonparametric test. Post hoc nonparametric rank-sum tests were adjusted for multiple comparisons by the Bonferroni method. Nonparametric tests were chosen to avoid assumptions of normality. For the specific edge-weight change with age of RR-CBT, a centroid was calculated as the center of weight of a k-means cluster defined by the WT distribution, and geometric distance from that centroid was then calculated for each individual.
3 RESULTS AND DISCUSSION
When looking for possible circadian dysfunction in mouse models, the first analysis is commonly measurement of locomotor activity rhythms when mice are held in constant darkness using 24/7 automated monitoring. These rhythms are most commonly recorded under conditions in which the mouse has the opportunity to run on a wheel and thus represent voluntary motor activity. We commonly measure period, phase, fragmentation, and amplitude of the rhythms. For circadian biologists seeking to understand the mechanisms underlying the molecular clock, the measurement of circadian period has proven to be the most reliable phenotype (Takahashi, Shimomura, & Kumar, 2008). However, disease processes do not seem to target the core molecular clock mechanisms but instead impact the parameters of phase, fragmentation (or coherence), and amplitude. These parameters can be influenced by processes downstream of the core circadian clock and are more vulnerable to disruption.
3.1 Decline in circadian rhythms of wheel running activity
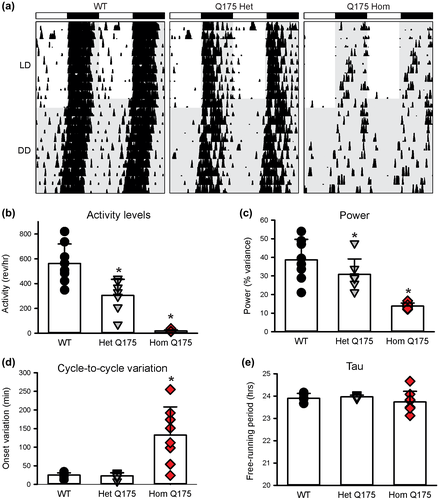
In the previous work, we used wheel-running activity to characterize the impact of the Q175 mutation on circadian locomotor activity from 3 to 12 months of age (Loh et al., 2013). Measured parameters from young (3–6 mo) homozygous (Hom) and heterozygous (Het) Q175 mutant mice were not significantly different from their WT counterparts, showing equally consolidated and precise rhythms in activity that were nocturnal in nature under 12:12 light dark (LD) or constant dark (DD) conditions (Loh et al., 2013). However, as the mice aged, the strength of the rhythm (power) declined sharply in the Q175 Hom mice, and by middle age (9–12 mo), circadian dysfunction was apparent (Figure 1a). Quantification of the wheel-running activity measured in DD at 12 mo of age (one-way AVOVA on Ranks, Figure 1b–e) found significant differences in the activity levels (H = 18.354, p < 0.001), power (H = 15.839, p < 0.001), and cycle-to-cycle variation in the activity onset (H = 10.978, p = 0.04). The Q175 Het exhibited a much less impacted age-related decline in activity levels and power, suggesting an effect of gene dosage (Loh et al., 2013; Figure 1). A variety of studies has now demonstrated that four distinct HD models exhibit a progressive and rapid breakdown of the circadian rest/activity cycle (Bode et al., 2009; Kudo et al., 2011; Loh et al., 2013; Morton et al., 2005; Oakeshott et al., 2011). These assays have the advantage that the mice are undisturbed in their home cages during the test and circadian disruption occurs early in disease progression. While these changes were concomitant with a decline in general locomotor activity, it is critical to note that precision of the daily onset of activity also deteriorated at the same time, suggesting that the circadian disruption is not simply due to motor dysfunction. To the best of our knowledge, the decline in precision and power of rhythms is indicative of an intrinsically weaker circadian oscillator whereas a reduction in the amount of activity is more likely driven by a weaker motor system. The cycle-length (tau) of the activity rhythms was not affected by the mutation implying that the core molecular feedback loop driving circadian oscillations is still functional. Nevertheless, we feel that these data indicate that circadian disruption of locomotor activity provides a sensitive marker of disease progression.
In order to function adaptively, the circadian timing system must be synchronized to the environment and timing of light is particularly important for this entrainment. The Q175 line did show some deficits in the light-response by middle age (Loh et al., 2013). For example, the Hom Q175 mice were more active in the light than is typical for a nocturnal organism and; in an LD cycle, the mutant mice exhibited high levels of cycle-to-cycle variability, whereas WT mice exhibit precise activity onset. Intrinsically photosensitive retinal ganglion cells (ipRGCs), which express the photopigment melanopsin, are photosensitive neurons in the retina and are essential for circadian synchronization (e.g., Schmidt, Chen, & Hattar, 2011). Five subtypes of ipRGCs (M1–M5) have been identified in mice and recent work suggests that the M1 subtype is reduced in other HD models (R6/2 and N171-82Q) prior to the onset of motor deficits (Lin et al., 2019; Ouk, Hughes, Pothecary, Peirson, & Morton, 2016). The reduced innervation of M1 ipRGCs is likely to contribute to a diminished light-induction of c-fos in the central clock, the suprachiasmatic nucleus (SCN), which may explain the impaired circadian light response in these HD mice. Based on these data, we expect that we would ultimately detect loss of the M1 cell population in the retina of older Q175 mice.
Another important signaling pathway that may be involved in the reduction of the photic regulation of the circadian system is brain-derived neurotrophic factor (BDNF). Deficits in BDNF expression, trafficking, and signaling have been found in tissue from HD patients and HD mouse models (e.g., Smith-Dijak, Sepers, & Raymond, 2019; Zuccato & Cattaneo, 2007). BDNF also appears to be an important regulator of synaptic input into the SCN. The transcriptional repressor methyl-CpG-binding protein 2 (MECP2) is expressed in the SCN and this Bdnf regulator is phosphorylated in response to light (Zhou et al., 2006). Both BDNF and its high-affinity tropomyosin-related receptor kinase (TrkB) receptor are expressed in the SCN (Allen & Earnest, 2005; Baba, Ono, Honma, & Honma, 2008; Liang, Sohrabji, Miranda, Earnest, & Earnest, 1998). Physiological data have demonstrated that BDNF and neurotrophin receptors can enhance glutamatergic synaptic transmission within a subset of SCN neurons (Kim, Choi, & Colwell, 2006) and potentiate glutamate-induced phase shifts of the circadian rhythm of neural activity in the SCN (Michel, Clark, Ding, & Colwell, 2006). Functionally, both BDNF- and TrkB-deficient mice exhibit a reduction in the behavioral effects of light on the circadian system (Allen, Qu, & Earnest, 2005; Liang, Allen, & Earnest, 2000). Therefore, an HD-driven reduction in BDNF would be expected to disrupt photic regulation of the circadian system.
3.2 Deficits in temporal patterning of sleep
The circadian system is intimately involved in the control of the temporal patterning of sleep, although apparently not in the homeostatic regulation of sleep (e.g., Eban-Rothschild, Giardino, & de Lecea, 2017). Next, we used video recording to measure sleep as defined by time spent immobile, in combination with automated mouse tracking analysis software (Loh et al., 2013). The 6-hr bins of hourly immobility-defined sleep in mice held in DD clearly showed a decline in the amount of total sleep per cycle in the middle age Q175 Hom mice (Figure 2a) with a significant effect of both genotype (F2,91 = 15.375, p < 0.001) and time (F3,91 = 63.072, p < 0.001). In particular, the Hom Q175 mutants spent less time sleeping throughout the circadian cycle (Figure 2b; one-way ANOVA, F2,21 = 10.174, p < 0.001) and specifically slept less during the subjective day (CT 0–5 & 6–11, Figure 2c; one-way ANOVA, F2,21 = 13.351, p = 0.001), and no significant changes were observed during the subjective night (data not shown). To examine sleep quality in the Q175 model, fragmentation analysis was performed to determine the number of sleep bouts and the average duration during both the (subjective) day and night. At 9–12 mo, increased fragmentation became apparent with more sleep bouts of a shorter average duration in the Hom Q175 mutant (Loh et al., 2013). Hence, Q175 mutation appears to selectively impact daytime sleep in the Hom mutants, with a specific reduction of the amount of time spent asleep, as well as increased fragmentation of an already reduced sleep.
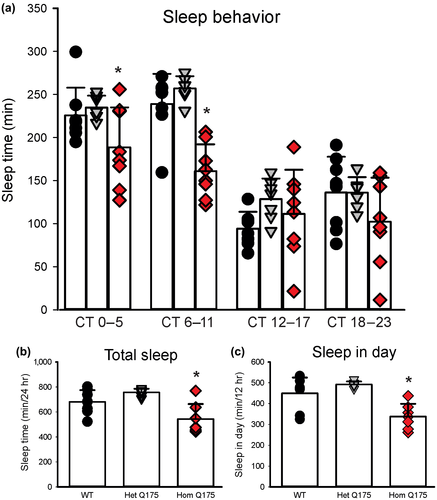
In the video-based assay that is independent of the animal's ability to turn a wheel, we found that daytime sleep was selectively affected by the Q175 mutation. While video analysis of sleep does not allow us to draw conclusions regarding the depth of sleep nor the relative progression from one state of sleep to another (e.g., NREM vs. REM), such measurements have been shown to accurately measure sleep and to highly correlate with simultaneously recorded electroencephalogram (EEG)-defined sleep (Fisher et al., 2012). Prior work has carefully characterized age-related changes in the EEG of both Hom and Het Q175 (Fisher et al., 2016). The Q175 mice exhibited disrupted EEG starting at 4 mo of age providing clear evidence that the EEG can serve as an early biomarker in these models. However, there was no effect of genotype on the high amplitude delta waves (0.5–4 Hz) associated with slow-wave sleep (SWS) or in sleep time in response to sleep deprivation. Therefore, the circadian behavior and physiological rhythms were disrupted, while the sleep homeostatic mechanisms remain intact. In the R6/2 model, EEG-defined sleep showed strong fragmentation of the sleep/wake cycle and significant changes in the neural oscillatory patterns that can be seen on an EEG (Fisher et al., 2013; Kantor, Szabo, Varga, Cuesta, & Morton, 2013). In response to a homeostatic challenge, the R6/2 line did show deficits in recovery sleep (Fisher et al., 2013). The increase in sleep fragmentation is commonly associated with the sleep disturbances observed in HD patients (e.g., Goodman et al., 2011) and there is growing appreciation that quantitative EEG may serve as a biomarker for HD (Leuchter et al., 2017; Odish, Johnsen, van Someren, Roos, & van Dijk, 2018).
3.3 Deficits in generalized activity as measured by telemetry
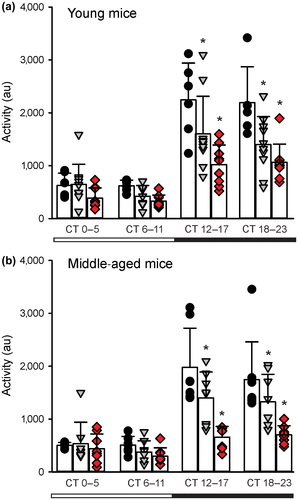
We examined the circadian rhythms in general activity in young and middle-aged Q175 mice by continuously monitoring the animals with a telemetry system (Cutler et al., 2017). Telemetry measurements of activity would record all movements as compared to running wheels that only capture voluntary motor activity. This sensitive method detected significant effects of both age and gene dosage, and most importantly, deficits in nocturnal activity even in the Het and Hom young mice in DD (Figure 3a). Analysis of the activity with two-way ANOVA found significant effects of genotype (F2,99 = 20.412, p < 0.001) and time (F3,99 = 50.875, p < 0.001). These deficits were dramatically accentuated in the middle-aged mutants (Figure 3b) with significant effects of both genotype (F2,91 = 20.772, p < 0.001) and time (F3,99 = 35.704, p < 0.001). At both ages, the most significant changes were observed during the active phase (subjective night, CT 12–17 and 18–23).
3.4 Difficulty in maintaining CBT
The circadian clock in the SCN regulates daily rhythms in CBT and these rhythms offer a fairly direct measure of SCN output (Szymusiak, 2018). The circadian rhythms in CBT are independent of locomotor activity but dependent on an intact SCN (Ruby, Dark, Burns, Heller, & Zucker, 2002; Scheer, Pirovano, Someren, & Buijs, 2005; Stephan & Nunez, 1977). The SCN projects to the dorsal subparaventricular zone (SPZ; Leak & Moore, 2001), which is necessary for driving circadian rhythms of body temperature (Lu et al., 2001). We used telemetry to examine circadian rhythms in CBT in young and middle-aged Q175 mice (Cutler et al., 2017). Under DD conditions, the measurements of CBT obtained by telemetry showed the expected rhythms with higher body temperature during the active phase in the young Q175 mutant mice and their WT counterparts (Figure 4a), with a significant effect of time (F3,99 = 248.655, p < 0.001) but not of genotype (F2,99 = 0.268, p = 0.765). By middle age, both genotype (F2,91 = 17.236, p < 0.001) and time (F3,91 = 65.568, p < 0.001; Figure 4b) had a significant effect on CBT rhythm. In particular, the Hom Q175 exhibited difficulty in maintaining the body temperature in the first half of the day (subjective day, CT 0–5). The HD mutants presented with hypothermic episodes during which they failed to maintain their body temperature. Overall, the Q175 seemed to lack the capability to regulate their CBT and this problem emerged early in the Hom Q175 and was more pronounced by middle age.
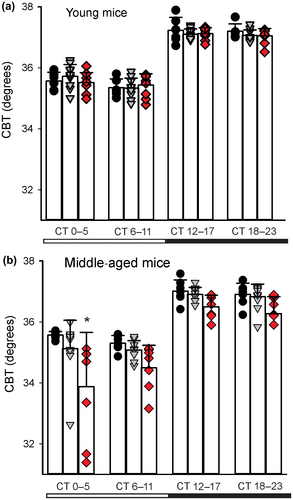
The circadian timing system is intimately linked to metabolism at a cellular, molecular, and system level (Bass & Takahashi, 2010; Panda, 2016; Reinke & Asher, 2019). One of the most dramatic daily rhythms in the body is the feeding/fasting cycle in which an organism has a number of hours with abundant glucose followed by hours without. The circadian system regulates ingestive behaviors, the metabolic systems by which the food is processed, as well as the sleep/wake cycle. Thus, the circadian clock coordinates appropriate metabolic responses within peripheral tissues with the LD cycle. For example, the liver clock promotes gluconeogenesis and glycogenolysis during the sleep/fasting period, while fostering glycogen and cholesterol synthesis during the wake/feeding period. The CBT measures suggest that the circadian regulation of metabolism is compromised in the Q175 line and fits with prior work that demonstrated that HD patients as well as the Q175 mice have deficits in the tricarboxylic acid cycle (Naseri et al., 2015) responsible for the production of ATP. The diurnal variation in CBT was also attenuated in the R6/2 (Fisher et al., 2013) and BACHD mice (Kudo et al., 2011). Like the Q175 mutants, the R6/2 mice also exhibited episodes of hypothermia, particularly evident in the dark period. Overall, there is strong evidence for mitochondrial dysfunction in HD as well as in other neurodegenerative diseases (Carmo, Naia, Lopes, & Rego, 2018; Dubinsky, 2017; Franco-Iborra, Vila, & Perier, 2018; Kuhl et al., 1982; Naseri et al., 2015). Unintended weight loss is a hallmark of HD patients and a recent study found that a high body mass index (BMI) is associated with a significantly slower rate of functional, motor, and cognitive deterioration (van der Burg et al., 2017). Altogether, these findings justify further analysis of the links between circadian rhythms and metabolism in the context of HD.
3.5 Deficits in rhythms in heart rate as well as in heart rate variability
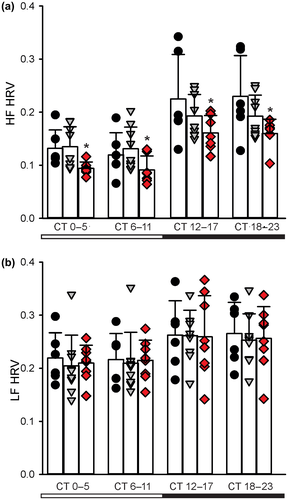
In nocturnal mice, diurnal and circadian cardiovascular output peak in the night when the mice are active. While influenced by activity levels, the rhythms occur even when measured in windows of time when the mice were inactive. We recorded HR when the animals were physically inactive, i.e., the resting HR (Cutler et al., 2017). The WT and young Q175 mutant mice again showed similar rhythms in DD (Figure 5a), again with no effect of genotype (F2,99 = 2.429, p = 0.094) but a significant effect of time (F3,99 = 307.788, p < 0.001). By middle age (Figure 5b), we detected lower resting HR in the Hom Q175 kept in DD with significant effects of both genotype (F2,91 = 7.001, p = 0.002) and time (F3,91 = 25.035, p < 0.001). To further explore a possible autonomic dysfunction in the Q175 line, we measured HRV throughout the 24-hr cycle. HRV measures the variability of the time between individual heartbeats and reflects the balance of sympathovagal signals to the heart. High HRV is associated with cardiovascular health, while low HRV is a sign of poor cardiovascular function. We observed the normal high HRV during the day and lower HRV at night (Figure 6) in WT mice. Conversely, the HRV was abnormally low in the HD mutants (Hom & Het) and this damping was largest during the sleep phases (CT 0–11). HRV measures were separated into low frequency (LF, 0.2–1.5 Hz) and high frequency (HF, 1.5–4.0 Hz) bands, which are commonly used to quantify parasympathetic and sympathetic regulation, respectively (Campen, Tagaito, Jenkins, Balbir, & O'Donnell, 2005). The power of the HF band was highly disrupted in the middle-aged Hom Q175 (Figure 6a) exhibiting significant effects of both genotype (F2,91 = 9.396, p < 0.001) and time (F3,91 = 21.818, p < 0.001). In contrast, there were no differences in the power of the LF band (Figure 6b) with genotype (F2,91 = 0.186, p = 0.831) but there were significant differences with time (F3,91 = 5.575, p = 0.002). These results clearly demonstrate that the temporal patterning as well as the overall level of autonomic regulation of the cardiovascular system is compromised in Q175 mice.
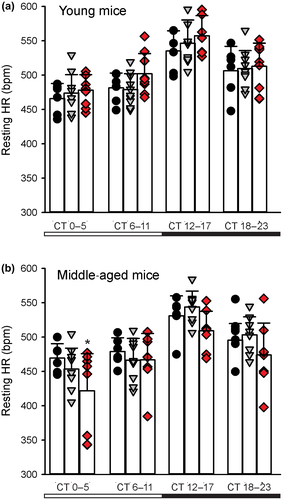
Diurnal and circadian rhythms in HR are also disrupted in the BACHD, R6/1, R6/2 lines of mice (Kudo et al., 2011; Mihm et al., 2007; Schroeder et al., 2016; Wood et al., 2012). In agreement, we saw evidence in the BACHD line of the circadian system failing to lower blood pressure (BP) during sleep (Schroeder, Loh, Jordan, Roos, & Colwell, 2011). The HR rhythms in R6/1 mice are disrupted with the mutants showing a higher HR than WT littermates as young adults but ultimately exhibiting low HR later in life (Kiriazis et al., 2012). In two other HD models (R6/2 and HdhQ150 lines), the HR was significantly reduced in symptomatic mice (Mielcarek et al., 2014). Altogether, data from several studies using different mouse models all found overlapping evidence for disrupted diurnal or circadian rhythms of HR. To the best of our knowledge, the question of whether the rhythms in HR and BP are disrupted has not been examined in HD patients. The preclinical data suggest that the disruptions are most likely to occur at the beginning of sleep and can be difficult to diagnose. Office visits are unlikely to coincide with the expression of hypertension. This type of “masked” or nocturnal hypertension is associated with poor clinical outcomes as the symptoms are likely to be untreated and patients frequently develop organ damage prior to transitioning to sustained hypertension which can be detected (Bowles, Thosar, Herzig, & Shea, 2018; Franklin, O'Brien, & Staessen, 2017). Based on these data, HD patients should be strong candidates for 24-hr BP monitoring, which is the best method for uncovering this type of hypertension.
A decrease in HRV has also been reported during the pre-symptomatic and early stages of HD progression (Andrich et al., 2002; Bär et al., 2008; Kobal, Meglic, Mesec, & Peterlin, 2004; Kobal et al., 2010). Prior studies reported HRV deficits during the Valsalva maneuver, hand-grip and head up tilt tests in HD patients (Aminoff & Gross, 1974; Bär et al., 2008; Den Heijer et al., 1988; Sharma et al., 1999). To the best of our knowledge, spectral power analysis has not been carried out on data from patients. In human subjects, HRV changes with daily cycle and with sleep state (Boudreau, Yeh, Dumont, & Boivin, 2013) but we do not have the data from HD patients. Thus, both the preclinical and clinical work is consistent with a disruption in the sympathetic branch early in disease progression that is reflected as a decreased HRV.
3.6 Deficits in neural activity in the suprachiasmatic nucleus
The central circadian clock is the SCN of the hypothalamus, the rhythmic output of which drives rhythms in locomotor activity, sleep, and the autonomic nervous system (Kalsbeek et al., 2006; Mohawk, Green, & Takahashi, 2012). Rhythmic spontaneous firing rates (SFRs) are an intrinsic property of individual SCN neurons (Webb, Angelo, Huettner, & Herzog, 2009) and are always high during the day in both diurnal and nocturnal species. These SFRs are driven by the rhythmic expression of ionic currents that depolarize the neuronal membrane potential toward the action potential threshold during the day and hyperpolarize the membrane potential to silence neurons at night (Allen, Nitabach, & Colwell, 2017). Normally, dSCN neurons exhibit high SFRs during the day and low SFRs during the night, but Het and Hom (6–7 mo) Q175 dSCN neurons displayed low SFRs both during the day and the night (Kuljis et al., 2018; Figure 7a). This dysfunction was significantly affected by both genotype (F2,117 = 6.309, p = 0.003) and time (F1,117 = 6.116, p = 0.015). One of the key potassium (K+) currents regulating AP frequency as well as hyperpolarizing the membrane at night is the large-conductance calcium-activated potassium (BK) currents (Whitt, Montgomery, & Meredith, 2016). We measured the BK current in the Het Q175 in the daytime and found that the SCN neurons exhibited significantly greater BK current at some voltage steps (Figure 7b). An analysis of the data found effects of genotype (F1,399 = 8.912, p = 0.003) and voltage (F9,399 = 51.786, p < 0.001). In particular, significant effects were seen when the membrane potential was stepped to 60 and 80 mV. Thus, the Q175 HD model exhibits low daytime electrical activity with enhanced BK currents in the SCN.
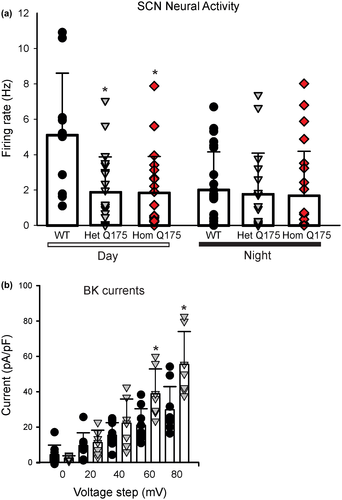
These findings demonstrate that the SCN neurons in the Q175 mouse model exhibit malfunctioning likely triggered, at least in part, by dysregulation of BK current. Prior work has also found some evidence of altered transcription of genes coding for BK channels (Langfelder et al., 2016) in the Q175 line. This study found that mutants had altered expression of Kcnmb2 in the hypothalamus and of Kcnmb4 in cortical tissue. HD-associated transcription dysregulation, including increased CRE-mediated transcription, has previously been shown (Langfelder et al., 2016; Obrietan & Hoyt, 2004; Sugars & Rubinsztein, 2003). CREB is a known positive regulator of BK expression (Wang, Ghezzi, Yin, & Atkinson, 2009) and we have shown alterations in Kcnma1 transcript levels in the BACHD SCN (Kuljis et al., 2018).
A disruption in the neural output from the SCN provides a plausible explanation for the disrupted behavioral and physiological rhythms seen in HD models but, of course, is not yet conclusive. Furthermore, we have shown that the SCN neurons display significantly reduced daytime SFR also in the BACHD line (Kuljis et al., 2018); however, work in the R6/2 model did not find similar firing rate deficits (Pallier et al., 2007; Williams, Morton, & Burdakov, 2011). Instead, it was reported that the R6/2 mice exhibit a reduction in the neural activity in orexin neurons. This cell population in the lateral hypothalamus receives input from the SCN and is a critical regulator of the arousal state (e.g., Arrigoni, Chee, & Fuller, 2018). Therefore, it is not yet clear whether a reduction in daytime firing rate in the SCN is a common feature across these mouse models. Future work should use in vivo recording techniques to measure the neural activity rhythms within the intact SCN at different phases within the daily cycle. Since the mutant mice are behaviorally rhythmic until the late stages of disease progression, we speculate that we will still see a rhythm of neural activity in the mutants, just at a lower amplitude than that measured in WT mice.
In other brain regions, there is evidence for disrupted potassium currents in neurons and astrocytes in HD models (Zhang, Wan, & Tong, 2018). For example, striatal neurons in the R6/2 and Q175 models exhibit increased excitability already before the onset of motor deficits (Sebastianutto, Cenci, & Fieblinger, 2017). These changes are associated with decreased function of inward rectifier and voltage-gated potassium channels. To provide another example, Carrillo-Reid et al. (2019) recently found that the dendrites of the neurons in the striatal indirect pathway are hypoexcitable. This low activity was due to an increased association of dendritic Kv4 potassium channels with auxiliary KChIP subunits and could be reversed by knocking down the Kv4 channels or by just lowering the mutant-Htt (mHtt) levels with a zinc finger protein (Carrillo-Reid et al., 2019). These broader data support our inference that malfunctioning potassium channels in the SCN are responsible for the weakened SCN output.
Aged SCN also exhibits reduced amplitude of SFR rhythms (Farajnia et al., 2012; Nakamura et al., 2011) reminiscent of the phenotype observed in Q175 SCN. Prior work indicates a selective loss of circadian modulation of the fast-delayed rectifier and A-type potassium currents in the aging SCN (Farajnia et al., 2012), as well as loss of circadian modulation of BK channel activity resulting in a reduction of nighttime BK currents (Farajnia, Meijer, & Michel, 2015). Loss of nighttime BK current in aged SCN neurons was associated with diminished AP afterhyperpolarization, depolarized resting membrane potential, widened AP, and increased intracellular calcium levels. While there are clearly differences between the findings in aged WT and Q175 SCN pathophysiology, these findings suggest that alterations in BK currents may be a common path to generate inappropriate neuronal activity in the SCN.
3.7 Network analysis: A different re-analysis of old data
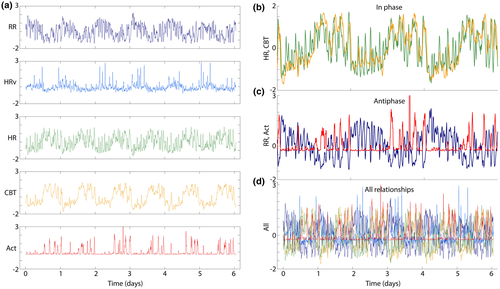
The telemetry recordings allowed the simultaneous measurement of activity, CBT, HR, R-R interval, and HRV from individual mice for 5 days at age 3 months (young), and for another 5 days at age 9 months (aged). Due to the findings of sleep and circadian degradation, we sought to investigate whether degradation might be related to internal desynchrony, or loss of organizational coherence from one physio-behavioral variable to another. We Z-transformed the data to highlight relative timing of change across variables. Visual inspection revealed that each variable was composed of within-a-day ultradian episodes of rapid change, and that these were organized by time-of-day (Figure 8a). Comparison confirmed that in healthy animals, the timing of these ultradian episodes appeared coordinated across variables (Figure 8b). To quantify each individual's internal synchrony, we generated a feature of temporal organization based on the strength of circadian coherence across each pair of variables' ultradian rhythms (see Methods).
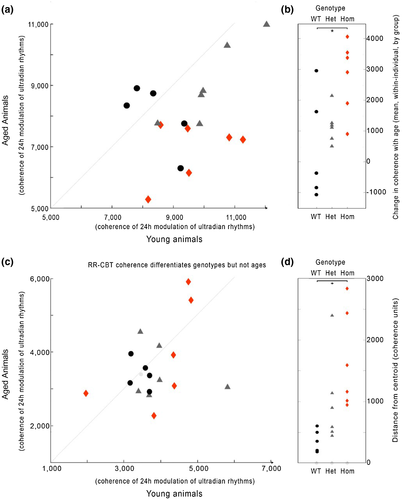
We then used these features to compare internal coordination across each pair of variables, constructing a graph network for each group which captured the average strength of coordination for each pair of variables when young and also when aged, for each genotype (Figure 9). The graphs show coherence as edges (lines, blue is high coherence, red is low) between two nodes (variables at vertices). Each edge is normalized so that edge colors are comparable across all six networks shown. We found a significant difference in overall network coherence (median edge weight) across conditions (χ2 = 23.11, p = 0.0003). Post hoc comparisons revealed that there had been significant decreases in the Het and Hom groups with age, but not in the WT groups (Figure 9b). These effects are visually clear from the networks, but it is also clear that different edges respond differently to condition and age.

Because the network model presents all relationships simultaneously, such network graphs might be useful in guiding future investigations into particular relationships. For example, in the edge RR-HR, there is a significant (and visually clear; χ2 = 6.1, p = 0.048) loss of coherence with age in a Q175 dose-dependent manner (Figure 10a). By contrast, in the edge RR-CBT there is not a significant loss of coherence, but there is an increase in dissimilarity (scattering away from the healthy average) across individuals within each genotype (Figure 10b; χ2 = 10.07, p = 0.0065). These edge-wise comparisons suggest that different mechanisms may be implicated in different forms of progressive physio-behavioral disorganization that arise in HD.
In summary, these data support a coupled oscillator network model of health, in which temporal coordination across systems creates a stable, healthy network, while disorganization leads to loss of wellness. Importantly, these data demonstrate that disorganization also generates a detectable deviation in oscillating signals that can be detected to follow disease progression in groups and in individuals. Additionally, these findings support the idea that information from one measured parameter carries information about other parameters. There may be shared outputs, including HRv, that provide high temporal-resolution information about the entire network through noninvasive means. This type of analysis may provide useful biomarkers for looking at the impact of interventions on HD progression. With the rapid development of wearable technology, we can speculate that we may be able to generate predictive measures of outcome with noninvasive, biologically relevant data gathered continuously within individuals from broad populations.
3.8 Future work
In summary, disturbances in the timing of the sleep/wake cycle are a well-established symptom of HD and commonly present in other neurodegenerative diseases. These behavioral symptoms raise questions about the underlying mechanisms and the possible involvement of the circadian system. Using mouse models (Table 1), we have demonstrated behavioral and physiological circadian disruptions early in disease progression. Notably, these findings do not preclude the involvement of other well-known structures involved in HD, such as the basal ganglia, in eliciting a disrupted circadian output. The dysfunction found in the circadian system of multiple HD models does however raise the question of whether it is possible to ameliorate such symptoms and, in the end, to “treat” HD and other neurodegenerative diseases using environmental manipulations designed to improve circadian rhythms and enhance the sleep/wake cycle by increasing the excitatory drive onto the SCN (Morton, 2013; Schroeder & Colwell, 2013). Prior work using the R6/2 model found that a combination of bright-light therapy and scheduled voluntary exercise was beneficial in delaying disease symptoms (Cuesta, Aungier, & Morton, 2014). We have reported that exposing Q175 mice to a blue-wavelength enhanced lighting (Wang et al., 2017) and time-restricted feeding (Wang et al., 2018) was similarly beneficial in delaying symptom progression. Since behavioral changes may be difficult to implement, it is also important to develop pharmacological treatments. In the Q175 model, timed administration of a histamine receptor type 3 blocker (Whittaker, Wang, Loh, Cachope, & Colwell, 2017) has proven to be beneficial. Hence, preclinical HD models are clearly advantageous for exploring disease mechanisms as well as the impact of circadian treatments and therapies on disease progression.
ACKNOWLEDGMENTS
We would like to acknowledge the excellent training and support from Dr. M. Levine. Besides making many seminal contributions to research into basal ganglia function, Dr. Levine has been an important contributor to the vitality of the UCLA neuroscience community.
CONFLICT OF INTEREST
No conflicting interests exist.
AUTHOR CONTRIBUTIONS
All authors had full access to all the data in the study and take responsibility for the integrity of the data and the accuracy of the data analysis. Conceptualization, B.S., C.S.C.; Methodology, B.S., T.C., D.H.L., T.K., D.K., Investigation, B.S., T.C., D.H.L., T.K., D.K., Formal Analysis, B.S., T.C.; Writing – Original Draft, B.S.; Writing – Review & Editing, C.A.G., C.S.C.; Visualization, C.S.C.; Supervision, L.K., C.S.C.; Funding Acquisition, B.S., L.K., C.S.C.


