Comparative immune profiling in survivors of the 2023 Nipah outbreak in Kerala state, India
Rima R. Sahay and Harsha C. Palav contributed equally to this study.
Abstract
Immune profiling of Nipah virus (NiV) infection survivors is essential for advancing our understanding of NiV pathogenesis, improving diagnostic and therapeutic strategies, and guiding public health efforts to prevent future outbreaks. There is currently limited data available on the immune response to NiV infection. We aimed to elucidate the specific immune mechanisms involved in protection against NiV infection by analyzing the immune profiles of survivors of the Nipah outbreak in Kerala, India 2023. Immune cell populations were quantified and compared between survivors (up to 4 months post onset day of illness) and healthy controls. Statistical analysis was performed to explore associations between immune profiles and clinical outcomes. Immune signatures common to all three cases were: a heretofore undescribed persistent lymphopenia including the CD4+ Treg compartment with the relative expansion of memory Tregs; trends indicative of global leukopenic modulation were observed in monocytes and granulocytes including an expansion of putatively immunosuppressive low-density granulocytes described recently in the context of severe COVID-19; altered mucosal homing with respect to integrin beta-7 (ITGB7) expressing subsets; increased mobilization of activated T-cells (CD4+ and CD8+) and plasmablasts in the early phase of infection. Comparative analysis based on clinical presentation and outcome yielded lower initial viremia, increased activated T-cell responses, expanded plasmablasts, and restoration of ITGB7 expressing CD8+ T-cells as possible protective signatures. This longitudinal study delineates putative protective signatures associated with milder NiV disease. It emphasizes the need for the development of immunotherapeutic interventions such as monoclonal antibodies to blunt early viremia and ameliorate pathogenesis.
1 INTRODUCTION
Nipah virus (NiV) in recent decades has emerged as a zoonotic pathogen of concern, causing highly infectious disease with significant morbidity and mortality.1 Belonging to the Paramyxoviridae family of the genus henipavirus, NiV is a risk group-4 pathogen, a negative-sense RNA virus with a genome size of around 18.2 Kb. It is mostly found in fruit bats of the genus Pteropus, which are the natural reservoir for the virus.2-4 NiV-infected individuals can suffer from severe encephalitis, often fatal, whereas fever is the most common symptom, followed by cough, breathlessness, mental confusion, headache, and seizures.5, 6 The first NiV outbreak in India was reported in Siliguri, in 2001, and the second outbreak in Nadia district of West Bengal in 2007.7 Since, reoccurrence of NiV outbreaks have been reported in the Kozhikode district of Kerala in May 2018 with a case fatality rate of 88.8%, followed by subsequent outbreaks in 2019 and 2021 in Ernakulum and Kozhikode district, Kerala, respectively.8 Considering the increased frequency of outbreaks and accompanying morbidity and mortality in humans, understanding the dynamics of the host immune response is critical for the development of rationally guided therapeutic interventions.9, 10
Although, the in vitro and in vivo research showed a possible immune response that corresponds with the survival of NiV infection, the immunopathogenesis and immunological pathways linked to NiV infection in humans are mainly unknown. It has been shown that NiV has mechanisms that suppress host antiviral response and can effectively interfere with both innate and adaptive immune responses. A precise demonstration of the cellular and systemic response of humans in the event of NiV infection and re-exposure remains elusive, despite a lack of concrete evidence and experimental models.11
In this study, we monitored and attempted to delineate systemic cellular immune signatures corresponding to disparate clinical outcomes in three NiV-infected survivors of the recent outbreak (September 2023) from Kerala, India.12 This was the first such real-time, ex vivo immune-profiling study conducted in India amongst Nipah survivors.
2 MATERIALS AND METHODS
2.1 Study participants
Individuals diagnosed to be infected with NiV (n = 3) were recruited in this study from Kozhikode district, Kerala, as described previously (Table 1).12 The case-2 was given ribavirin therapy for 10 days along with broad-spectrum antibiotics and anti-convulsion drugs, that is, lorazepam and levetiracetam. The case-3 was initiated on tab. oseltamivir, broad-spectrum antibiotics, antipyretics, along with inj. remdesivir for 12 days. The case-6 was administered with inj. remdesivir for 12 days. The genomic sequences of the NiV infected cases belong to the Indian clade and matched with the sequences from 2018 to 2019 Indian NiV outbreaks.12 The healthy individuals (n = 10; 8 male/2 female; mean age of 37 ± 9 SD; 2 males each with controlled hypertension and type-II diabetes mellitus) from non-outbreak areas were recruited as controls. After taking written informed consent, 8 mL of peripheral blood was collected in EDTA vacutainer tubes and was transported to ICMR-National Institute of Virology, Pune, within 18 h. Whole blood samples from healthy individuals were collected and stored overnight to approximate the period between collection and concurrent analysis with NiV-infected samples. Blood samples from infected individuals were initially collected within 10–14 days from post onset day (POD) for cases 3 and 6 and POD 22 for case 2. Cases 3 and 6 were followed up longitudinally for understanding the immune markers during POD range of 19–31 (1 week), 54–58 (1 month), 91–98 (3 months), and 127–138 (4 months).
| Nipah confirmed cases | Age | Gender | Clinical presentation/outcome | Post onset date (POD) of illness [first time point for the immune analysis] | Viral load at the POD | Comorbidities |
|---|---|---|---|---|---|---|
| Case 1 | 45 | Male | Fever, ARDS, Altered Sensorium, slurring of speech, diplopia/Death | Not included in analysis | 7.2 × 10⁴ | Psoriasis |
| *Case 2 | 9 | Male | Fever, cough, ARDS, Seizures/Survived | 22 | Negative | None |
| **Case 3 | 25 | Male | Fever, cough, breathlessness, diarrhea/Survived | 12 | 6.4 × 10⁴ | None |
| Case 4 | 40 | Male | Fever, cough, ARDS/Death | Not included in analysis | 1.4 × 10⁷ | None |
| Case 5 | 25 | Male | Fever, headache, sore-throat, Rhinitis/Survived | Consent not provided by the patient for sampling | 1.3 × 10⁵ | None |
| **Case 6 | 39 | Male | Fever, altered sensorium, nystagmus, gait ataxia/Survived | 10 | 1.7 × 10⁴ | None |
- Notes: Cases 1 and 4 succumbed to Nipah virus infection. Case 5 didn't give consent for sample collection.
- Abbreviation: ARDS, acute respiratory distress syndrome.
- * Case 2 immune signature profiling was done at one-time point only.
- ** Cases 3 and 6 were followed till POD 138 for immune signature profiling.
2.2 Ex vivo immunophenotyping
Multiparametric flow cytometry-based ex vivo (whole blood) evaluation of the counts/frequency of different immune cells and subpopulations was carried out using distinct flow cytometry panels. Enumeration of leukocyte populations (T-cells, B-cells, NK-cells, and monocytes) and their functional status was determined using the following fluorescently labeled monoclonal antibodies (mAbs): anti-CD3 (Clone: SK7), anti-CD4 (Clone: RPA-T4), anti-CD8 (Clone: SK1), anti-CD56 (Clone: NCAM16.2), anti-CD14 (Clone: M5E2), anti-CD25 (Clone: M-A251), anti-CCR7 (Clone: 150503), anti-IgD (Clone: IA6-2), anti-Beta7 (Clone: FIB504), anti-CD27 (Clone: M-T271), anti-CD19 (Clone: SJ25C1), anti-CD38 (Clone: HIT2), anti-CD45 (Clone: 2D1), anti-HLADR (Clone: L243), anti-CD45RO (Clone: UCHL1), anti-CD4 (Clone: RPA-T4), anti-CD16 (Clone: 3G8), anti-CD127 (Clone: HIL7RM21). As described previously,13, 14 200 μL of EDTA blood was incubated with appropriate fluorescently labeled mAbs for 20 min at room temperature. The fluorescence-activated cell sorter (FACS) lysing solution (BD Biosciences) was used to lyse erythrocytes, when appropriate, by washes with stain buffer (phosphate-buffered saline with 0.2% fetal bovine serum). At least 1,50,000 CD3+ cells were acquired on the DxFLEX flow cytometer (Beckman Coulter Life Sciences), and data were analyzed on FlowJo (BD).
2.3 Assays for absolute T, B, monocytes and NK cell count
EDTA-stabilized blood was used to enumerate the absolute count of T-cells, B-cells, NK-cells, and monocytes. Liquid counting beads (BD Biosciences; cat no: 335925) together with appropriate fluorescently conjugated mAbs were used to enumerate cell populations through stain/lyse/fix/no-wash protocol as described previously.15, 16 Samples were acquired on DxFLEX flow cytometer (Beckman Coulter Life Sciences), and the generated data were analyzed using FlowJo (BD). The representative gating strategy is depicted in Supporting Information S1: Figures 1–3.17-19 Absolute counts for different CD4+ and CD8+ memory T-cell subsets (naive, central memory, effector memory, and effector memory RA positive), activated cells, plasmablast, and different cell populations expressing integrin Beta-7 (ITGB7) were calculated based on concurrently obtained absolute T and B cell counts.
2.4 Statistical analysis
Descriptive statistical analysis was performed using GraphPad Prism software. The data is plotted as scatter plots with bars indicating the medians. Mann–Whitney non-parametric U test was used for pairwise comparisons, and ANOVA (Kruskal–Wallis) test was used to carry out multiple comparisons between groups. For all statistical calculations, p < 0.05 was considered significant.
3 RESULTS
3.1 Ex vivo leukocyte profiling in Nipah virus (NiV)-infected individuals
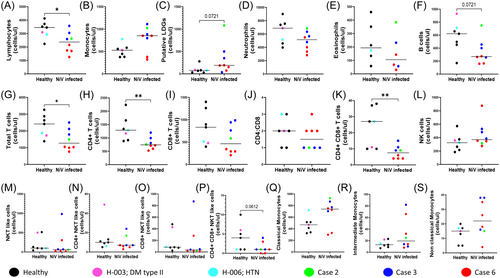
As depicted in Figure 1, we compared absolute counts of leukocytes within healthy and NiV-infected individuals, including all follow-up data from three cases ranging from POD 10–58, with a median POD of 22. With the exception of NK cells (CD3−CD56+CD16+; Figure 1L), lymphopenic profiles were observed in B-cells (CD3−CD19+), both CD4+ and CD8+ T-cells, with CD4+ T-cells showing a greater extent of significant depletion, evinced through a significant lower CD4:CD8 ratio observed in NiV individuals (Figure 1F–K,M–P). The granulocyte compartment, when similarly compared, showed evidence of neutropenia and eosinopenia in NiV cases (Figure 1D,E). Interestingly, case 2 (green) sampled at POD 22, for which no follow-up was available, and who exhibited the most severe symptoms (Table 1) had the highest counts for classical monocytes, neutrophils, putative low-density granulocytes (PuLDGs), eosinophils and B-cells amongst all cases (Figure 1C–F,Q). Intriguingly, a subset we identified on the basis of scatter and high CD16 expression (described further in Figure 4) and believed to be PuLDGs were clearly discernible in NiV-infected individuals and had elevated counts (Figure 1C and Supporting Information S1: Figure 1C). In the case of monocytes, counts in NiV individuals trended towards being increased overall with a major contribution from classical monocytes (CD14+CD16−; Figure 1B,Q).
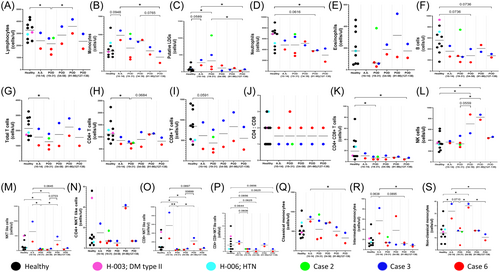
These signatures were also analyzed longitudinally, that is, during the acute symptomatic phase (POD 10–14) and convalescent asymptomatic phase (POD 19–138), as shown in Figure 2 and Tables 2 and 3. When compared with healthy controls, persistent lymphopenia (total lymphocytes, B-cells, T-cells, and subsets) was observed up to POD 138 in Cases 3 & 6, while NK cells showed a continued rising trend (Figure 2A,F–I,K). Restoration of both monocyte and PuLDGs counts was observed by POD 138 (Figure 2B,C).
|
- Notes: Non-parametric Mann–Whitney U test, *p < 0.05; b: borderline significance, p ∼ 0.05; t: trend.
- Abbreviations: LDGs, low-density granulocytes; POD, post onset date.
| Case wise immune signatures of Nipah virus (NiV) infected individuals Nipah virus infection [compared to healthy controls] | ||
|---|---|---|
| Case 2 | Case 3 | Case 6 |
|
|
|
|
||
- Abbreviations: POD, post onset date; PuLDGs, putative low-density granulocytes.
Of the three NiV cases where immune profiling data was available, Figure 3 and Supporting Information S1: Figure 5 depict the dynamics of cellular subsets in two individuals (Case 3 and Case 6) where follow-up was possible. As case 2 was from the pediatric age group, the consent from the parents was not obtained and couldn't be followed up. As described in Table 1, case 3 had primary respiratory symptoms while case 6 had encephalitis-like presentation. Considering the different clinical presentations, the discriminatory signatures were studied as described in Figure 3 and Tables 2 and 3. Both the cases showed an overall picture of neutropenia (Figure 3D) and lymphopenia (Figure 3A) with a decline in Total T cells and CD8+ T-cell counts (Figure 3G–I). Despite the declining trend, case 3 with respiratory symptoms showed lesser evidence of depletion than case 6 with encephalitis-like symptoms. Interestingly, in case 6, CD8+ T-cell counts remained lower than the healthy cut off till POD 138 (Figure 3I). With respect to common signatures, we noted that both the cases showed a dramatic and persistent depletion of B cell counts throughout the disease course (Figure 3F and Tables 2 and 3).
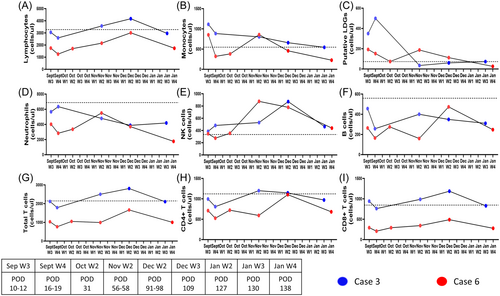
The NK subset remained unperturbed during early infection showed an expansion in both the cases during the post-acute phase from POD 56-POD 98 (Figure 3E), eventually trending towards healthy cut off range by POD 138. With respect to the PuLDGs subset, both the cases showed elevated counts during acute infection that were eventually restored to healthy cut off levels, albeit, slower for case 6 (Figure 3C).
3.2 Evidence for concurrent and persistent memory Treg expansion
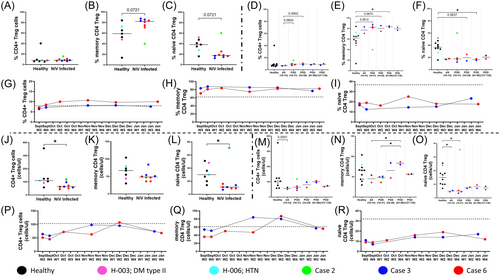
Absolute counts and frequency of regulatory T-cells (Treg; CD4+ CD25highCD127low) including subsets, that is, memory Treg (CD4+ CD25highCD127low CD45RO+) and naive Treg (CD4+ CD25highCD127low CD45RO−) were evaluated and compared between healthy and NiV cases (POD 10–58; Figure 4). Overall, Tregs mirrored the total CD4+ T-cell population in showing a statistically significant decline in absolute counts but no major change in frequency (Figure 4A,J). When delineated into memory and naive populations, we noted that the later subset showed a significant decline in contrast to the former compared to healthy controls, which resulted in an increased frequency of memory Tregs within NiV cases and could be possibly due to increased induction. Contrary to this, in case 2, the induction did not seem to occur as an inverse trend of higher naïve versus memory CD4+ Treg frequency was observed (Figure 4B,C,K,L). When data was examined over the course of disease progression upto 138 POD (Figure 4D–F,M–O), an increased polarization towards memory Tregs was observed. Integration of counts and frequency of these subsets suggested a real expansion of the memory subset compared to the naive Treg compartment (Figure 4E,F). The cases 3 and 6 showed consistently higher circulating memory Tregs till POD 138 (Figure 4H).
3.3 Enumeration and functionality of CD4+ and CD8 + T cell subsets in NiV cases
Absolute counts and frequency of different CD4+ and CD8+ memory T-cell subsets were evaluated, that is, naive T-cells (N, CD45RO− CCR7+), central memory T-cells (CM, CD45RO+ CCR7+), effector memory T-cells (EM, CD45RO–+ CCR7−), effector memory CD45RA re-expressing (EMRA, CD45RO− CCR7−). As shown in Supporting Information S1: Figures 6 and 7, we observed a reduction in counts for most subsets, compared to apparently healthy controls in NiV cases that tracked with overall T-cell depletion (Supporting Information S1: Figures 6 and 7E,I–K,M–P). In terms of subset distribution, we also noticed higher frequencies of CD8 + EM T-cells in NiV individuals with corresponding reduction in frequency of naive CD8 + T-cells (Supporting Information S1: Figures 6 and 7E,G). Interestingly, case 3, which had the mildest course of disease, also had the highest count of both CD4+ and CD8+ EM T-cells in samples obtained from all cases until POD 58 (Supporting Information S1: Figures 6 and 7K,O). Further follow-up with available samples showed this signature to be consistent in case 3, which was in contrast to case 6 (Supporting Information S1: Figures 8 and 9). Also, restoration to control levels was observed in these individuals by the end of the follow-up period (Supporting Information S1: Figure 7).
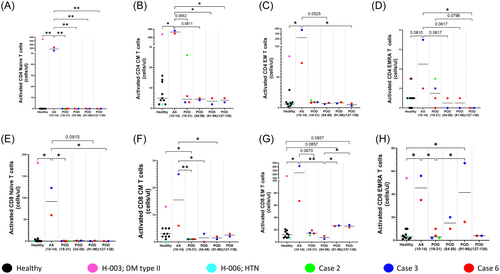
Assessment of activation levels (CD38+HLADR+), probably pursuant to infection, in these subsets (Supporting Information S1: Figure 10) showed clear evidence of increased activation in the T-cell compartment (both CD4+ and CD8+) during the acute symptomatic phase in NiV cases 3 and 6 upto POD 14 (Figure 5 and Supporting Information S1: Figure 11). Interestingly, in case 3 (respiratory illness), compared to case 6 (encephalitis syndrome), we observed higher counts of activated cells in all subsets of the CD8+ T-cell compartment that correlated with the higher counts of total CD8 + EM T-cells observed in case 3 (Figure 5C,G). Finally, in NiV cases, restoration of these cells was observed by POD 138 as observed in healthy controls (Figure 5 and Supporting Information S1: Figures 12 and 13).
3.4 Elevated levels of plasmablast cells in acute and relapse phase of Nipah infection
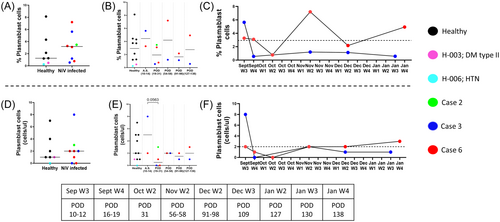
Virus-specific antibody production would require activation and generation of precursor plasmablast (CD45+ CD3− CD19+ IgD− CD27+ CD38+), which were monitored concurrently with the T-cell compartment. Data from healthy controls and NiV cases (POD 10–58) indicated an expansion of plasmablast count and frequency, probably reflecting the early antiviral humoral response (Figure 6A,D). When data was examined over the course of disease progression in cases 3 and 6 (Figure 6B,E), we noted a clear expansion (both in counts and frequency) during the acute symptomatic phase followed by restoration (in counts, Figure 6E) to healthy control levels. Follow-up data that was available for cases 3 and 6, with different clinical courses, indicated that case 3, in contrast to case 6, had the higher level of circulating plasmablasts that were quickly restored to healthy control levels in the convalescent asymptomatic phase (Week 4, September). Furthermore, a positive correlation was observed between circulating plasmablasts and activated CD4+ and CD8+ (CM, EM, EMRA) T-cells in all three NiV individuals (POD 10–58, Supporting Information S1: Figure 14).
3.5 Modulation of mucosal homing, integrin Beta-7 expression
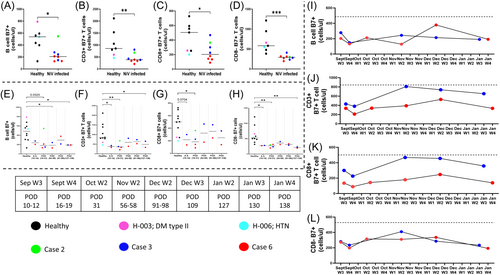
To evaluate the effect of NiV infection in terms of altered homing and its possible role in disease progression, we measured the extracellular expression of an important mucosal homing receptor, ITGB7, in the T and B-cell compartment (Figure 7). Aggregate data from all 3 NiV cases (POD 10–58) showed a significant reduction in both compartments with CD4+ T-cells showing the pronounced effect (Figure 7D and Supporting Information S1: Figure 15). Interestingly, case 2, which had severe disease, did not show any reduction in mucosal homing B-cell counts (Figure 7A). In terms of disease progression also, ITGB7 subset remained depleted over the course of follow up (POD 138) for cases 3 and 6. With respect to the T-cell compartment, we observed a gradual restoration of CD8+ ITGB7 expressing T-cells which was not apparent in the corresponding CD8− (CD4+ ) subset, which didn't show any rise throughout the follow up (Figure 7G,H and Supporting Information S1: Figure 16). When individual follow-up data was plotted for cases 3 and 6, we observed that ITGB7 expressing B-cell depletion remained persistent up to POD 138 in both cases. However, case 3 showed clear evidence of restoration (to healthy control levels) in the T-cell compartment, mainly contributed by CD8+ mucosal homing T-cells (Figure 7J,K). Interestingly, as observed for ITGB7 expressing B-cells, CD8- T-cells did not seem to follow this pattern (Figure 7L and Supporting Information S1: Figure 17).
4 DISCUSSION
This study provides real-time immune monitoring data from three NiV-infected survivors in the 2023 outbreak in Kozhikode district, Kerala, India. We delineate circulating cellular immune signatures corresponding to disparate clinical presentations that may inform pathogenesis of NiV infection (Tables 2 and 3). There is scarce data available on immune profiling of Nipah-infected cases. From India, Arunkumar et al. have reported B and T cell immune signatures during acute infection in two survivors of the 2018 outbreak.10 In this study, we analyzed data from three Nipah infected cases12 and followed up two survivors till POD 138.
Overall and in contrast to the previous report, circulating cellular immune signatures that were common to all three NiV cases included a heretofore undescribed persistent lymphopenia comprising both B and T-cells. This included the CD4+ Treg compartment, where, a relative expansion of memory Tregs, driven probably by early viral pathogenesis, and converse depletion of naive Treg counts was observed. In addition, trends indicative of global leukopenic modulation were observed in granulocytes and monocytes. In the case of granulocytes, we also noticed an apparent expansion of a population (based on CD45 expression, side scatter and CD16 expression20, 21 that may correspond to an immunosuppressive subset (PuLDGs) described recently in the context of severe COVID-1922 (Tables 2 and 3). However, this subset would need validation in future studies using established markers such as CD66 and CD15. Disrupted mucosal homing, especially with respect to the gut, has been implicated in both acute and chronic viral infections such as SARS-CoV-2 and HIV leading to viral pathology.15, 23, 24 Considering the systemic sequalae observed in NiV cases, we assessed, through ITGB7 expression on lymphocytes, one such gut migratory network where we were able to demonstrate altered homing, possibly from gut to infection niches that remained persistent through convalescence. With respect to the previously described immune monitoring data by Arunkumar et al., we were able to recapitulate the increased mobilization of activated T-cells (CD4+ and CD8+) and plasmablasts in the early phase of infection, demonstrating these to be consistent signatures in survivors across separate outbreaks with distinct fatality rates.10
This outbreak permitted the analysis of circulating cellular immune subsets in three survivors with distinct disease profiles (Case 2, Case 3, and Case 6).12 Two of these, Case 3 and Case 6, were followed until POD 138, presenting with respiratory infection and encephalitis, respectively.12 Case 2, a pediatric case presenting with severe acute respiratory infection with seizures, exhibited a unique profile compared to the other two cases even at the single available time point of POD 22. The apparent lack of memory CD4+ Treg expansion in and concurrent reduction in mucosal homing (ITGB7 expressing) B-cells observed in case 2 reflected earlier reported Treg dysfunction commonly observed in children at this developmental stage in response to acute viral infections such as RSV.25 Also, homeostatic (baseline) dominance of naïve v/s memory Tregs is well reported within this age group26 even while maintaining a robust antiviral cellular innate response.27
When comparing Case 3 and Case 6, both otherwise immunocompetent individuals, that showed different disease patterns, we believe that the lower initial viremia may have been an important immuno-pathological determinant resulting in lower lymphopenia, increased activated T-cell responses, plasmablast expansion, and greater restoration of ITGB7 expressing circulating CD8+T-cells in case 3 but not case 6.
Thus, in case 3, the acute phase would have resulted in preservation of CD4 T helper cells, which could in turn have driven higher production of class switched and possibly protective virus-specific IgG.
Indeed, highlighting the importance of reducing early viremia to prevent disease severity, Zeitlin et al.,28 have recently demonstrated the utility of early (Day 1 or 5 post exposure) passive administration of NiV cross-reactive mAb (Hu1F5) in protecting rodent and nonhuman primate models from severe infection as well as the later in a challenge setting. Thus, our results advocate for the use of early administration of mAb following infection.
The potential limitations of the study are relatively small sample size and the lack of data on the early immune response (before POD 10). The NiV outbreaks are mainly sporadic with relatively small number of cases with high mortality. This limits such immunological studies to be restrained to small sample size. However, further studies may be required to understand the early immune response.
5 CONCLUSION
The present study provides essential longitudinal immune-profiling data among the NiV cases from the Nipah outbreak 2023. The data delineates unique signatures associated with different clinical presentations of NiV infection. A balanced T and B cell response is crucial for effective immunity against NiV. An overactive immune response can lead to severe inflammation and tissue damage, while an underactive response may allow the virus to replicate leading to severe infection. By understanding the interplay between T and B cells in NiV infection, newer strategies can be developed to optimize immune responses and improve the efficacy of vaccines and therapeutics.
AUTHOR CONTRIBUTIONS
Pragya D. Yadav, Vainav Patel, Rima R. Sahay, Deepak Y. Patil, Anita M. Shete, Sreelekshmy Mohandas, and Nivedita Gupta conceptualized and executed the study. Vainav Patel, Rima R. Sahay, Harsha C. Palav, Anita M. Shete, Deepak Y. Patil, Sreelekshmy Mohandas, Nandan Mohite, Pranay Gurav, Rajlaxmi Jain, Yash Joshi, and Pragya D. Yadav contributed in immune-profiling study and data analysis. Anoop Kumar, Anita M. Shete, Chandni Radhakrishnan, Shihabudheen P., Anitha Puduvail Moorkoth, Lathika Velichapat Ramakrishnan, and Rima R. Sahay coordinated for the clinical specimen collection from Nipah cases. Pragya D. Yadav, Rima R. Sahay, Vainav Patel, Deepak Y. Patil, Anita M. Shete, Harsha C. Palav, and Sreelekshmy Mohandas contributed to data collection, interpretation, writing, and critical review. All the authors have contributed equally in reviewing and editing the final manuscript.
ACKNOWLEDGMENTS
The authors take this opportunity to convey thanks and appreciation to all individuals who have contributed immensely towards the Nipah virus outbreak response and containment measures in Kozhikode district, Kerala state, India, during September 2023, including Smt. Veena George [Hon'ble Minister for Health and Family Welfare, Kerala], and Shri. Mohammed Hanish, Principal Secretary for Health (Kerala). The authors are thankful to Dr. Rajiv Bahl, Secretary Department of Health Research and Director General, Indian Council of Medical Research (ICMR), New Delhi, for his constant support, guidance, and motivation. The authors would like to thank Dr. Sheela Godbole, Former Director In-charge, ICMR-National Institute of Virology (NIV), Pune, and Dr Geetanjali Sachdeva, Director, ICMR-National Institute for Research in Reproductive and Child Health, for administrative approvals required for the outbreak responses. The authors would like to thank Dr. Reena KJ, Directorate of Health Services; Dr. Thomas Mathew, Director of Medical Education; Smt. A Geetha, District Collector Kozhikode; Dr. Shaji Cheriya Koroth, District Program Manager; and Dr. Neelakandhan Asokan, Principal, Government Medical College (GMC), Kozhikode, for providing the logistic support for the shipment of clinical specimens to ICMR-NIV, Pune. We also acknowledge the excellent technical support from Ms. Denna Prabhin and Mr. Abhimanyu Kumar for the support during the study. We extend sincere thanks to the support for the clinical sample collection and transportation from the scientific and technical team at the Regional Virus Research and Diagnostic Laboratory at GMC Kozhikode, led by Dr. Anitha PM, Professor and Head Department of Microbiology. The authors extend gratitude to the operator of the FACS (BD Biosciences)—Ms. Deena Prabhin, for the initial setup of the machine. The grant was provided from the intramural funds of the Indian Council of Medical Research-National Institute of Virology, Pune.
CONFLICT OF INTEREST STATEMENT
The authors declare no conflict of interest.
ETHICS STATEMENT
The study was approved by the Institutional Human Ethics Committee of ICMR-National Institute of Virology (NIV), Pune, India, under the project “Cellular and humoral immune responses in Nipah virus infection and development of monoclonal antibodies against Nipah virus” (NIV/IEC/November/2023/D-1 dated November 10, 2023). A written informed consent was taken from all the recovered cases during each follow up sample collection.
Open Research
DATA AVAILABILITY STATEMENT
The data that support the findings of this study are available on request from the corresponding author. The data are not publicly available due to privacy or ethical restrictions. All experimental data, except personally identifiable information, would be available upon request.


