Temporal trends in respiratory pathogens following the COVID-19 pandemic and climate variables: A unicentric retrospective evaluation of 24 pathogens in a temperate subtropical region
Abstract
Temperature and humidity are studied in the context of seasonal infections in temperate and tropical zones, but the relationship between viral trends and climate variables in temperate subtropical zones remains underexplored. Our retrospective study analyzes respiratory pathogen incidence and its correlation with climate data in a subtropical zone. Retrospective observational study at Moinhos de Vento Hospital, South Brazil, aiming to assess seasonal trends in respiratory pathogens, correlating them with climate data. The study included patients of all ages from various healthcare settings, with data collected between April 2022 and July 2023. Biological samples were analyzed for 24 pathogens using polymerase chain reaction and hybridization techniques; demographic variables were also collected. The data was analyzed descriptively and graphically. Spearman tests and Poisson regression were used as correlation tests. Tests were clustered according to all pathogens, severe acute respiratory syndrome coronavirus 2 (SARS-CoV-2), influenza viruses, rhinovirus, and respiratory syncytial virus (RSV). Between April 2022 and July 2023, 3329 tests showed a 71.6% positivity rate. Rhinovirus and RSV predominated, exhibiting seasonal patterns. Temperature was inversely correlated with the viruses, notably rhinovirus, but SARS-CoV-2 was positively correlated. Air humidity was positively correlated with all pathogens, RSV, rhinovirus, and atmospheric pressure with all pathogens and rhinovirus. Our results showed statistically significant correlations, with modest effect sizes. Our study did not evaluate causation effects. Despite the correlation between climate and respiratory pathogens, our work suggests additional factors influencing transmission dynamics. Our findings underscore the complex interplay between climate and respiratory infections in subtropical climates.
1 INTRODUCTION
Climatic factors exert a profound influence on the viability of respiratory viruses in the environment, affecting the dynamics of transmission through droplets and aerosols.1-3 Additionally, ambient temperature and humidity levels can significantly impact the body's immune responses and mucosal defenses.1 Moreover, the cooling of average body temperature can lead to physiological alterations, such as vasoconstriction and immune response suppression, thereby increasing susceptibility to infections.4
Traditionally, temperature and relative humidity were extensively studied and are well-documented as key factors in the intricate relationship between climate and seasonal infections.1-9 Atmospheric pressure, which correlates with these two parameters, serves as an indicator of climatic instability and precipitation patterns. During the winter months, characterized by lower temperatures and reduced relative humidity (referred to as “cold-dry” conditions), studies suggest a heightened risk of airborne transmission of respiratory pathogens via short-range droplet transmission or long-range aerosol dispersion in temperate climates.1-3 Conversely, in tropical climates, peak transmission appears to coincide with periods of high humidity and rainfall (referred to as “humid-rainy” conditions), possibly favoring direct and indirect mucosal contact as the primary mode of transmission.1-3 However, to our knowledge, there is a paucity of evidence regarding viral trends and climate relationships in temperate subtropical climates.
Influenza viruses, human coronaviruses, and respiratory syncytial virus (RSV) tend to exhibit higher transmission rates during the winter season, while enteroviruses are more prevalent during the summer in temperate zones.1, 8 Rhinovirus, adenovirus, bocavirus, and human metapneumovirus (hMPV) maintain a relatively consistent presence throughout the year.1, 10 Moreover, rhinovirus, notably, displays a significant correlation with humidity, with reduced survival rates in drier climates,1, 9 and RSV, hMPV, and influenza B virus are suggested to follow a biennial rhythm (but influenza A not).8, 9 Regarding severe acute respiratory syndrome coronavirus 2 (SARS-CoV-2), current data predominantly supports a negative correlation with ambient temperature and a bidirectional relationship with humidity levels.5 However, some studies suggest the absence of any correlation.7
Throughout the coronavirus disease 2019 (COVID-19) pandemic, the analysis of the correlation between climate and the seasonality of respiratory infections faced challenges due to globally implemented measures to prevent COVID-19 transmission.11 Nevertheless, since the Omicron variant became a variant of concern and globally the vaccine- and infection-induced immunity levels increased—leading into the postpandemic era—it is crucial to revisit these relationships to understand better and prepare for future challenges in respiratory pathogen management, mainly in a subtropical climate.7, 12 This study aims to evaluate the incidence of respiratory pathogens and their correlation with climate data in a subtropical region (Southern Brazil) during the Omicron era and the beginning of the post-pandemic period (April-2022–July-2023).
2 METHODS
2.1 Study design, setting, and participants
We made an observational retrospective study assessing temporal trends in respiratory pathogens with patients treated at Moinhos de Vento Hospital, Porto Alegre, Brazil, and we made a correlation with climate data. Moinhos de Vento Hospital is a tertiary treatment reference center for the population using the private healthcare system in South Brazil. The hospital population covers the City of Porto Alegre (approximately 1.5 million inhabitants) as well as the surrounding area (“Porto Alegre Area”), with a total of 4.5 million inhabitants. The Porto Alegre area is approximately 10 000 km2, and this area presents a similar behavior in terms of temperature and humidity variability throughout the year; a temperate subtropical climate and mesothermal humid by Köppen–Geiger classification.
The patients included in the analysis did not have age restrictions and were attended to in different settings (hospital ward, emergency department, intensive care unit [ICU], and outpatient). Data were collected between April 2022 and July 2023 period when the test to identify 24 different pathogens was implemented in our hospital. This observational study was conducted following STROBE guidelines for observational studies.13
2.2 Variables and data sources
Biological material was obtained via nasopharyngeal and oropharyngeal swabs using a specific kit (Kolplast®), or bronchoalveolar lavage. Samples were sent to the Genetics and Molecular Biology Laboratory at Moinhos de Vento Hospital for the detection of genetic material. The genetic material was extracted using the MagMAX™ Viral/Pathogen Binding Beads® kit (Thermo Fisher). Finally, multiplex PCR followed by reverse hybridization (Dot-Blot) with specific probes immobilized on a nylon membrane (Flow-Chip Technology) was performed using the HybriSpot12Auto (VIT-HS12A) equipment from Vitro Group®.
The respiratory pathogens included in the test were: influenza A virus, influenza A subtype H3, influenza A subtype H1N1, influenza B virus, adenovirus, bocavirus, coronaviruses 229E, HKU-1, OC43, NL63, SARS-CoV-2, enterovirus, hMPV, parainfluenza viruses 1-4, RSV subtypes A and B, rhinovirus, and bacteria the Bordetella pertussis, Bordetella parapertussis, and Mycoplasma pneumoniae.
We also collected demographic variables including gender, age, local sample collection, and examination date. We demonstrate data in a descriptive way with the presentation of positivity results according to the pathogen in a temporal trend graphic. We also have clustered the results by age. To illustrate better we grouped the pathogens as follows: influenza A virus, influenza A subtype H3N2, influenza A subtype H1N1, and influenza B virus as influenza virus; coronaviruses 229E, HKU-1, OC43, and NL63 as coronavirus, and showed separately SARS-Cov-2; parainfluenza viruses 1–4 as parainfluenza; RSV subtypes A and B as RSV; B. pertussis and B. parapertussis as Bordetella.
For the correlation of pathogens' positivity trends with climate data, we have extracted data from the National Institute of Meteorology (INMET), a reputable institution that collects and provides reliable meteorological data for Brazil. INMET is the Brazilian representative at the World Meteorological Organization and is responsible for managing data collected by the South American meteorological observation network and other meteorological centers comprising the World Meteorological Watch. The institutes' data collection and distribution systems comprise upper-air sounding stations (radiosondes), manually operated surface meteorological stations, and the largest network of automatic stations in South America. Data collected by this network is disseminated democratically and free of charge in real-time on the INMET website (https://portal.inmet.gov.br). We accessed the portal in August 2023, considering the period from April 1, 2022, to July 30, 2023, and we obtained comprehensive data on temperature, relative humidity, and atmospheric pressure from the same city as our hospital. We analyze the provided data as an average per day, for each climate variable.
2.3 Statistical methods
To evaluate correlations between climate data and temporal trends in pathogen positivity we assess the distribution of the climate data regarding normality, and we assume that the positivity test follows a discrete Poisson distribution. We made scattered plots with linear regression lines and standard error to show the relationship between temperature, relative air humidity, and atmospheric pressure with pathogens in a visual way. We made Spearman correlation tests as a measure of correlation. Finally, we also made a Poisson regression with a multivariate model including all climate variables according to pathogen. For this analysis, we clustered the pathogens in all pathogens, SARS-Cov-2, influenza, rhinovirus, and RSV. We considered a statistically significant result when p-value < 0.05. Data was analyzed using Jamovi software (version 2.3) and R software (version 4.2.2). Our study was approved by the Moinhos de Vento Hospital ethical committee, approval number 6.318.239.
3 RESULTS
3.1 Participants' characteristics and viruses' temporal trends
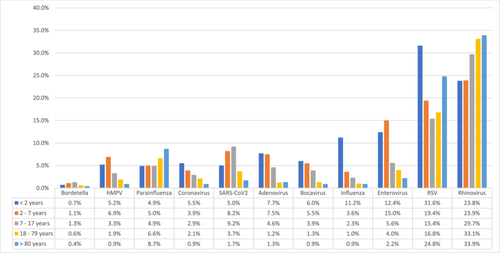
From April 2022 to July 2023 3,322 tests were performed, of which 38 (1.1%) were in outpatients, 458 (13.8%) in ward patients, 408 (12.3%) were patients in the emergency department, and 2418 (72.8%) were in ICU patients; 1564 (47%) were female patients. Regarding age, 1489 (44.7%) of patients were <2 years old, 785 (23.6%) were 2–7 years, 306 (9.2%) were 7–17 years, 519 (15.6%) were 18–79 years, and 230 (6.9%) were more than 80 years. During the study period, the climate variables showed a median atmospheric pressure of 1010 (hPa) (interquartile range [IQR] 1007–1013 hPa), relative air humidity 76.8% (IQR 70.7%–83.3%), and temperature of 19.5°C (67.1F; IQR 16.2–23.2°C). The positivity rate of tested pathogens was 71.6%, and the most common pathogens were RSV (21.6%) and Rhinovirus (17.2%). The positivity rate of influenza viruses and SARS-CoV-2 were respectively 5.9% and 4.4% of the sample. We did not have any cases of M. pneumoniae. In Figure 1 we showed the positivity rate according to the age and pathogens.

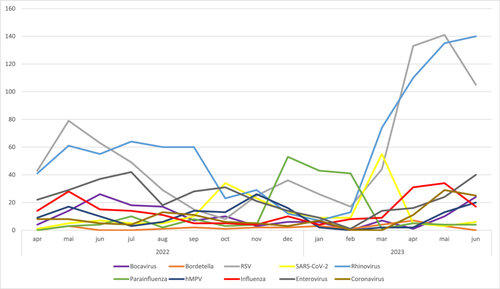
In Figure 2, we demonstrate the temporal trends of positivity rates according to pathogens. Since 2022, the main pathogens identified were Rhinovirus and RSV, with an increasing incidence at the end of autumn and the beginning of the winter, and a decreasing incidence at the beginning of spring. In 2023 the increasing positivity rate of tested pathogens started in February (middle of summer), and is different from 2022.

3.2 Correlation between viral trends and climate data
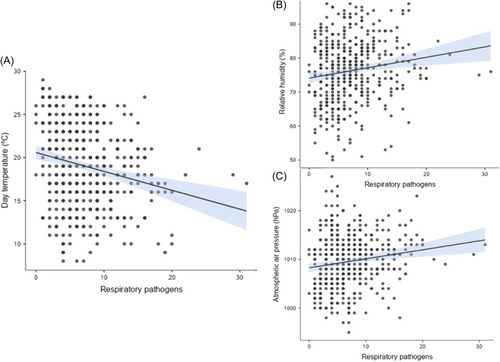
We show the correlation between climate factors: temperature, relative air humidity, and atmospheric pressure, with respiratory pathogens positivity in Figure 3. We could observe a statistically significant inverse relationship between temperature and all pathogens, RSV, rhinovirus, and influenza viruses, with the highest effect measure of correlation in the rhinovirus group (R = −0.29, 95% confidence interval [CI] −0.38 to −0.20, p < 0.01). The SARS-CoV-2 group has a statistically significant positive correlation with temperature (R = 0.16, 95% CI 0.07–0.25; p < 0.01). The relationship between air humidity and atmospheric pressure was opposite to temperature; a positive relation with the incidence of all pathogens, RSV, rhinovirus, and an inverse relationship with SARS-CoV-2 was demonstrated. We did not observe statistical significance between influenza, air humidity, and atmospheric pressure; nor between SARS-CoV-2 and RSV with atmospheric pressure. The results of Spearman correlation tests are presented in Table 1.

| All pathogens R Spearman (95% CI; p-value) | RSV R Spearman (95% CI; p-value) | Rhinovirus R Spearman (95% CI; p-value) | SARS-CoV-2 R Spearman (95% CI; p-value) | Influenza R Spearman (95% CI; p-value) | |
|---|---|---|---|---|---|
| Temperature | −0.22 (−0.31; −0.12; p < 0.01) | −0.1 (−0.22; −0.03; p < 0.01) | −0.29 (−0.38; −0.20; p < 0.01) | 0.16 (0.07–0.25; p < 0.01) | −0.10 (−0.19; −0.01; p < 0.05) |
| Air humidity | 0.18 (0.08–0.27; p < 0.01) | 0.2 (0.1–0.29; p < 0.05) | 0.18 (0.08–0.27; p < 0.05) | −0.12 (−0.22; −0.03; p < 0.01) | 0.07 (−0.02; 0.16; p = 0.14) |
| Atmospheric pressure | 0.18 (0.09–0.27; p < 0.01) | 0.07 (+0.03; 0.16; p = 0.15) | 0.31 (0.22–0.39; p < 0.05) | −0.08 (−0.18; 0.01; p = 0.08) | 0.08 (−0.02; 0.17; p = 0.10) |
- Abbreviation: RSV, respiratory syncytial virus.
In the Poisson regression model with all climate variables, we demonstrated that temperature is still associated with all pathogens (prevalence ratio [PR]: 0.98, 95% CI 0.97–0.99; p < 0.01) and SARS-CoV-2 (PR: 1.05, 95% CI 1.02–1.08; p < 0.01); air humidity with all pathogens (PR: 1.01, 95% CI 1.003–1.01; p < 0.01), RSV (PR 1.02, 95% CI 1.01–1.03; p < 0.01), and rhinovirus (PR: 1.02, 95% CI 1.01–1.05; p < 0.05); atmospheric pressure with all pathogens (PR 1.01, 95% CI 1.01–1.02; p < 0.05) and rhinovirus (PR: 1.08 [95% CI 1.03–1.12]; p < 0.01). In Appendix we show the summarized Poisson Regression results.
4 DISCUSSION
Our study provides insights into the interplay between climate and respiratory infections in subtropical climates. Firstly, we found a statistically significant but modest correlation between climatic variables and respiratory pathogens incidence. This could explain the unexpected increasing positivity incidence in respiratory pathogens starting in summer, considering our temporal trend analysis. Thus, while climate played a role, other factors such as the start of school activities—which began in February 2023 in our city (Porto Alegre, Brazil)—may have been more influential. After the resumption of school activities, we observed a significant surge in RSV incidence as a cause of respiratory infections in both adults and children in the emerging post-pandemic period, a pathogen traditionally believed to be transmitted primarily by children.14-16
In this sense, we could underscore other unmeasured factors. Regarding indoor conditions, even after adjustment for climate variables, influenza's heightened transmission during the winter months persisted, emphasizing the role of indoor environments and human behavior.3 Other studies suggested that competition among respiratory viruses for replication resources, and interference mechanisms like viral receptor disruption, cell death, or interferon responses, as well as virus-induced heterologous immunity, may explain the absence of simultaneous outbreaks.15, 17, 18 During the COVID-19 pandemic, governments worldwide implemented preventive measures, such as lockdowns, which significantly reduced pollution levels (including air pollution).11 However, benefits coexisted with negative aspects, such as reduced recycling and increased waste generation.11 These effects showed the complex interactions among factors other than climate with respiratory pathogens incidence.7, 11
Secondly, regarding the relationship between climate factors and COVID-19, our data were aligned with other studies where climate conditions explained only a limited portion of the variation in COVID-19 incidence and showed results in opposite directions.5, 7 Thus, the inverse relationship between SARS-Cov-2 compared to all pathogens, with an increase in positivity rate according to higher temperatures, could be explained by the inherent higher stability of SARS-Cov-2 in temperatures around 21°C to 23°C overcoming the virus-to-virus competition,2 but other factors inherent to our sample, other environmental factors, and human behavior may explain better this phenomenon. In this sense, it is important to note that SARS-CoV-2 in our study also contributed as a driver for the modest association between all pathogens and climate analysis.
Our study presented some limitations. Our sample was primarily composed of hospitalized patients, with less than a quarter being adult patients. We analyzed the correlation between temporal trends using the Spearman correlation test and a Poisson regression model, thus we were not able to evaluate causation effects. Our correlation tests revealed relatively low effect size associations, although statistically significant. Additionally, it is essential to acknowledge the potential for a deeper understanding of climatic variables. By exploring factors such as intraday climate variations, atmospheric pressure fluctuations, and air pollution rates we would gain a more nuanced insight into the intricate interplay of climate, human behavior, and pathogens transmission. These limitations should be considered when interpreting our findings.
In summary, our findings indicated a statistically significant correlation between climate variables (temperature, relative air humidity, and atmospheric air pressure) and respiratory pathogens incidence in the subtropical climate. However, other variables may have played a more important role in transmission dynamics, such as human behavior and immunity, public policies, virus-to-virus competition, indoor conditions, and pollution levels. Furthermore, we highlighted RSV and rhinovirus as significant causes of viral respiratory infections across age groups. To our knowledge few studies have assessed the respiratory pathogens incidence beyond influenza and SARS-CoV-2 comprising the period after Omicron until the post-pandemic era, especially in Latin America and in a subtropical climate, making our investigation interesting.12, 19 These insights are essential for understanding the multifaceted relationship between climate and infectious diseases, particularly in a world emerging from the post-pandemic era with a global warming concern, where comprehensive strategies are crucial for public health.
AUTHOR CONTRIBUTIONS
Sérgio Renato da Rosa Decker, Jonas Michel Wolf, Arthur Pille, and Luiz Antônio Nasi: Conceptualization. Sérgio Renato da Rosa Decker, Arthur Pille, and Luana Freese: Data curation. Sérgio Renato da Rosa Decker and Jonas Michel Wolf: Formal analysis. Mohamed Parrini Mutlaq, and Luiz Antônio Nasi: Funding acquisition. Sérgio Renato da Rosa Decker, Jonas Michel Wolf, Arthur Pille, Luana Freese, Helena Petek, Bruna de Oliveira Rocha, Gabriela Luchiari Tumioto Giannini, Giovana Bristot, Tiago Finger Andreis, Francine Hehn de Oliveira, Emerson dos Santos Hoffmann, Luciana Kunde, Paulo Schmitz, and Juçara Maccari: Investigation. Sérgio Renato da Rosa Decker, Jonas Michel Wolf, Arthur Pille, Regis Goulart Rosa, and Luiz Antônio Nasi: Methodology. Sérgio Renato da Rosa Decker, Jonas Michel Wolf, Arthur Pille, Luana Freese, Juçara Maccari, and Luiz Antônio Nasi: Project administration. Jonas Michel Wolf, Arthur Pille, Luana Freese, Helena Petek, Bruna de Oliveira Rocha, Gabriela Luchiari Tumioto Giannini, Giovana Bristot, Tiago Finger Andreis, Francine Hehn de Oliveira, Paulo Schmitz, Juçara Maccari, and Luiz Antônio Nasi: Resources. Sérgio Renato da Rosa Decker, Jonas Michel Wolf, Luana Freese: Software. Sérgio Renato da Rosa Decker, Jonas Michel Wolf, Arthur Pille, Juçara Maccari, and Luiz Antônio Nasi: Supervision. Sérgio Renato da Rosa Decker, Jonas Michel Wolf, and Luana Freese: Roles/writing—original draft. Sérgio Renato da Rosa Decker, Jonas Michel Wolf, Arthur Pille, Luana Freese, Helena Petek, Bruna de Oliveira Rocha, Gabriela Luchiari Tumioto Giannini, Giovana Bristot, Tiago Finger Andreis, Francine Hehn de Oliveira, Emerson dos Santos Hoffmann, Luciana Kunde, Marcelo Kern, Wagner Nedel, Alexandre Prehn Zavascki, Regis Goulart Rosa, Mohamed Parrini Mutlaq, and Luiz Antônio Nasi: Writing—review & editing.
ACKNOWLEDGMENTS
We thank the Moinhos de Vento Hospital for providing data and materials crucial for developing the research that made this study possible.
CONFLICT OF INTEREST STATEMENT
The authors declare no conflict of interest.
ETHICS STATEMENT
Our study was approved by the Moinhos de Vento Hospital ethical committee, approval number 6.318.239. Due to the retrospective nature, without access to individual patients, and the use of databases with aggregated information without the possibility of individual identification, our work was exempted by the research ethics committee from applying an informed consent form.
Open Research
DATA AVAILABILITY STATEMENT
The data that support the findings of this study are available from the corresponding author upon reasonable request.


