CXCL10 and its receptor in patients with chronic hepatitis B and their ability to predict HBeAg seroconversion during antiviral treatment with TDF
Abstract
The serum chemokine C-X-C motif ligand-10 (CXCL10) and its unique receptor (CXCR3) may predict the prognosis of patients with chronic hepatitis B (CHB) treated with tenofovir disoproxil fumarate (TDF). Nevertheless, there are few reports on the profile of CXCL10 and CXCR3 and their clinical application in HBeAg (+) CHB patients during TDF antiviral therapy. CXCL10 and CXCR3 were determined in 118 CHB patients naively treated with TDF for at least 96 weeks at baseline and at treatment weeks 12 and 24. In addition, gene set enrichment analysis was used to examine the associated dataset from Gene Expression Omnibus and explore the gene sets associated with HBeAg seroconversion (SC). The change of CXCL10 (ΔCXCL10, baseline to 48-week TDF treatment) and CXCR3 (ΔCXCR3) is closely related to the possibility of HBeAg SC of CHB patients under TDF treatment. Immunohistochemical analysis of CXCL10/CXCR3 protein in liver tissue shows that there is a significant difference between paired liver biopsy samples taken before and after 96 weeks of successful TDF treatment of CHB patients (11 pairs) but no significance for unsuccessful TDF treatment (14 pairs). Multivariate Cox analysis suggests that the ΔCXCL10 is an independent predictive indicator of HBeAg SC, and the area under the receiver operating characteristic curve of the ΔCXCL10 in CHB patients is 0.8867 (p < 0.0001). Our results suggest that a lower descending CXCL10 level is associated with an increased probability of HBeAg SC of CHB patients during TDF therapy. Moreover, liver tissue CXCL10 might be involved in the immunological process of HBeAg SC.
Abbreviations
-
- CHB
-
- chronic hepatitis B
-
- CI
-
- confidence interval
-
- CXCL10
-
- chemokine C-X-C motif ligand-10
-
- CXCR3
-
- chemokine C-X-C motif receptor-3
-
- GAPDH
-
- glycerol triphosphate dehydrogenase
-
- GEO
-
- gene expression omnibus
-
- GSEA
-
- Gene Set Enrichment Analysis
-
- HD
-
- healthy donors
-
- OR
-
- odds ratio
-
- RCF
-
- relative centrifugal force
-
- ROC
-
- receiver operator characteristic
-
- SC
-
- HBeAg seroconversion
-
- TDF
-
- Tenofovir disoproxil fumarate
-
- Δ
-
- delta
1 INTRODUCTION
Persistent hepatitis B infection is mainly due to massive infiltration of lymphocytes, which also have an important influence on the course of chronic hepatitis B (CHB).1 The process of lymphocyte migration into liver tissue is influenced by many factors, and the interaction of chemokines and their receptors plays a key role. They are sensitive indicators of inflammatory activity and also play an important role in host defense, infection control, and other inflammatory diseases through chemotaxis and activation of a variety of lymphocytes expressing the receptor and binding to appropriate ligands.2
CXC chemokines have important effects on angiogenesis, liver inflammation, neoplasm proliferation, fibrosis and immune response, and also play an important role in liver cirrhosis.3 The chemokine C-X-C motif ligand-10 (CXCL10, also known as IP-10) is assigned to the CXC family, and CXCR3 is the only receptor for CXCL10.4 In recent years, CXCL10 and CXCR3 have been suspected to be increased in patients with autoimmune liver disease, chronic HCV and HBV infection,5 the latter was also reported by our group.6 In patients with chronic hepatitis B (CHB), CXCL10 protein was elevated in serum, CXCL10 messenger RNA (mRNA) and protein were highly expressed in liver tissue, and infiltrating inflammatory cells highly expressed CXCR3, which has been shown to be closely related to liver disease progression but has not been well described.7
Hepatocytes can produce CXCL10, which has been associated with the degree of infection and histological manifestations of liver injury.8 In addition, CXCL10 was associated with the functions of specific T cells and nonspecific inflammatory cells in CHB patients, and CXCL10 positively correlated with the increase of ALT in the stage of immune activation of CHB.7, 9 Persistent inflammatory activity of liver tissue indicates progression of CHB disease. Accordingly, antiviral therapy is considered a crucial way to delay the progression of CHB, which could prevent chronic HBV infection from progressing to liver fibrosis, cirrhosis, and even hepatocellular carcinoma (HCC).10 However, it is unclear whether the profile of CXCL10, CXCR3 and their dynamics change in CHB patients undergoing antiviral treatment.
It is well known that HBeAg (+) is one of the major manifestations of CHB within the immune tolerance period,11 and HBeAg may be one of the most important factors for HBV to evade immune surveillance and induce immune escape, contributing to persistent HBV infection. Therefore, HBeAg SC is considered a satisfactory endpoint for HBeAg (+) patients receiving antiviral therapy.12
In this study, we attempt to analyze the changing profile of CXCL10 and CXCR3 in TDF-treated CHB patients and explore their differences between patients with and without HBeAg seroconversion (SC). We seek to investigate the correlation between chemokines and liver inflammation and their role in predicting the response of CHB patients to TDF treatment. In addition, we also investigate the CXCL10 and CXCR3 expression characteristics of paired liver tissues in CHB patients before and after TDF treatment. In addition, gene set enrichment analysis (GSEA) was used to explore the specific molecular pathways involved in HBeAg SC CHB patients during antiviral treatment.
2 METHODS
2.1 Patients
The enrolled patients included 157 consecutively TDF treatment-naïve CHB patients from the Infectious Disease Center of the First Affiliated Hospital, Zhejiang University School of Medicine (FHZJU) between August 2015 and July 2020, and the diagnostic standard was in accordance with Asia-Pacific clinical practice guidelines for the management of hepatitis B.13 Patients were treated with oral 300 mg/d TDF (Chia Tai Tianqing Pharmaceutical Co., Ltd.) for at least 96 weeks and were followed up every 12 weeks in the first year and every 24 weeks thereafter. In addition, the other inclusion and exclusion criteria were: 23–50 years old, HBsAg positive (+) for more than 6 months, HBeAg (+) and its antibody negative (anti-HBe (−)). In addition, patients who received other medications and had other viruses, such as Epstein-Barr virus, human immunodeficiency virus and other hepatitis viruses, etc. in the last 6 months before enrollment were excluded. The inclusion and exclusion criteria were also mentioned in other reports.6, 14 In general, HBsAg, HBeAg is a biomarker for HBV infection present in the body and can also be easily detected in peripheral serum.
Each patient had 5 mL of fasting blood drawn in the morning, centrifuged at 1200g (RCF) for 5 min, and sera were collected. In addition, the anticoagulated venous blood was used to isolate PBMCs and stored at −75°C for backup. This study complied with the ethical guidelines of the Ethics Committee of the First Affiliated Hospital, Zhejiang College School of Medicine (FHZJU). Informed consent was obtained from each patient upon enrollment in the study, and the project protocol complied with the ethical principles of the Declaration of Helsinki.
2.2 Laboratory tests and chemokine detection
Routine determination of liver function indices such as serum albumin (ALB), alanine aminotransferase (ALT), and other routine biochemical parameters were measured using a Hitachi 7600 analyzer (Hitachi Ltd.) at the local laboratory. Serological evidence of HBV infection, HBsAg, anti-HBs, HBeAg, anti-HBe, and anti-HBc were determined by enzyme-linked immunosorbent assay (ELISA, AxSYM; Abbott Laboratory) or chemiluminescence immunoassay. Sera HBV DNA load was determined by COBAS TaqMan (Roche Diagnostics) as in our previous report6 with a lower detection limit of 30 copies/mL. In addition, serum CXCL10 and CXCR3 protein levels were measured using commercial ELISA kits (BioLegend) as described in the kit instructions for use.
The ELISA has the advantage of the specificity of antigen-antibody binding. It is often used for semi-quantitative detection and has the advantage of being inexpensive. In the chemiluminescence method, the chemiluminescent substance is catalyzed or oxidized to form an excited state, and then the light signal emitted when the excited state returns to the steady state is used to determine the concentration of the analyte. It belongs to quantitative detection and has high specificity and sensitivity, but is prone to hook-like effects and has poor reagent stability.15
2.3 Chemokine mRNA detection
Total RNA in PBMC was extracted with Trizol reagent (Invitrogen) and quantified with the NanoDrop spectrophotometer TM 1000 (Thermo Fisher Scientific) and transcribed into complementary DNA (cDNA) using the iScript cDNA synthesis kit (Bio-Rad Laboratories) according to the manufacturer's instructions. Quantitative reverse transcriptase polymerase chain reaction (qRT-PCR) was performed using RT2 SYBR Green Fluo FAST Mastermix (Qiagen) on a Fluorescence System for Quantitative PCR (ViiA 7, ABI, Thermo Fisher Scientific). Each real-time PCR reaction solution was prepared from 10 ng of cDNA, 0.2 µM of primer of interest, SYBR®Premix Ex Taq™ (1×) in a total volume of 25 µL with 40 cycles of 10 s at 95°C, 10 s at 55.6°C, and 30 s at 72°C. The mRNA quantity of target genes (CXCL10, CXCR3) was detected and normalized to the reference gene GAPDH. Primer sequences were indicated (Table 1).
| Genes | Sense or antisense | Sequences | Product length (bp) |
|---|---|---|---|
| CXCL10 | Sense | GTG CAG TGG GTC TCT AGG TGT TGT | 228 |
| Antisense | GCC GAT AGT AAG CAA TGA AGT GAA | ||
| CXCR3 | Sense | CCA CCC ACT GCC AAT ACA AC | 379 |
| Antisense | CGG AAC TTG ACC CCT ACA AA | ||
| GAPDH | Sense | ACC ACA GTC CAT GCC ATC AC | 452 |
| Antisense | TCC ACC ACC CTG TTG CTG TA |
2.4 Immunohistochemical staining of CXCL10 and CXCR3
Fifty liver biopsy specimens were obtained for histopathological examination of liver tissue before the first dose and after 96 weeks of TDF treatment (25 patients before and after 96 weeks of treatment), and patients underwent B-ultrasound-guided percutaneous puncture of the right lobe of the liver with a puncture needle (diameter of 0.2 cm) to obtain biopsies. The length of the liver puncture was at least 1.5 cm and was fixed with 10% formaldehyde solution, embedded in kerosene wax, and then cut into 3-μm-thick sections. Immunohistochemical staining of liver tissues with CXCL10 and CXCR3 was performed following a previous report.16 Briefly, liver sections were deparaffinized, rehydrated, and treated with 3% hydrogen peroxide in methanol for 30 min to block endogenous peroxidase, and then antigen-free in 10 mM citrate buffer (pH 6.0) for 30 min in an 85°C water bath. The sections were incubated overnight at 4°C with goat anti-human CXCL10 and CXCR3 antibodies (1:3000, R&D Systems), followed by secondary biotinylated horse anti-goat IgG antibodies (1:200, Vector Laboratories).17 Finally, CXCL10 (CXCR3) expression was monitored using the automated pathological sectioning system (3D HISTECH). Quantitative immunohistochemistry results were obtained using the additional analysis software Caseviewer (Digital Pathology Company).
2.5 Microarray data processing and visualization
The RNA sequencing dataset was downloaded from the GSE27555 of the Gene Expression Omnibus (GEO; https://www.ncbi.nlm.nih.gov/geo/query/acc.cgi?acc=GSE27555), which contains 13 liver hepatitis tissue samples (6 responders, 7 nonresponders). Profile data were extracted using Excel and MeV 4.9 (http://www.tm4.org/mev), and GSEA was performed using GSEA4.3.2 (http://www.broadinstitute.org/gsea). GSEA was used with the default settings.18 Briefly, GSEA tested whether genes from predefined gene sets were randomly distributed or exhibited specific up regulation in responders or non-responders. Gene sets were from curated gene set collections (n = 3050) and immunological gene set collections (n = 4872). The resulting enrichment values and false discovery rates were determined by 1000 gene set permutations. In addition, the peak analysis tool was used to classify gene sets representing similar biological signals.
2.6 Statistical analysis
SPSS for all data (version 19.0, IBM) and GraphPad Prism (version 8.0) were used for statistical analysis and graphing. SPSS has good statistical analysis capabilities, but its graphs are not as nice as GraphPad Prism, which has a dual function for creating graphs and statistics, although its statistical functions are not as good as those of SPSS. In the study, data with normal distribution were expressed as mean ± SD (standard deviation), and the non-normally distributed data were described as median (quartile1, quartile3). Paired or unpaired t-tests to test normal data with equal squared difference, Mann–Whitney U test for unpaired continuous variables with non-normal data were used. Bivariate correlation between variables was calculated using Spearman's rank correlation coefficient. Categorical variables were analyzed with the Chi-square test or Fisher's test. To determine the cutoff value of ΔCXCL10, ΔCXCR3 for the diagnosis of HBeAg SC, the receiver operating characteristic curve (ROC) was used. Survival curves (HBeAg SC) were plotted by the Kaplan–Meier method and compared with the log-rank test. HBeAg SC was estimated using univariate and multivariate Cox regression analyses. The p < 0.05 was considered statistically significant.
3 RESULTS
A total of 118 HBeAg (+) CHB patients (75.16%, 118/157) completed at least 96 weeks of TDF treatment, and 25 patients (15.92%) withdrew prematurely, including six who lost to follow-up (Figure S1). In addition, there were no other liver-related complications or hepatitis flares presented throughout the 96-week TDF treatment period, as indicated by clinical manifestations and laboratory tests. Minor complications, such as low-grade fever, digestive tract reactions, and skin rash, resolved rapidly after symptomatic treatment. The other clinical indices are shown in Table 2, which indicates that there was no significant difference in these indices between HBeAg SC and non-SC patients with CHB at baseline.
| Variablesa | All patients (n = 118) | HBeAg SC (n = 29) | Non-SC (n = 89) | p-value |
|---|---|---|---|---|
| Age (years) | 36 (28, 43) | 34.3 ± 8.68 | 37 (30, 44.5) | 0.1568 |
| Gender (M,F) | 98, 20 | 23, 6 | 75, 14 | 0.5364 |
| ALB (g/L) | 42.9 (40.2, 46.5) | 42.9 (40.6, 47.3) | 42.9 (39.7, 46.2) | 0.3895 |
| ALT (U/L) | 209 ± 65.7 | 233 ± 75.8 | 202 ± 60.6 | 0.0734 |
| AST (U/L) | 123 (81.8, 164) | 128 (81, 169) | 81.5 (113, 162) | 0.4830 |
| TBiL (μmol/L) | 27 (15.8, 35) | 27 (15, 30.5) | 27 ± 12.8 | 0.4828 |
| HBV DNA (lg, copies/mL) | 6.03 (4.98, 7.56) | 6.19 ± 1.29 | 6.15 (4.9, 7.59) | 0.8949 |
| HBsAg (lg, IU/mL) | 2.54 (1.49, 3.48) | 2.67 (1.17, 3.62) | 2.51 (1.57, 3.44) | 0.6736 |
| HBeAg (lg, PEIU/mL) | 1.22 (0.6, 2.0) | 1.28 ± 0.765 | 1.15 (0.59, 2.02) | 0.8900 |
| CXCL10 (pg/mL) | 131 (117, 154) | 136 ± 26.5 | 130 (117, 152) | 0.5370 |
| CXCR3 (pg/mL) | 172 (149, 200) | 178 ± 31.2 | 170 (149, 198) | 0.5106 |
- Note: The ethnicity of the included subjects is Han population.
- Abbreviations: CHB, chronic hepatitis B; Q, quartile; SC, HBeAg seroconverting.
- a Values are expressed as mean ± standard deviation (SD), number, or median (Q1, Q3).
3.1 CXCL10 and CXCR3 expression in CHB patients
The mean value of baseline CXCL10 protein in the serum of HBeAg SC, non-SC patients, and healthy donors (HD) was (136.41 ± 26.05), (133.60 ± 21.05), and (93.35 ± 28.27) pg/mL, respectively, and baseline CXCR3 protein was (177.87 ± 30.67), (173.41 ± 26.48), and (155.66 ± 24.69) pg/mL, respectively. Moreover, CXCL10 and CXCR3 levels were significantly higher in the sera of all CHB patients than in those of HD (Figure 1A,B). The CXCL10 and CXCR3 mRNA of PBMCs from all CHB patients were also significantly higher than those from HD (p = 0.0040, 0.0019 for CXCL10; p = 0.0032, 0.0005 for CXCR3) (Figure 1C,D).
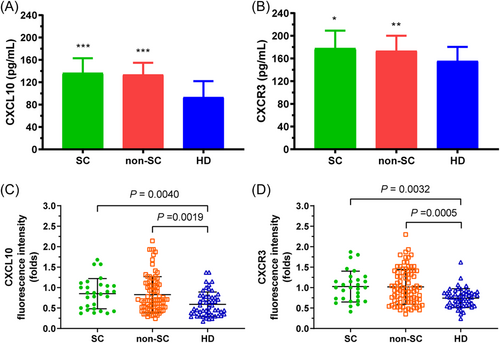
Comparison of baseline CXCL10 and CXCR3 protein levels between CHB patients and HD. CXCL10 sera had significantly higher levels in all CHB patients (HBeAg SC, non-SC) than in HD (A). CXCR3 serum levels were also significantly higher in all CHB patients (HBeAg SC, non-SC) (B). However, there was no significant difference in serum CXCL10 (CXCR3) protein between HBeAg SC and non-SC patients. In addition, CXCL10 (C) and CXCR3 (D) mRNA of PBMC had significantly higher levels in all CHB patients (HBeAg SC, non-SC) than in HD. However, there was no significant difference in CXCL10 (CXCR3) mRNA between HBeAg SC and non-SC patients. The mRNA expression of CXCL10 and CXCR3 was normalized to the reference gene (GAPDH). ***p < 0.0001, **p < 0.001, *p < 0.01 compared with HD group. CHB, chronic hepatitis B; mRNA, messenger RNA.
3.2 Correlation of CXCL10 or CXCR3 between PBMC and sera
CXCL10 mRNA in the PBMC of HBeAg SC patients and CXCL10 protein in the paired sera showed a significant positive relationship (R = 0.7112, p < 0.0001) (Figure S2A), but the correlation was not significant in the HBeAg non-SC patients (R = 0.2033, p = 0.0560) (Figure S2B). Similarly, the positive relationship with CXCR3 is significant in HBeAg SC patients (R = 0.6514, p < 0.0001) (Figure S2C), but the correlation was not significant in non- SC patients (R = 0.1744, p = 0.1020) (Figure S2D).
3.3 Correlation between sera ALT and CXCL10 or CXCR3 protein
During 96 weeks of antiviral treatment, decreasing serum ALT levels were associated with decreases in serum CXCL10 and CXCR3 protein. In HBeAg SC patients, the decrease in the levels of ALT and CXCL10 paralleled each other and showed a significant positive correlation (R = 0.9643, p = 0.0028; Figure 2A), but in patients without SC, the correlation was not significant (R = 0.6071, p = 0.1667; Figure 2B). Similarly, there was a significant positive relationship between changing ALT and CXCR3 levels (R = 0.9286, p = 0.0067; Figure 2C) in HBeAg SC patients, but no significance in HBeAg non-SC patients (R = 0.7500, p = 0.0663; Figure 2D).
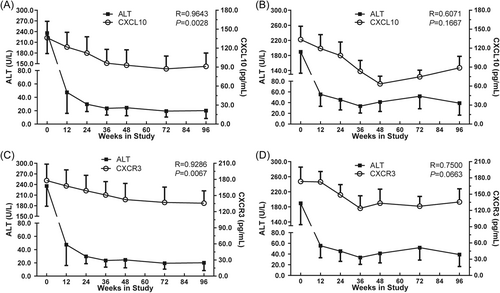
Correlation between sera ALT and CXCL10 or CXCR3 protein in HBeAg SC and not SC patients. The relationship between sera ALT and CXCL10 is shown for patients with HBeAg SC (A) and patients without HBeAg SC (B). The relationship between sera ALT and CXCR3 is shown for patients with HBeAg SC (C) and patients without HBeAg SC (D). The x-axis indicates the different treatment time points (time points week 60 and 84 are invalid); A and B on the right y-axis indicate the CXC10 concentrations; C and D on the right y-axis indicate the CXCR3 concentrations; and the left y-axis indicates sera ALT levels. Correlations were analyzed using Spearman correlation analysis. SC, seroconversion.
3.4 Multiple logistic regression of correlation between HBeAg SC and clinical indicators
Multiple logistic regression analysis was performed to test whether sera ΔCXCL10 were independently and significantly related to HBeAg SC (Table 3). Model 1, which included ΔCXCL10, showed that ΔCXCL10 was a significant and independent factor associated with HBeAg SC (odds ratio [OR]: 0.890, 95% confidence interval [CI]: 0.846–0.937, p = 0.000). Model 2, in which ΔCXCL10 was replaced by ΔCXCR3, showed that ΔCXCR3 was not significantly related to HBeAg SC (OR: 0.980, 95% CI: 0.953–1.008, p = 0.168). When ΔCXCL10 and ΔCXCR3 were both included as independent variables in model 3, the addition of ΔCXCR3 did not affect the significant correlation of ΔCXCL10 with HBeAg SC (OR: 0.892, 95% CI: 0.848–0.938, p = 0.000).
| Model 1 (without ΔCXCR3) | Model 2 (without ΔCXCL10) | Model 3 (all patients) | |||||||
|---|---|---|---|---|---|---|---|---|---|
| Variablesa | OR | 95% CI | p-value | OR | 95% CI | p-value | OR | 95% CI | p-value |
| Age (years) | 0.995 | 0.931–1.063 | 0.876 | 0.984 | 0.933–1.037 | 0.548 | 0.998 | 0.934–1.067 | 0.960 |
| Gender (M, F) | 1.185 | 0.240–5.855 | 0.835 | 1.392 | 0.420–4.611 | 0.589 | 1.110 | 0.223–5.531 | 0.899 |
| ALB (g/L) | 1.037 | 0.901–1.194 | 0.612 | 1.073 | 0.958–1.202 | 0.222 | 1.038 | 0.902–1.194 | 0.603 |
| ALT (U/L) | 1.004 | 0.994–1.013 | 0.460 | 1.008 | 1.000–1.015 | 0.045 | 1.004 | 0.994–1.014 | 0.414 |
| AST (U/L) | 1.006 | 0.993–1.020 | 0.366 | 1.001 | 0.991–1.011 | 0.844 | 1.007 | 0.993–1.021 | 0.308 |
| TBiL (μmol/L) | 0.988 | 0.949–1.028 | 0.536 | 1.003 | 0.972–1.035 | 0.855 | 0.988 | 0.949–1.028 | 0.540 |
| HBV DNA (lg, IU/mL) | 0.993 | 0.622–1.585 | 0.976 | 0.946 | 0.665–1.346 | 0.757 | 1.006 | 0.629–1.611 | 0.979 |
| HBsAg (lg, IU/mL) | 0.867 | 0.513–1.464 | 0.593 | 1.053 | 0.702–1.579 | 0.803 | 0.887 | 0.522–1.509 | 0.660 |
| HBeAg (lg, PEIU/mL) | 0.993 | 0.469–2.102 | 0.985 | 1.213 | 0.668–2.205 | 0.526 | 1.078 | 0.494–2.350 | 0.851 |
| ΔCXCL10 (pg/mL) | 0.890 | 0.846–0.937 | 0.000 | – | – | – | 0.892 | 0.848–0.938 | 0.000 |
| ΔCXCR3 (pg/mL) | – | – | – | 0.980 | 0.953–1.008 | 0.168 | 0.987 | 0.953–1.023 | 0.477 |
- Abbreviations: 95% CI, 95% confidence intervals; OR, odds ratio; TDF, tenofovir disoproxil fumarate.
- a Variables at baseline, delta (Δ) shows the change after TDF treatment for 48 weeks.
3.5 Immunohistochemical analysis of CXCL10 and CXCR3 in liver tissue
The results of immunohistochemical analysis were presented as the H-score of the image obtained by Caseviewer software. That is, the more the substance measured, the higher the H-score and the more protein expression. The representative immunohistochemical results (images) were shown (Figure 3). The results showed that CXCL10 expression in liver tissue at baseline was significantly higher than that after 96 weeks of TDF treatment in the 11 patients with HBeAg SC (Figure 4A), while the difference was not significant in the 14 patients without SC (Figure 4B). In addition, the baseline CXCL10 protein level in the liver tissue of patients with HBeAg SC was significantly higher than that of patients with non-SC (Figure 4C). Similarly, baseline CXCR3 protein was significantly higher than that in 11 HBeAg SC patients (Figure 4D), but for the 14 non-HBeAg SC patients, the comparison was not significant (Figure 4E), moreover, there was no significant difference of baseline CXCR3 between HBeAg SC and non-SC patients (Figure 4F).
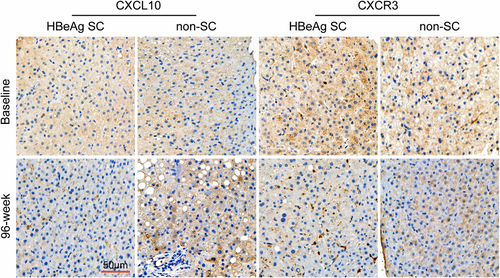
Immunohistochemical staining of CXCL10 and CXCR3 in liver tissue. Representative immunohistochemical results (images) were obtained with Caseviewer using labeled antibodies against CXCL10 and CXCR3. A significantly high amount of CXCL10- and CXCR3-positive signals (brown cells) was detected at baseline in the hepatocyte region of patients with HBeAg SC. All images were acquired at ×200 magnification. The scale bar represents 50 μm. SC, seroconversion.
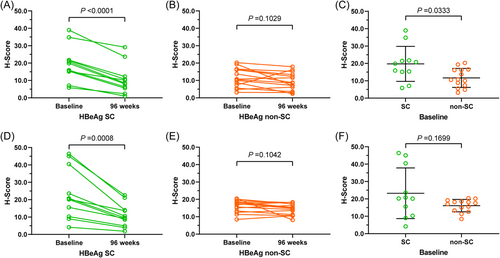
Summary of CXCL10 (CXCR3) protein comparison before and after 96 weeks of TDF treatment. Comparison of CXCL10 protein in liver tissue between baseline and after 96-week TDF treatment of CHB patients with HBeAg SC (A), with non-SC (B); comparison of baseline CXCL10 levels between HBeAg SC and non-SC patients (C); Comparison of CXCR3 protein in liver tissue between baseline and after 96-week TDF treatment of CHB patients with HBeAg SC (D), with non-SC (E); comparison of baseline CXCR3 between HBeAg SC and non-SC patients (F). SC, seroconversion; TDF, tenofovir disoproxil fumarate.
3.6 ROC analysis of sera ΔCXCL10, ΔCXCR3 on the diagnosis of HBeAg SC
In the ROC curve, the variable indices showed efficient performance in confirming HBeAg SC. Leave-one-out cross-validation showed an area under the curve (AUC) of CXCL10 was 0.8867 (95% CI: 0.8203–0.9530) (Figure 5A), CXCR3 was 0.5868 (95% CI: 0.4631–0.7104) (Figure 5B). The distinction between HBeAg SC and not SC showed the possibility of developing CXCL10 for the differential diagnosis of HBeAg SC or not (p < 0.0001). In addition, the cutoff value was 48.85 pg/mL (ΔCXCL10) and 28.40 pg/mL (ΔCXCR3) for differentiating HBeAg SC and no-SC patients (Figure 5C,D). The sensitivity and specificity of CXCL10 and CXCR3 indexes were 0.8876, 0.7586, and 0.7978, 0.4828, respectively. Moreover, the AUC of the combination (ΔCXCL10 + ΔCXCR3) was 0.8239, whose diagnostic performance was lower than that of a single CXCL10 index (data not shown).
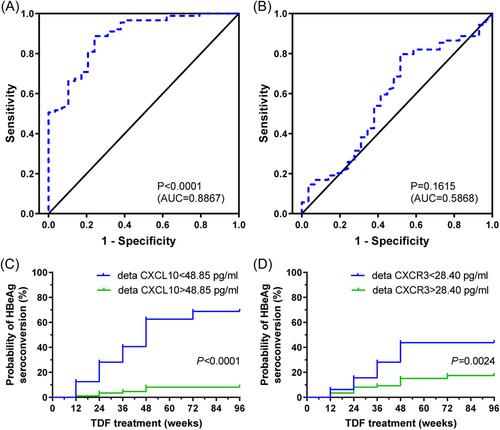
ROC curve analysis and prognostic value of sera △CXCL10 or △CXCR3 from CHB patients. Receiver operator characteristic curves (ROC) of the rate of decline for CXCL10 (A) and CXCR3 (B) from baseline to 48 weeks after TDF treatment to distinguish HBeAg SC CHB patients with HBeAg (+) at week 96. The prognostic value of sera △CXCL10 (C), △CXCR3 (D) was in CHB patients during TDF treatment. Probability of HBeAg SC in 118 HBeAg (+) CHB patients in relation to decreasing CXCL10 (CXCR3) levels after 48 weeks of TDF treatment (p < 0.0001, =0.0024 by log-rank test). CHB, chronic hepatitis B; SC, seroconversion; TDF, tenofovir disoproxil fumarate.
In addition, univariate Cox regression analysis revealed that patients with a lower ΔCXCL10 score were significantly more likely to have HBeAg after 48 weeks of TDF treatment SC (p = 0.000). Based on multivariate analysis, ΔCXCL10 levels after 48 weeks of TDF treatment (hazard ratio = 0.932, 95% CI = 0.910–0.955, p = 0.000), which were independent biomarkers of HBeAg SC at year 2 (96 weeks), but ΔCXCR3 levels after 1 year of TDF treatment did not have a significantly higher probability of HBeAg SC (p = 0.209) (Table 4).
| Univariate analysis | Multivariate analysis | |||||
|---|---|---|---|---|---|---|
| Variables | HR | 95% CI | p-value | HR | 95% CI | p-value |
| Age (years) | 0.970 | 0.930–1.012 | 0.156 | 0.938 | 0.952–1.043 | 0.900 |
| Gender (M, F) | 1.254 | 0.510–3.079 | 0.622 | 0.996 | 0.348–2.531 | 0.867 |
| ALB (g/L) | 1.040 | 0.956–1.131 | 0.361 | 1.013 | 0.924–1.111 | 0.776 |
| ALT (U/L) | 1.006 | 1.001–1.012 | 0.025 | 1.004 | 0.997–1.012 | 0.263 |
| AST (U/L) | 1.003 | 0.995–1.011 | 0.485 | 0.999 | 0.99–1.009 | 0.897 |
| TBiL (μmol/L) | 1.001 | 0.974–1.028 | 0.949 | 0.995 | 0.971–1.021 | 0.723 |
| HBV DNA (lg, copies/mL) | 0.972 | 0.740–1.277 | 0.839 | 0.995 | 0.717–1.383 | 0.977 |
| HBsAg (lg, IU/mL) | 0.957 | 0.712–1.285 | 0.768 | 1.012 | 0.697–1.47 | 0.951 |
| HBeAg (lg, PEIU/mL) | 1.027 | 0.639–1.653 | 0.912 | 1.021 | 0.611–1.704 | 0.938 |
| △CXCL10 (pg/mL) | 0.932 | 0.910–0.955 | 0.000 | 0.934 | 0.909–0.961 | 0.000 |
| △CXCR3 (pg/mL) | 0.986 | 0.963–1.008 | 0.209 | 1.000 | 0.975–1.026 | 0.982 |
- Abbreviations: CI, confidence intervals; HR, hazard ratio; SC, seroconversion.
3.7 Effects of ΔCXCL10 and ΔCXCR3 on the prediction of HBeAg SC
HBeAg SC Kaplan–Meier analysis showed that the 96-week overall SC rate of CHB patients with low serum ΔCXCL10 was significantly higher than that of CHB patients with high serum ΔCXCL10 (p < 0.0001, Figure 5C). At the same time, low serum ΔCXCR3 had significantly higher HBeAg SC than that of CHB patients with high ΔCXCR3 (p = 0.0024, Figure 5D). In addition, serum ΔCXCL10 of HBeAg SC CHB patients was significantly lower than that of the group without SC (Figure S3A); for serum ΔCXCR3, there was no significant difference between HBeAg SC and non-SC patients (Figure S3B).
3.8 Gene set enrichment analysis
To investigate the changes of related proteins of CXCL10 in the process of HBeAg SC in CHB patients during the course of anti-HBV treatment, the gene sets for GSEA were derived from curated and immunological gene signature databases. For each set of gene expression data, the algorithm checks whether they are enriched in the responder group. In the curated gene signatures, a majority of gene sets were found to be remarkably enriched in CXCL10-high (489/2054 gene sets) and CXCL10-low (20/2054 gene sets); at the same time, in the immunological gene signatures, a majority of gene sets were found to be remarkably enriched in CXCL10-high (2844/4872 gene sets) and CXCL10-low (30/4872).
4 DISCUSSION
In the current cross-sectional observational study, slowly decreasing serum CXCL10 and CXCR3 levels were shown to correlate significantly positively with HBeAg SC in CHB patients during TDF treatment, suggesting that slowly decreasing serum CXCL10/CXCR3 levels are a safe probability for HBeAg SC. Moreover, serum CXCL10 and CXCR3 levels decrease in CHB patients on 96-week TDF treatment along with the decrease ALT. Serum levels of ΔCXCL10 (baseline to 48-week TDF treatment) and ΔCXCR3 are 48.85 pg/mL and 28.40 pg/mL, respectively, to distinguish HBeAg SC from non-SC patients with 96-week TDF treatment.
In the course of CHB infection, the migration of lymphocytes into liver tissue plays a crucial role in the extent and outcome of the disease, and this migration process is regulated by many factors, of which the interaction between chemokines and their receptors is one of the most important factors.19, 20 Chemokines play a crucial role in the process of triggering the migration and aggregation of inflammatory cells into liver tissue, either triggering an antiviral immune response or eliciting an inflammatory response.21 CXCL10 is abundant in chemotactic monocytes and hematopoietic cell colonies, inhibits T-cell activation, mediates cytolysis, inhibits angiogenesis, and is involved in disease onset and progression.7, 22 Our previous study described the altered profile of CXCL10 in CHB patients during antiviral treatment with entecavir.6 In the current study, our results showed that CXCL10 and CXCR3 were significantly increased in the serum of CHB patients compared with healthy donors, suggesting that chemokines and their receptors are associated with disease states.23
ALT is a sensitive indicator of hepatocellular injury and to some extent reflects the degree of hepatocyte damage and necrosis.24 From the reports, chemokines interact with their receptors and play two sides in the disease process: One side mediates the aggregation and infiltration of inflammatory cells to the focus, playing an antiviral effect; on the other hand, they stimulate leukocytes and lymphocytes to release various degradative enzymes, oxygen free radicals, etc., leading to tissue and organ damage, further aggravating local inflammation and contributing to the chronification of hepatitis B.25 At the same time, these activated cells may secrete more chemokines, which in turn mediate the aggregation of lymphocytes in liver tissue and participate in the inflammatory response.26 In the present study, CXCL10/CXCR3 levels in CHB patients decrease during 96 weeks of TDF treatment with the decrease of ALT level. Moreover, the relationship between the changing ALT and CXCL10/CXCR3 levels is significant in HBeAg SC patients but not significant in non-SC patients, suggesting that CXCL10 and CXCR3 are associated with the HBeAg SC process of CHB patients during TDF treatment.27 In the HBeAg SC process, the immune function of CHB patients gradually restores from an impaired or debilitating functional status to normal immune function (immune imbalance).
When the liver becomes inflamed due to HBV infection, a large number of chemokines such as CXCL10 and CXCL11 are produced, which can increase during local viral infection and produce directional migration signals. They play a chemotactic role for various inflammatory cells in the circulation and cause them to selectively migrate to specific sites via vascular endothelial cells to exert an antiviral effect.2, 28 So that, the high expression of CXCL10 protein in liver tissue suggests a more effective antiviral effect, such as in the present study, where immunohistochemical results showed that CXCL10/CXCR3 protein levels in the liver were significantly higher than the protein levels of HBeAg patients with antiviral treatment after 96 weeks, but the change in CXCL10/CXCR3 had no significance in HBeAg non-SC patients. These results suggest that CXCL10/CXCR3 in liver tissue is associated with the HBeAg SC process in CHB patients.29-31 Moreover, CXCL10/CXCR3 proteins in serum are significantly positively related to CXCL10/CXCR3 mRNA in PBMC only in HBeAg patients (SC), suggesting that the immune function of CHB patients gradually restores during TDF treatment, in which CXCL10/CXCR3 plays a role, while the related mechanisms should be investigated in a future study.
During the course of antiviral treatment, HBV is suppressed, and the host mobilizes more lymphocytes to the liver tissue through the mutual mediation of CXCL10 and CXCR3 to achieve the elimination of HBV-infected cells.7, 32 In the current study, our results also showed that CXCL10 in the liver (but not CXCR3) was significantly higher in HBeAg SC patients than in patients who did not have SC, suggesting that CXCL10 is related to the intensity of the immune response.33 In addition, it is suggested that the increase in CXCL10/CXCR3 may be a self-protective mechanism of the body to prevent further exacerbation of the inflammatory response in the liver when the immune response to eliminate HBV is strong.20, 26 In addition, it has been reported that CXCL10 has been shown to be an important marker of hepatic inflammatory response and may be involved in HBsAg and HBeAg clearance in CHB,12, 26 so CXCL10 in the liver may be related to the immunological process of HBeAg SC, although the details should be investigated in a future study. In addition, using data from GEO and GSEA analysis, we identified the genetic determinants of response to interferon-alpha (IFN-α) therapy,34 revealing that immune-related genes and pathways are the ascending host responses to chronic HBV infection and the major determinants of response to IFN-α therapy.35, 36
In summary, we determine the transform of CXCL10 or CXCR3 is closely related to HBeAg SC for CHB patients during TDF treatment. As far as we know, this is the first study to profile the relationship of CXCL10 and CXCR3 level and response to TDF treatment of CHB. In addition, ROC curves were delineated to confirm the optimal cutoff values of the ΔCXCL10 (48.85 pg/mL) (baseline to TDF treatment for 48 weeks) and ΔCXCR3 (28.40 pg/mL) for discriminating HBeAg SC patients at week 96. Thus, we established a proxy for differentiation CHB patients undergoing HBeA SC or not, although, which would be further identified with expanded cases in a following study.
AUTHOR CONTRIBUTIONS
Jiezuan Yang conceived and designed the study and wrote the manuscript. Shaoyan Xu and Jinlin Cheng carried out the data collection and analysis. Xuying Yin and Dong Yan contributed to the manuscript writing and data collection. Xuefen Li helped with critical revision of the manuscript. All authors reviewed and approved the final manuscript.
ACKNOWLEDGMENTS
The authors sincerely thank all those who participated in this study. This study was funded by grants from the Zhejiang Province Traditional Chinese Medicine Science and Technology Plan Project (2023ZL482), the Zhejiang Province Public Welfare Technology Application Research Project (No. LGF21H030009), and the National Natural Science Foundation of China (No. 82072357).
CONFLICT OF INTEREST STATEMENT
The authors declare no conflicts of interest.
ETHICS STATEMENT
The project was reviewed and approved by the Ethics Committee of the First Affiliated Hospital of Zhejiang University School of Medicine (No. 2015-497).
Open Research
DATA AVAILABILITY STATEMENT
The data that support the findings of this study are available from the corresponding author upon reasonable request.


