SARS-CoV-2 infection alters the gut microbiome in diabetes patients: A cross-sectional study from Bangladesh
[Correction added on 18 May 2023, after first online publication: The author affiliations have been corrected.]
Abstract
Populations of different South Asian nations including Bangladesh reportedly have a high risk of developing diabetes in recent years. This study aimed to investigate the differences in the gut microbiome of COVID-19-positive participants with or without type 2 diabetes mellitus (T2DM) compared with healthy control subjects. Microbiome data of 30 participants with T2DM were compared with 22 age-, sex-, and body mass index (BMI)-matched individuals. Clinical features were recorded while fecal samples were collected aseptically from the participants. Amplicon-based (16S rRNA) metagenome analyses were employed to explore the dysbiosis of gut microbiota and its correlation with genomic and functional features in COVID-19 patients with or without T2DM. Comparing the detected bacterial genera across the sample groups, 98 unique genera were identified, of which 9 genera had unique association with COVID-19 T2DM patients. Among different bacterial groups, Shigella (25%), Bacteroides (23.45%), and Megamonas (15.90%) had higher mean relative abundances in COVID-19 patients with T2DM. An elevated gut microbiota dysbiosis in T2DM patients with COVID-19 was observed while some metabolic functional changes correlated with bidirectional microbiome dysbiosis between diabetes and non-diabetes humans gut were also found. These results further highlight the possible association of COVID-19 infection that might be linked with alteration of gut microbiome among T2DM patients.
1 INTRODUCTION
Diabetes mellitus is a fast-growing global problem with huge social, health, and economic impacts. It is a chronic glucose metabolism disorder with severe clinical illness.1 As stated by the International Diabetes Federation (IDF) in 2022, 536.6 million people are living with diabetes (diagnosed or undiagnosed), 79% of which are from low- and middle-income countries. The number of diabetic patients will increase to 700 million by 2045.2 It is often accompanied by various comorbidities and long-term complications, including obesity, hypertension, vasculopathy, a pro-inflammatory and hypercoagulable state, and cardiovascular disease.3
Coronavirus disease 2019 (COVID-19) is a complex clinical syndrome caused by the severe acute respiratory syndrome coronavirus 2 (SARS-CoV-2). Being a disease burden, COVID-19 has resulted in a severe public health crisis with substantial illness and death.4 Clinical research in many countries established that severe forms of COVID-19 are interconnected with obesity and type 2 diabetes mellitus (T2DM), irrespective of ethnicity.4, 5 Recently, a bidirectional relationship has been reported between COVID-19 and diabetes.6 Several COVID-19 incidences were found with new onset of diabetes and severe metabolic complications of pre-existing diabetes, like diabetic ketoacidosis and hyperosmolar hyperglycemic state.7, 8 The pathophysiology of COVID-19-related diabetes seems to be quite complicated and makes it challenging for clinical management. Earlier reports indicated that suppressed immune functions and high levels of glycated hemoglobin (HbA1c > 9%) in diabetic patients increase the risk of hospitalization and pneumonia-related severity by 60% in bacterial and COVID-19 acute infections.7
Thousands of microorganisms, including bacteria, archaea, viruses, and fungi, reside in the human gut.9, 10 These microbiota carry out various host physiological functions including dietary digestion, imparting protective immunity against pathogens, and maintaining immune homeostasis.11 The gut microbiome is vital in maintaining both gastrointestinal and immune function, as well as being crucial for the digestion of nutrients, confirmed by several studies.12, 13 Differences in gut microbial composition and its metabolic efficiency may be responsible for the predisposition of an individual to metabolic disorders such as obesity and diabetes.13, 14 Several studies reported apparent changes in gut microbiomes, precisely gut dysbiosis, after COVID-19 infection.8 This gut microbial change persisted despite clearance of SARS-CoV-2 and recovery of respiratory symptoms. Therefore, microbiota homeostasis leads to viral clearance and disease recovery.8, 11 Moreover, COVID-19 in elderly patients has been reported as fatal due to the loss of intestinal microbial diversity.15 Earlier studies highlighted that COVID-19 infection is also linked to bacterial co-infections and superinfections,9, 16 leading to increased disease severity and mortality. Therefore, it is indispensable to explore new perspectives for therapeutic approaches of COVID-19. However, the relationship among the human gut microbiome, diabetes mellitus, and coronavirus disease (COVID-19) is almost unknown. Thus, it is crucial to uncover the intestinal microbiota's role in diabetic patients and healthy individuals in the manifestation of COVID-19. This study investigated the dysbiosis of gut microbiomes and predicted metagenome functions in T2DM patients with COVID-19 to uncover the microbial signature in healthy people and patients with T2DM and COVID-19 infections.
2 STUDY DESIGN AND METHODS
2.1 Ethical approval
This study was conducted in accordance with the Institutional Review Board of 250 Bedded General Hospital, Chattogram, Bangladesh (IRB#00981). Written informed consent before the interview was obtained from all participants.
2.2 Study population and sampling
We performed a cross-sectional study to elucidate the gut microbiome dysbiosis of COVID-19 patients with T2DM (CD), COVID-19 patients without T2DM (CWD), and T2DM (D) and compared results with the gut microbiome of healthy control (HC) subjects. All participants were recruited from public and private hospitals and clinics in the Chattogram division of Bangladesh (Supporting Information: Table S1). We collected 52 fecal samples, including CD = 10, CWD = 12, D = 20, and HC = 10, from the study participants between June to December 2021. Among these study population, the CD and CWD subjects and six from D received antibiotic medication for 1 week (Supporting Information: Table S1). Each fecal sample was collected in a sterile tube and stored at −80°C before microbial analysis. We followed a predefined and previously tested selection criteria for recruiting study participants.17 The patients were diagnosed positive for COVID-19 on an average of 4.7 days (range 2–9 days) after the onset of clinical signs of SARS-CoV-2 positive through RT-qPCR.8, 16 For this study, patients with COVID19 and healthy people >18 years old were selected. Patients with other types of diabetes, pregnant women, breastfeeding mothers, and patients not willing to participate were excluded from the research work.
2.3 DNA extraction and high-throughput 16S ribosomal gene sequencing
Genomic DNA from 52 fecal specimens was extracted using the microbiome DNA purification kit (Thermo Fisher Scientific) following the manufacturer's instructions. The concentration and purity of DNA samples were checked by NanoDrop spectrophotometer 2000c (Thermo Fisher Scientific), Qubit 3.0 fluorometer (Invitrogen, Life Sciences), and agarose gel (1%, w/v) electrophoresis.18 The 16S ribosomal RNA (rRNA) gene amplification was performed using the primers (341F: 5′-CCTACGGGNGGCWGCAG-3′; 806R: 5′-GACTACHVGGGTATCTAATCC-3′) directionally targeting the V3 and V4 hypervariable region of the 16S rRNA gene.8 The amplified PCR products were purified, normalized, pooled, and finally sequenced on the Illumina MiSeq platform using 2 × 300-bp chemistry according to the Illumina standard protocol for 16S amplicon sequencing.
2.4 Sequence data analysis
The generated FASTQ files were assessed for quality using FastQC v0.11.19 Adapter sequences and low-quality ends per read were trimmed using Trimmomatic v0.39 with set criteria of sliding window size 4; a minimum average quality score of 20; and a minimum read length of 40 bp.20 Quantitative Insights Into Microbial Ecology 2 (QIIME 2), an integrated pipeline, was used for OTU (operational taxonomic unit) clustering, phylogenetic estimation, and taxonomic assignment.21 VSEARCH metagenomics algorithm integrated in QIIME 2 was employed for read joining, dereplicate-sequences, de novo clustering (OTU clustering with 99% identity), de novo chimera checking (exclude chimeras and “borderline chimeras”).22 Generate a tree for phylogenetic diversity analyses, MAFFT algorithms23 were used to align, and FastTree (v2.1.8) was used to build the tree.24
For the taxonomic assignment, Greengenes (v13_5) database (99% OTU and taxonomy) was used for the prokaryotic taxonomic assignment.25 The reference database was trained using the 16S and 18S sequencing primer pairs using a naive-bayes classifier.26 Classify-sklearn algorithms were utilized to classify the assigned OTU for prokaryotic and eukaryotic samples.21 We also utilized the Phylogenetic Investigation of Communities by Reconstruction of Unobserved States 2 (PICRUSt2) to find out the possible metabolic functional potentials of the gut microbiomes between diabetes (e.g., CD and D) and non-diabetes (CWD) states.
2.5 Statistical analysis
The downstream analysis, which included alpha–beta diversity, microbiological composition, and statistical comparison, was performed using Phyloseq (v 4.2) package27 on R programs (v 4.2.1).28 Observed, Chao1, Shannon, Simpson, InvSimpson, and Fisher alpha diversity were estimated and plotted by using “Vegan,” “ggplot2,” and “ggpubr” R packages. The Wilcoxon sum rank test in the “microbiomeutilities” R package (https://microsud.github.io/microbiomeutilities/) was used to evaluate the statistical comparison between the two locations. The diversity across the sample (Beta-diversity), QIIME 2 output files including rooted tree file, was directly read by qiime2R (v0.99.6) R package29 and converted to the phyloseq object. Beta-diversity was measured with the principal coordinate analysis (PCoA) using Bray–Curtis, weighted unifrac, and unweighted unifrac dissimilarity matrices, and permutational multivariate analysis of variance (PERMANOVA) with 999 permutations to estimate a p value for differences between two locations. The nonmetric multidimensional scaling (NMDS) method was also applied for the above-mentioned distance metrics including PERMANOVA. Phyloseq, Vegan, microbiome utilities, and ggplot2 packages were employed for taxonomic comparison and plotting.30 Genera with Kruskal–Wallis p < 0.05 were subjected to Wilcoxon rank-text (unpaired) for multiple comparisons with Bonferroni correction to avoid false discovery rate (FDR) from rarefied data.31 The metagenomic function of 16S rRNA data set in HC, diabetic, and COVID-19 community was predicted following the PICRUSt2 pipeline (https://github.com/picrust/picrust2)32 in support of the KEGG database. In addition, STAMP (Statistical Analysis of Metagenomic Profiles) was employed to analyze the number of marker genes assigned to a functional profile indicating the number of sequences assigned to different biological subsystems or pathways.33 Linear discriminant analysis (LDA) with an LDA cut-off value of 2.0 and more was used to find differentially expressed pathways.15 A p value of ≤0.05 was considered statistically significant in all stages of data analysis. Core microbiomes were selected with 95% prevalence (76 taxa), and differential heat trees were plotted using the metacoder R package.34
3 RESULTS
3.1 Participant information and study design
Fifty-two (N = 52) eligible participants were subjected to the study following the strict selection procedure considering study participants who were COVID-19 patients with T2DM (CD = 10), COVID-19 patients without T2DM (CWD = 12), patients with only T2DM (D = 20), and healthy control (HC 10). Hypertension was the most common comorbidity (60%) among the patients. The gut microbiota was assessed using 16S rRNA gene sequencing from the study metagenomes. Detailed clinical data for study participants are presented in Supporting Information: Table S1.
3.2 Gut microbiomes dysbiosis in diabetes and COVID-19 patients
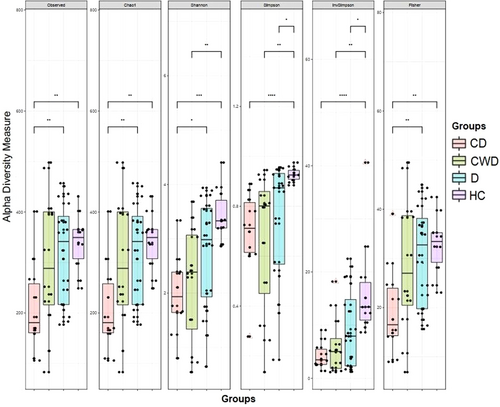
After quality filtering an average of 35,291 16S rRNA gene sequences (from a total of 1,835,137) per sample were obtained (min: 11,721; max: 52,530; median: 36,017) (Supporting Information: Table S2). Sequences were assigned to assess the differences in bacterial diversity within groups where it was observed that microbial alpha diversity was significantly (p = 0.006; Kruskal–Wallis test) decreased in COVID-19 patients with T2DM compared to the rest of the three groups (i.e., CWD, D, and HC). Conversely, within-sample microbial diversity was significantly increased in COVID-19 patients without T2DM (CWD) and T2DM patients (D) compared to HCs (Figure 1). In addition, within sample alpha diversity of the fecal microbiota in D and HC subjects (those who did not receive antibiotics) also showed distinct variations keeping significantly higher diversity in D compared to HC subjects (Supporting Information Figure 1a).
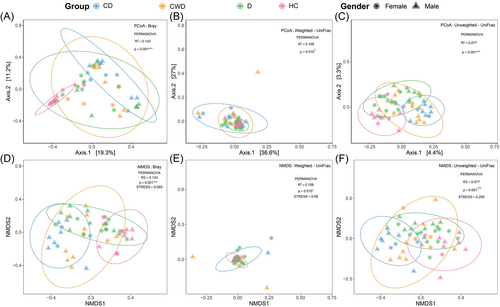
Beta diversity was calculated using Bray–Curtis, Weighted UniFrac, and Unweighted UniFrac methods, and PCoA and NMDS were performed to display gut microbiome diversity between sample groups. Similarly, permutational multivariate analysis of variance (PERMANOVA) showed a significant separation across CD, CWD, D, and HC cohorts (sum of squares = 0.551, mean of squares = 0.219, F = 1.559, R2 = 0.031, p = 0.001) (Figure 2). These results suggest that the COVID-19 patients with T2DM, COVID-19 patients without T2DM, and T2DM groups had unique diversity and microbial distance metric from the healthy control group. Significant differences in taxonomic composition at the OTU level were found across the subpopulations using Bray–Curtis (PERMANOVA: R2 = 0.143, p = 0.001 and R2 = 0.143, p = 0.001, stress = 0.093) (Figure 2A,D), Weighted UniFrac (PERMANOVA: R2 = 0.109, p = 0.015 and R2 = 0.109, p = 0.015, stress = 0.08) (Figure 2B,E), and Unweighted UniFrac (PERMANOVA: R2 = 0.077, p = 0.001 and R2 = 0.077, p = 0.001, stress = 0.205) (Figure 2C,F). These results were not confounded by the heterogeneity of subpopulation sex dispersions (Bray–Curtis: PERMDISP: F1, 93 = 0.68, p = 0.63; Weighted UniFrac: PERMDISP: F1, 93 = 0.72, p = 0.39; and Unweighted UniFrac: PERMDISP: F1, 93 = 0.71, p = 0.44) (Figure 2). Likewise, PERMANOVA showed a significant separation between the samples of D and HC cohorts that were not treated with antibiotics (R2 = 0.143, p = 0.001) (Supporting Information: Figure 1b).
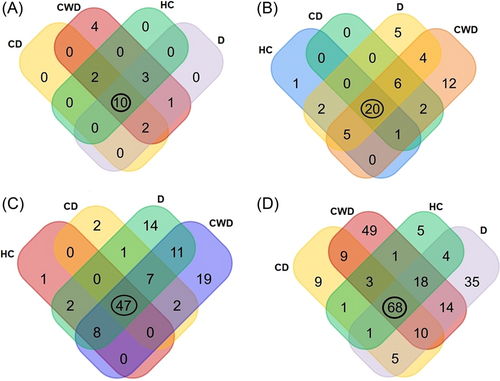
The unique and shared distribution of bacterial taxa found in CD, CWD, D, and HC human gut is represented in Venn diagrams (Figure 3). We detected 18 bacterial phyla including 10, 18, 16, and 15 phyla in CD, CWD, D, and HC samples, respectively. Of them, 10 phyla were found to be shared across four metagenomes (Figure 3A). Likewise, 58 orders of bacteria (including CD = 29, CWD = 50, D = 42, and HC = 29) were detected across four sample groups, of which only 20 orders were found to be shared (Figure 3B). We identified 114 bacterial families in the study metagenomes. Of them, 59, 94, 90, and 58 families of bacteria belonged to CD, CWD, D, and HC samples, respectively. Among the detected bacterial families, 41.23% of bacterial families were found to be commonly shared across four sample categories (Figure 3C). In this study, a total of 232 bacterial genera were detected, including 106, 172, 155, and 101 CD, CWD, D, and HC metagenomes, respectively, of which 68 (29.31%) genera were present in all of the four sample groups (Figure 3D). By comparing the detected bacterial genera across the sample groups, 98 unique genera were identified, of them 9, 49, 35, and 5 genera, respectively, had a sole association with CD, CWD, D, and HC metagenomes (Figure 3D).
3.3 Gut microbial dysbiosis in diabetes patients with or without COVID-19
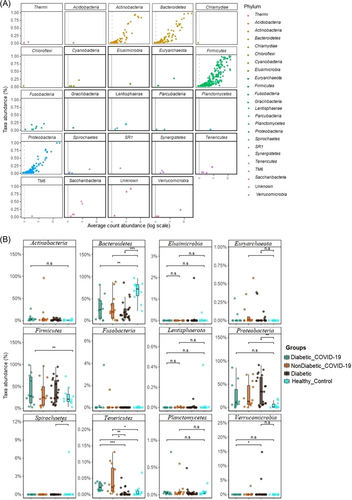
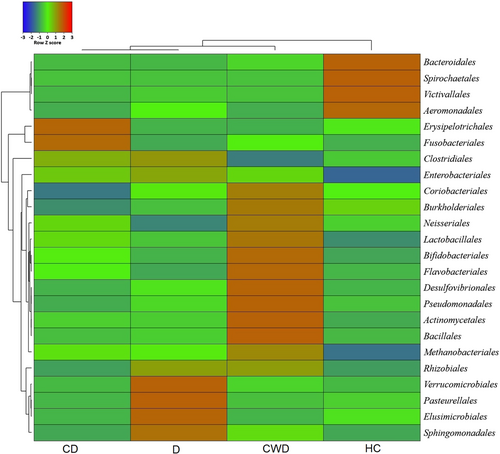
COVID-19 and T2DM infections caused significant differences (p = 0.003, Kruskal–Wallis test) in gut microbial communities at the phylum level. Firmicutes (34.93%), Bacteroidetes (34.26%), Proteobacteria (24.76%), and Actinobacteria (5.25%) accounted for more than 99% of the mean relative abundance (Figure 4A and Supporting Information: Data S1). We observed that overall gut microbiota composition differed significantly across the study groups (p = 0.003, Kruskal–Wallis test). Firmicutes had higher abundance in the CD group (42.83%) than in the CWD (29.93%), D (39.85%), and HC (24.48%), whereas the Bacteroidetes had more than two-fold higher mean relative abundance (69.79%) in the HC group compared to diseased groups (CD; 25.0%, CWD; 31.2% and D; 24.32%) (Figure 4B and Supporting Information: Data S1). The Proteobacteria were less abundant in the HC group (mean relative abundance 4.13%) than in the diseased groups such as CD (26.72%), CWD (25.76%), and D (32.9%). Remarkably, the COVID-19 patients without T2DM (i.e., CWD) gut metagenome had an exclusively unique association with four bacterial phyla (Planctomycetes, Acidobacteria, Chlamydiota, and Chloroflexi). The rest of phyla also differed significantly (p = 0.003, Kruskal–Wallis test) across these four groups keeping comparatively higher mean relative abundances in diseased groups (CWD > D > CD) than the healthy control group (Supporting Information: Data S1). The phylum level relative abundances of the gut microbiomes also showed significant disparity among the study subjects who did not receive any antibiotic medication (i.e., D and HC groups). Excluding six T2DM patients from the D group (who received antibiotics), Firmicutes was found as the predominantly abundant phylum in D (44.86%) followed by Proteobacteria (32.16%) and Bacteroidetes (20.81%). Conversely, Bacteroidetes had the highest relative abundance (69.83%) in the HC group (Supporting Information: Table S2). Moreover, 58 orders of bacteria were identified in four metagenomes with significant (p = 0.021, Kruskal–Wallis test) variations in their mean relative abundances. Among these microbial taxa, the CWD subjects had a sole association of 20.69% bacterial orders, whereas 8.62% orders were solely found in T2DM patients without COVID-19 (D) (Figure 5 and Supporting Information: Data S1). In this study, Bacteroidales had more than two-fold higher mean relative abundance (69.82%) in the healthy control group compared to CD (24.95%), CWD (31.19%), and D (24.31%) groups. Likewise, Aeromonadales had several-fold higher mean relative abundances (3.05%) in the healthy control group compared to the rest of the three diseased groups (<0.05% in each) (Figure 5 and Supporting Information: Data S1). Conversely, the Clostridiales were less abundant in the healthy control group (mean relative abundance 22.27% than in the diseased groups (e.g., CD [32.37%) and D [34.79%]) except for COVID-19 patients without T2DM group (15.09%). Moreover, Enterobacteriales (26.56%), Bacteroidales (24.99%), Lactobacillales (8.79%), and Bifidobacteriales (4.71%) in the CD, Bacteroidales (31.19%), Enterobacteriales (24.38%), Lactobacillales (14.48%), Bifidobacteriales (11.76%) in CWD, and Enterobacteriales (31.16%), Bacteroidales (24.32%), and Lactobacillales (4.75%) in D groups were the predominating bacterial taxa (Figure 5 and Supporting Information: Data S1).
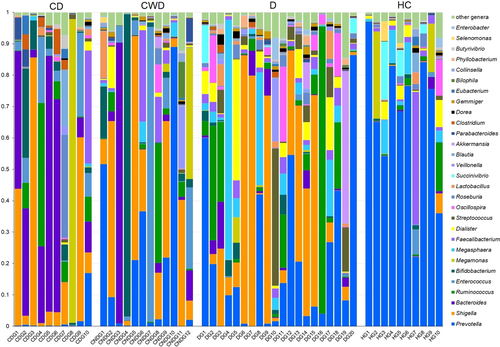
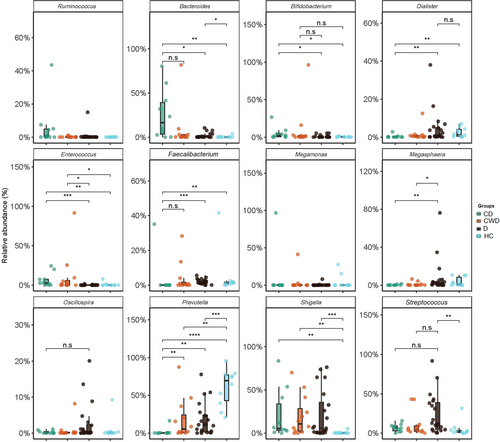
At the genus level, significant differences were found in the abundance and diversity of gut microbiota across four study groups (p = 0.031, Kruskal–Wallis test) (Supporting Information: Data S1). We found severe microbiome dysbiosis in T2DM patients with/without COVID-19, where a single genus reached more than 50% of the population (Figure 6). We detected 232 bacterial genera, of which 8.6%, 10.78%, 36.64%, and 37.5% genera belonged to phyla Acidobacteria, Bacteroidetes, Proteobacteria, and Firmicutes, respectively (Supporting Information: Data S1). Twelve genera had differentially abundant OTUs in the four study groups (p < 0.05, Kruskal–Wallis test) (Figure 7). Shigella from Proteobacteria (25.0%), Bacteroides (23.45%) and Parabacteroides (1.19%) from Bacteroidetes, and Megamonas (15.90%), Roseburia (2.16%), Clostridium (1.55%), and Blautia (1.27%) from Firmicutes had higher mean relative abundances in CD patients gut samples (Figure 6) Similarly, Acidobacteria genera, for example, Enterococcus (13.40%) and Bifidobacterium (12.73%), Firmicutes genera, such as Lactobacillus (1.43%) and Veillonella (1.40%) were predominantly abundant in CWD samples (Figure 6), and showed significant (p < 0.05, Kruskal–Wallis test) positive association with COVID-19 but not T2DM (Figure 7). The T2DM patients without any manifestations of COVID-19 (D), however, had higher mean relative abundances of Firmicutes genera such as Megasphaera (11.88%), Ruminococcus (11.77%), Dialister (5.20%), Streptococcus (4.10%) and Oscillospira (2.54%), and Verrucomicrobiota genus such as Akkermansia (1.34%) in their gut microbiomes (Figure 6 and Supporting Information: Data S1), indicating a substantial (p < 0.05, Kruskal–Wallis test) positive association with T2DM (Figure 7). Conversely, Prevotella, a genus from Bacteroidetes had more than two-fold higher mean relative abundances (70.16%) in HC fecal samples than T2DM patients (D = 26.19%) and COVID-19 patients without diabetes (CWD = 23.54%) and several-fold higher than COVID-19 patients with T2DM (CD = 1.70%) (Figure 6 and Supporting Information: Data S1). Likewise, Firmicutes genus, such as Faecalibacterium (5.02%) and Proteobacteria genera genus, for instance, Succinivibrio (3.12%), were more abundant in healthy humans gut, and their mean relative abundances decreased (dysbiosis) in T2DM and diabetic patients with or without COVID-19 manifestations (Figures 6 and 7).
3.4 Core microbiomes in diabetic, COVID-19, and healthy humans gut
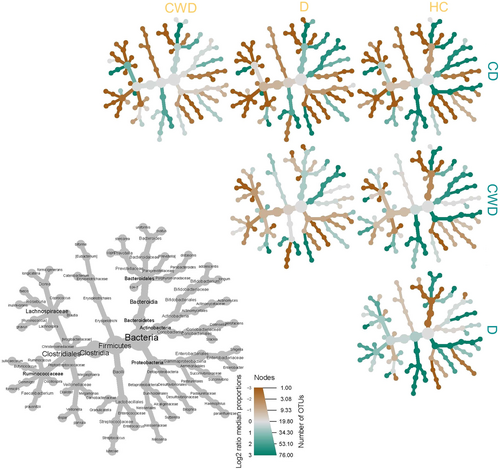
The distribution and exclusivity of genera and other taxonomic ranks among groups can be seen in the heat trees (Figure 8). According to our stringent criterion, a total of 68 genera representing 13 orders and four phyla (e.g., Proteobacteria, Firmicutes, Bacteroidetes, and Actinobacteria) were identified as putative members of the core microbiome. The core microbiota consists of 76 OTUs and represents 50% of the relative bacterial abundance of each sample group. The majority of core microbiome candidates were Firmicutes (44 genera) and Bacteroidetes (13 genera), constituting 64.70% and 19.11% of the core microbiome population, respectively. Prevotella (30.21%), Shigella (21.03%), Bacteroides (8.90%), Enterococcus (5.06%), and Megasphaera (5.01%) were the top abundant core bacterial genera, while Neisseria (0.01%), Coprococcus (0.082%), Butyricicoccus (0.073%), Slackia (0.028%), Actinomyces (0.023%), and Granulicatella (0.019%) were among the least abundant genera in the core microbiome. The heat trees indicated that some genera or ranks may be shared among four conditions, but they might differ at species, subspecies, and strain levels (Figure 8).
3.5 Microbiome dysbiosis is correlated with metabolic functional changes
To predict and compare the genomic functional potentials between diabetes (i.e., CD and D) and non-diabetes (i.e., CWD) states, we further analyzed the amplicon data using the PICRUSt2 which revealed 30 different KEGG pathways (Supporting Information: Figure 2). There were 10 metabolic pathways including ribose transport system substrate-binding (rbsB), bacterial/archaeal transporters (TC.BAT2), fructuronate reductase (uxuB), GTP cyclohydrolase II (ribA, RIB1), methenyltetrahydromethanopterin cyclohydrolase (mch), lysozyme (ach), and aspartate ammonia-lyase (aspA) significantly (p = 0.011, Kruskal–Wallis test at 95% confidence interval) enriched in the microbes of diabetes patient's gut. Conversely, 13 functional metabolic pathways such as copper resistance (pcoB, copB), d-galactarolactone cycloisomerase (gci), alpha-galactosidase (galA, rafA), DNA repair (sbcD/mre11), crotonyl-CoA carboxylase/reductase (ccr), valine-pyruvate aminotransferase (avtA), cytidine2498-2′-O-methyltransferase (rlmM), phosphoribosylformimino-5-aminoimidazole carboxamide (hisA), large subunit ribosomal protein (rpmI), and so forth. were enriched in non-diabetes people's gut microbes (Supporting Information: Figure 2).
4 DISCUSSION
The pathophysiology of SARS-CoV-2 infection is distinguished by the concomitant affiliation of distinct microbial coalitions that are substantially implicated in the origin of multiorgan dysfunction. The presence of one and/or more comorbidities, such as diabetes, hypertension, and cancer, is accompanied by an increased risk of fatality in COVID-19 patients.4, 16 Despite having almost homogeneous genetic backgrounds and living status of the study population, there were profound alterations in gut microbiomes across CD, CWD, D, and HC metagenomes. We found substantial changes in the community structure of the identified microbial signature and elucidated their predicted functional profile. The composition of gut microbiota in COVID-19 patients was found to undergo distinct changes that could affect different clinical features of SARS-CoV-2 pathophysiology. In the study, microbiome diversity in four groups varied significantly in richness and evenness. The commensal microbiota was downregulated in both diabetes and non-diabetes groups infected with COVID-19. These results are similar to some previous studies that reported COVID-19 mediated dysbiosis of the nasopharyngeal tract,15 oral,8 and gut8, 35 microbiota of humans. In a recent study, Al-Emran et al. (2023)36 reported that dysbiosis of the bacterial community might be linked with severe consequences of SARS-CoV-2 infection in diabetic patients, and probiotic strains might have a role to fight against numerous pathogens in the same pathological niches. Previous studies explained that the decline in commensal bacterial diversity has been considered as a key indicator of dysbiosis for inflammatory bowel disease, rheumatic diseases, and multiple sclerosis.37, 38 We also identified significant variations in bacterial taxa among the four-study groups represented by abundances of specific phyla and genera. The findings of the present study revealed that the majority of the genera of Firmicutes and Proteobacteria were identified with higher abundances in the CD patients gut samples, which supports their positive association with COVID-19 and T2DM as also reported previously in many studies.9, 15, 39, 40 Conversely, microbial taxa from the Bacteroidetes had several-fold higher abundances in the HC humans' gut. One of the hallmark findings of this study is the sole association of four bacterial phyla (Planctomycetes, Acidobacteria, Chlamydiota, and Chloroflexi) in the gut microbiome of the CWD humans. These findings indicated that T2DM patients suffering from COVID-19 had a reduced abundance level of Bacteroidetes, a known carbohydrate-digesting microbiome, possibly explaining the lower functional abundance of carbohydrate metabolism and transport in the COVID-19 patients.41 Existing literature suggest that Bacteroidetes, Firmicutes, Proteobacteria, and Actinobacteria largely (roughly 97%) compose the gut bacterial population in T2DM. And, age-related differences in gut bacteria may influence T2DM and obesity in humans.42
We found that some orders of bacteria, for example, Enterobacteriales, Clostridiales, Bifidobacteriales, Lactobacillales, and Micrococcales, had relatively higher abundance levels in CD compared to D and HC subjects. These changes were even more intriguing at the genus-level composition and relative abundances of the gut microbiomes. Our analysis also showed that fecal samples from the diseased cohorts (e.g., CD, CWD, and D) had higher relative abundances of bacterial genera such as Bacteroides, Escherichia, Shigella, Streptococcus, Rothia, Klebsiella, and Veillonella. Differentially abundant levels of Bacteroides, Escherichia, Shigella, Enterococcus, Bifidobacterium, and Actinomyces were consistent with the findings of several previous studies, indicating a microbial profile for these patients.15, 41, 43 Prevotella genus demonstrated significantly lower relative abundance in COVID-19 patients with T2DM, suggesting a repressive effect of ill conditions on the low concentration of the genus compared to healthy individuals.44 Recently, several studies have researched bacterial infection among hospitalized COVID-19 patients and found a positive correlation between the duration of stay in the hospital and the probability of acquiring nosocomial infections and co-infections.45 The bacterial genus Prevotella remained considerably lower in abundance in the gut microbiomes of CD compared to HC, possibly suggesting a decrease in commensal bacteria and counteraction against SARS-CoV-2 infections. Loss of these commensal bacteria (e.g., Prevotella) from gut microbiomes indicates that Prevotella can act as a local probiotic and counteract SARS-CoV-2 to defend it in patients with COVID-19.6 In a recent study, the genera Rothia and Shigella were found at elevated levels in the gut microbiomes of SARS-CoV-2 and H1N1 influenza patients, corroborating with the present study's findings.46 Loss of pathogenic bacterial genera like Porphyromonas and Haemophilus in the gut microbiomes of the COVID-19 diabetes group raises the possibility that other cohabiting bacterial communities may also have adverse effects, such as the loss and deficiency of vital dietary nutrients like minerals and vitamins. Our findings also indicated that both diabetes (i.e., D and CD) and non-diabetes COVID-19 patients (i.e., CWD) suffering from health issues expressed higher microbial signatures for gastrointestinal pathogens (e.g., Bacteroides, Streptococcus, Shigella, Megamonas, Roseburia, and Clostridium) when compared to HC subjects. Earlier findings also suggested that these gut bacteria contribute to inflammation and disease severity in COVID-19 patients, culminating the present findings.46 Similarly, Enterococcus, Bifidobacterium, Lactobacillus, and Veillonella were detected as the signature bacteria in CWD. A lower abundance level of Prevotella was represented as a candidate for CD patients. Both COVID-19 groups with and without T2DM also had a higher abundance of Shigella and Enterococcus, suggesting that respiratory viral pathogenesis was determined by inflammatory gut microbiomes.15 The COVID-19 patients with T2DM had a higher degree of pathogenic and opportunistic bacteria compared to the other two patient groups and HCs, indicating significant microbial dysbiosis in COVID-19 patients with T2DM. One of the intriguing findings of the present study is the identification of several core microbiomes which corroborates with the dysbiotic phenomena of the diseased (i.e., CD, CWD, and D) and HC metagenomes. For example, Shigella, Bacteroides, Enterococcus, and Megasphaera were the core pathogens and/or opportunists to be associated with both T2DM and COVID-19. Our observation of dynamic shifts in gut microbiome between T2DM (i.e., D and CD) and non-T2DM (i.e., CWD) is supported by many of the previous literature reporting that the SARS-CoV-2 diabetic group exhibited a significant increase in pathogens and co-infection-causing bacteria with a simultaneous depletion of commensal flora.36, 42 The search for a core microbiome in host-associated microbial communities is a useful first step in trying to understand the interactions that may be occurring between a host and its microbiome.47 In accordance with the prevailing core microbiome concept, a stable association between T2DM and COVID-19-specific microorganisms suggests these taxa may be functionally necessary for the integrity of the gut microbiome of both diseased and HC humans.
The disruption of metabolic activities in the gut microbiota is a predictive factor of disease severity in COVID-19 patients with or without T2DM. We also found an alteration in relative abundances of some important predicted genomic functions between diabetes and non-diabetes groups of CD, D, and CWD gut microbiomes. The metabolic features identified in the same KEGG pathway varied across samples in diabetes and non-diabetes humans with or without COVID-19, suggesting their possible association in early colonization and disease progression. The altered metabolic profile and energy generation of immune cells affect their activation, exacerbating the imbalanced immune responses in COVID-19 patients with or without diabetes. It was also revealed that genes coding for synthesis and degradation of ketone bodies, CHO metabolism, amino sugar and nucleotide sugar metabolism, glycolysis and gluconeogenesis, ascorbate and aldarate metabolism, and C5-branched dibasic acid metabolism were overexpressed in the gut microbiomes of diabetes (CD and D) patients compared to non-diabetes (CDW) subjects. It can be rationally inferred that dysbiosis of the microbiome induced by COVID-19 infection along with T2DM can substantially decrease vital metabolic pathways in the gut, resulting in an increased number of opportunistic microbial communities.15, 48
The present study, although presented a number of remarkable outcomes, was not devoid of limitations. First, the number of patients included in the study is low compared to other studies on gut microbiome. Second, it was critical to follow-up with the patients before and after COVID-19 because of their unavailability.
5 CONCLUSION
This study highlighted the changes in gut microbiome diversity and composition in COVID-19-positive participants with or without T2DM compared to the HC subjects. The relationship between various microbial taxa in COVID-19 patients with T2DM and HCs suggested that the microbial imbalance was escalating in the gut. These interactions between different microbial taxa pointed to the potential of microbiome-based intervention in preventing and treating COVID-19 patients with severe health complications like T2DM. The magnitude of the richness of non-commensal microbiomes on T2DM patients with COVID-19 can be used as an indicator of disease severity. Taken together, gut microbiome dysbiosis and loss of gene functions in COVID-19 patients with or without T2DM expounded the importance of microbiome as a significant indicator of health conditions and disease severity. However, more in-depth longitudinal studies on how the gut microbiota could help strengthen the body's defenses against SARS-CoV-2 infection in people with or without diabetes are needed.
AUTHOR CONTRIBUTIONS
Adnan Mannan, S. M. Rafiqul Islam, Md. Javed Foysal, H. M. Hamidullah Mehedi, Asma Salauddin, Alfred Tay, AMAM Zonaed Siddiki and Farhana Akter conceived and designed the experiments. Adnan Mannan, Asma Salauddin, Sajjad Hossain Noyon, and Farjana Sharmen performed the experiments. Adnan Mannan, M. Nazmul Hoque, Md. Javed Foysal, Farjana Sharmen, Afroza Akter Tanni, Md. Moradul Siddique, M. Shaminur Rahman, and Syed Md. Galib analyzed the data and drafted the manuscript. S. M. Rafiqul Islam, M. Nazmul Hoque, and Adnan Mannan revised the manuscript. All authors contributed to the article and approved the submitted version.
ACKNOWLEDGMENTS
The authors would like to thank the authority of 250 Bedded General Hospital, Chattogram, Disease Biology and Molecular Epidemiology Research Group (dBme), Genomics Research Group, CVASU for their support during the study. This work was supported by Chittagong University Research and Publication office.
CONFLICT OF INTEREST STATEMENT
The authors declare no conflict of interest.
ETHICS STATEMENT
Ethical approval was granted from Institutional Review board (IRB) of 250 bedded General Hospital, Chattogram. Oral and written consent from the patients were taken.
Open Research
DATA AVAILABILITY STATEMENT
The data that support the findings of this study are available in the supplementary material of this article The data collected during this study will be available from the corresponding author upon reasonable request.


