Risk of waning humoral responses after inactivated or subunit recombinant SARS-CoV-2 vaccination in patients with chronic diseases: Findings from a prospective observational study in China
Hu Li and Dachuan Cai contributed equally to this study.
Abstract
Heterogeneity of antibody responses has been reported in SARS-CoV-2 vaccination recipients with underlying diseases. We investigated the impact of the presence of comorbidities on the humoral response to SARS-CoV-2 vaccination in patients with chronic disease (PWCD) and assessed the effect of the number of comorbidities on the humoral response to vaccination. In this study, neutralizing antibodies (NAbs) and IgG antibodies against the receptor-binding domain (RBD-IgG) were monitored following a full-course vaccination. In total, 1400 PWCD (82.7%, inactivated vaccines; 17.3%, subunit recombinant vaccine) and 245 healthy controls (65.7% inactivated vaccines, 34.3% subunit recombinant vaccine) vaccinated with inactivated or subunit recombinant SARS-CoV-2 vaccines, were included. The seroconversion and antibody levels of the NAbs and RBD-IgG were different in the PWCD group compared with those in the control group. Chronic hepatitis B (odds ratio [OR]: 0.65; 95% confidence interval [CI]: 0.46–0.93), cancer (OR: 0.65; 95% CI: 0.42–0.99), and diabetes (OR: 0.50; 95% CI: 0.28–0.89) were associated with lower seroconversion of NAbs. Chronic kidney disease (OR: 0.29; 95% CI: 0.11–0.76), cancer (OR: 0.38; 95% CI: 0.23–0.62), and diabetes (OR: 0.37; 95% CI: 0.20–0.69) were associated with lower seroconversion of RBD-IgG. Only the presence of autoimmune disease showed significantly lower NAbs and RBD-IgG titers. Patients with most types of chronic diseases showed similar responses to the controls, but humoral responses were still significantly associated with the presence of ≥2 coexisting diseases. Our study suggested that humoral responses following SARS-CoV-2 vaccination are impaired in patients with certain chronic diseases.
Abbreviations
-
- BMI
-
- body mass index
-
- CI
-
- confidence interval
-
- COVID-19
-
- coronavirus disease
-
- CRF
-
- case record form
-
- Ig
-
- immunoglobulin
-
- IQR
-
- interquartile range
-
- NAbs
-
- neutralizing antibodies
-
- OR
-
- odds ratio
-
- RBD
-
- receptor-binding domain
-
- SARS-CoV-2
-
- severe acute respiratory syndrome coronavirus 2
-
- SD
-
- standard deviation
-
- vs.
-
- versus
1 INTRODUCTION
Coronavirus disease (COVID-19), caused by the severe acute respiratory syndrome coronavirus 2 (SARS-CoV-2) infection, has become a significant global public health threat. By the end of June 2022, >528 million people had been diagnosed with COVID-19, and >6 million deaths had been confirmed worldwide.1 Randomized controlled clinical trials and real-world studies have demonstrated that vaccines can effectively reduce SARS-CoV-2 infection and mortality and morbidity due to COVID-19.2-6 Therefore, vaccines are being rolled out as an effective measure against COVID-19.7-10
Heterogeneity of antibody responses in SARS-CoV-2 vaccination recipients with underlying diseases, such as cancer,11, 12 chronic liver disease,13-19 autoimmune disease,20-23 HIV infection,24, 25 and diabetes mellitus,26, 27 can be observed in real-world studies. A systematic review of 32 COVID-19 messenger (m)-RNA vaccine studies suggested that the immune response was impaired in people with underlying diseases.28 These studies have greatly promoted the formulation of preventive strategies in special populations, such as prioritizing vaccination and boosting vaccines. However, their findings are inconsistent and mostly concerning mRNA-based vaccines. In China, inactivated vaccines (BBIBP-CorV or CoronaVac) and the receptor-binding domain (RBD)-based protein subunit vaccine (ZF2001) are the two main officially recommended vaccines.9, 10 Currently, few studies have described the antibody profile of patients with underlying diseases following inactivated or subunit recombinant vaccines.14, 18, 23 Several important questions remain: (1) whether the antibody response of patients with underlying diseases is different from that of healthy individuals after vaccination, (2) whether results in patients with one specific disease can be translated to those with other diseases, and (3) how the number of comorbidities affects the antibody response after immunization, such as in individuals with multiple coexisting diseases.
We hypothesized that patients with certain chronic diseases and those with multiple comorbidities will have waning humoral responses to SARS-CoV-2 vaccines. Here, we investigated the impact of the presence of diseases on the humoral response to SARS-CoV-2 inactivated or subunit recombinant vaccines in patients with chronic disease (PWCD). We also assessed the effect of the number of comorbidities on the humoral immune response to vaccination.
2 METHODS
2.1 Study design and participants
Between June 1, 2021, and September 30, 2021, we performed a prospective observational study at the Second Affiliated Hospital of Chongqing Medical University, a large tertiary medical center in southwestern China. Participants included PWCD treated in outpatient clinics and healthy volunteers (healthy controls) who underwent annual physical examinations at the health management center. Inclusion criteria were age 18 years or older, no SARS-CoV-2 infection before receipt of the first vaccine dose (determined based on either a negative anti-SARS-CoV-2 immunoglobulin (Ig)-M/IgG test or the absence of a positive polymerase chain reaction assay result for SARS-CoV-2, with no history of suspected clinical SARS-CoV-2 infection), and ability to understand and complete questionnaires in Chongqing. Participants with known pregnancy during study entry, those who did not complete the full course of vaccination, and those who provided incomplete vaccination information (including the date of their first vaccine dose and complete vaccination, and vaccine manufacturer [due to different vaccine types by manufacturers]) were excluded. All participants in this study were required to provide peripheral blood samples for serological assays for SARS-CoV-2 within 21–120 days after full-course vaccination.
2.2 Variables and definitions
Clinical data, including age, sex, body mass index (BMI) (the weight in kilograms divided by the square height in meters), comorbidities, and SARS-CoV-2 vaccination information (including the date of the first vaccine dose and complete vaccination, and vaccine manufacturer), were collected by the investigators using a standardized questionnaire and case record form (CRF). Investigators completed CRFs using data from the electronic patient files. Patient files were used to register the disease diagnosis and laboratory test results.
Serum samples from vaccinated participants were collected by venipuncture and tested for SARS-CoV-2 antibodies, including IgG antibodies against the RBD of the SARS-CoV-2 spike protein (RBD-IgG) and neutralizing antibodies (NAbs) using capture chemiluminescence immunoassays by MAGLUMI X8 (Snibe) according to the manufacturer's instructions. According to the kit labels, RBD-IgG tests have 100% sensitivity and 99.6% specificity for the diagnosis of COVID-19, while NAbs tests have 100% sensitivity and 100% specificity. The cut-off values were 1.0 AU/ml for RBD-IgG and 0.15 µg/ml for NAbs.
Full-course SARS-CoV-2 vaccination was defined as having had two vaccinations of inactivated vaccines (BBIBP-CorV or CoronaVac) or three vaccinations for the RBD-based protein subunit vaccine (ZF2001), regardless of the time interval.29-33
2.3 Statistical analysis
Data were presented as mean (standard deviation [SD]) or median (interquartile range [IQR]) for continuous variables and as proportions for categorical variables. Descriptive analyses were performed in the PWCD and healthy control groups and included quantification of seroconversion and the antibody titer, as well as a description of their distribution in various disease subgroups. Differences in continuous variables were compared using the Student t-test or Mann–Whitney U-test. Differences in categorical variables (age dichotomized, sex, and vaccine types) were compared using the χ2 test. Correlations between NAbs and RBD-IgG levels for each period were assessed using the Spearman rank correlation.
For the primary objective, associations of disease status (binary exposure variable, with or without diseases) with seroconversion (binary outcome variable, positive or negative) were assessed using univariate and multivariate logistic regression models. Associations of disease status with antibody titers (continuous outcome variable) were assessed using linear regression analysis in univariate and multivariate models. In the secondary objective, we also assessed associations between the number of coexisting diseases with seroconversion and the antibody level. Four models were used, with model 1 being unadjusted; model 2 was adjusted for age and sex (binary variable); model 3 was adjusted for model 2 variables plus the BMI, vaccine types, and days between the final dose and antibody test (continuous variables); and model 4 adjusted for model 3 variables plus the white blood cell count, lymphocyte count, hemoglobin level, alanine aminotransferase level, and total bilirubin level (continuous variables). Data are presented as point estimates and corresponding 95% confidence intervals (CIs) of the effect size estimates. Unadjusted and adjusted models were constructed to evaluate the association of diseases and the risk of seroconversion and antibody levels in the primary and secondary objectives. Missing data regarding RBD-IgG or NAbs levels were excluded from the analysis.
Additionally, we performed stratified analyses in prespecified subgroups defined by age, sex, BMI, vaccine type, and time between the final dose and antibody test. Interactions by subgroup characteristics were tested using likelihood ratio tests comparing models with and without multiplicative interaction terms.
All analyses were performed using R (http://www.R-project.org, the R Foundation) and EmpowerStats (http://www.empowerstats.com, X&Y Solutions, Inc.). A p < 0.05 (two-sided) was considered to indicate statistical significance.
3 RESULTS
3.1 Participant characteristics
In total, 1645 participants were included in the study, including 245 (14.9%) healthy volunteers (healthy control group) and 1400 (85.1%) PWCD (PWCD group). Table 1 presents the demographic characteristics, laboratory test results, comorbidities, and vaccination information of these participants. The mean ages of participants were 46.1 years (SD: 14.8) in the healthy control group and 50.3 years (SD: 13.8) in the PWCD group. The proportions of men were 41.6% (102/245) and 54.1% (757/1400) in the healthy control and PWCD groups, respectively. The PWCD group had patients with 8 common chronic disease types, including 552 (39.4%) with chronic hepatitis B, 289 (20.1%) with cancer (including liver, lung, breast, colon, rectal, cervical, ovarian, endometrial, and gastric cancers), 143 (10.2%) with cardiovascular disease (hypertension and coronary heart disease), 108 (7.7%) with autoimmune disease (autoimmune liver disease, Hashimoto thyroiditis, Sjogren syndrome, and polymyositis), 105 (7.5%) with diabetes mellitus, and 77 (5.5%) with chronic kidney disease.
| Variable | Healthy controls (n = 245) | PWCD (n = 1400) | p Value |
|---|---|---|---|
| Age, mean (SD) | 46.1 (14.8) | 50.3 (13.8) | <0.001 |
| Male, n (%) | 102 (41.6) | 757 (54.1) | <0.001 |
| BMI (kg/m2), mean (SD) | 23.55 (3.44) | 23.63 (3.40) | 0.74 |
| Laboratory test result | |||
| Red blood cell count (106/μl), mean (SD) | 4.6 (0.5) | 4.6 (0.7) | 0.82 |
| Hemoglobin level (g/L), mean (SD) | 137.3 (15.1) | 140.0 (19.2) | 0.06 |
| White blood cell count (103/μl), mean (SD) | 6.0 (1.7) | 6.0 (2.0) | 0.90 |
| Lymphocyte count (103/μl), mean (SD) | 1.8 (0.6) | 1.7 (0.6) | <0.01 |
| Platelet count (103/μl), mean (SD) | 221.9 (58.7) | 188.7 (71.0) | <0.01 |
| Total protein level (g/L), mean (SD) | 73.4 (5.7) | 74.8 (7.0) | 0.04 |
| Albumin level (g/L), mean (SD) | 46.7 (2.8) | 44.6 (5.8) | <0.001 |
| ALT level (U/L), median (IQR) | 17.0 (12.0–24.0) | 23.0 (16.0–36.0) | <0.01 |
| AST level (U/L), median (IQR) | 20.0 (17.0–24.0) | 24.0 (19.0–31.0) | <0.01 |
| GGT level (U/L), median (IQR) | 20.5 (14.0–34.0) | 25.0 (16.0–42.0) | 0.01 |
| ALP level (U/L), median (IQR) | 67.5 (52.0–86.3) | 76.0 (61.0–98.0) | 0.12 |
| Total bilirubin level (μmol/L), median (IQR) | 10.0 (8.1–13.7) | 11.6 (8.3–16.0) | <0.01 |
| Direct bilirubin level (μmol/L), median (IQR) | 3.4 (2.6–4.0) | 3.7 (2.7–5.0) | 0.06 |
| Comorbidity, n (%) | <0.001 | ||
| Cancer | 0 (0) | 289 (20.1) | |
| Cardiovascular disease | 0 (0) | 143 (10.2) | |
| Diabetes mellitus | 0 (0) | 105 (7.5) | |
| Fatty liver | 0 (0) | 107 (7.6) | |
| Chronic hepatitis B | 0 (0) | 552 (39.4) | |
| Autoimmune disease | 0 (0) | 108 (7.7) | |
| Chronic lung disease | 0 (0) | 67 (4.8) | |
| Chronic kidney disease | 0 (0) | 77 (5.5) | |
| Vaccine type, n (%) | <0.001 | ||
| BBIBP-CorV (inactivated vaccine) | 64 (26.1) | 361 (25.8) | |
| CoronaVac (inactivated vaccine) | 87 (35.5) | 730 (52.1) | |
| BBIBP-CorV and CoronaVac | 10 (4.1) | 67 (4.8) | |
| ZF2001 (RBD-subunit vaccine) | 84 (34.3) | 242 (17.3) | |
| Days between the final dose and antibody test, median (IQR) | 48.0 (31.0–76.0) | 44.0 (31.0–71.0) | 0.10 |
- Note: Data are presented as mean (SD), median (IQR), or n (%).
- Abbreviations: ALP, alkaline phosphatase; ALT, alanine aminotransferase; AST, aspartate aminotransferase; BMI, body mass index; GGT, gamma-glutamyltransferase; IQR, interquartile range; RBD, receptor-binding domain; SD, standard deviation.
3.2 Humoral response after SARS-CoV-2 vaccination
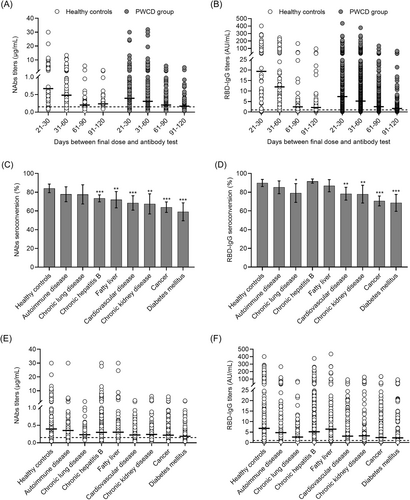
The seropositivity rates of NAbs and RBD-IgG were 72.1% (1010/1400) and 84.8% (1182/1400) in the PWCD group, and the median titers of NAbs and RBD-IgG, 0.26 μg/ml (IQR: 0.14–0.50) and 4.22 AU/ml (IQR: 1.58–11.81), respectively, were significantly lower in the PWCD group than in the healthy controls group (Supporting Information: Table 1). As expected, both seropositivity rate and antibody levels tended to decrease within 120 days after completed vaccination. The decrease in NAbs and RBD-IgG titers was rapid within 60 days but slowed thereafter (Supporting Information: Table 1; Figure 1A,B). The seropositivity rate and antibody levels of NAbs and RBD-IgG also varied considerably between the eight predefined disease groups (Figure 1C–F).
3.3 Impaired humoral responses in the PWCD group
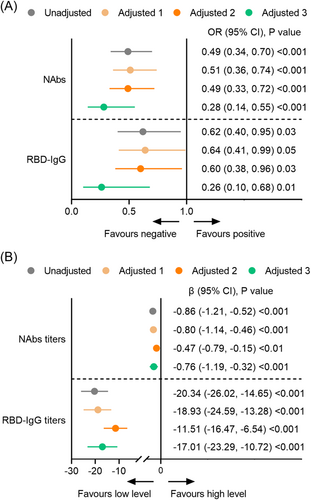
In the primary analysis, the PWCD group had significantly lower seroconversion and antibody levels of NAbs and RBD-IgG than the healthy control group in the unadjusted model (model 1) and partially adjusted models (models 2 and 3) (Figure 2B). In the fully adjusted model (model 4), the odds ratios (OR) for NAbs and RBD-IgG seroconversion were 0.28 (95% CI: 0.14, 0.55, p < 0.001) and 0.26 (95% CI: 0.10, 0.68, p = 0.001), respectively, in the PWCD group (Figure 2A). The titers of NAbs (β: −0.76; 95% CI: −1.19, −0.32; p < 0.001) and RBD-IgG (β: −17.01; 95% CI: −23.29, −10.72; p < 0.001) were still significantly lower in the PWCD group than in the healthy control group (Figure 2B). Additionally, chronic hepatitis B (OR: 0.65; 95% CI: 0.46, 0.93, p = 0.02), cancer (OR: 0.65; 95% CI: 0.42, 0.99, p = 0.04), and diabetes mellitus (OR: 0.50; 95% CI: 0.28, 0.89, p = 0.02) were associated with lower seroconversion of NAbs than the other predefined diseases (Supporting Information: Figure 1A). Chronic kidney disease (OR: 0.29; 95% CI: 0.11, 0.76, p = 0.01), cancer (OR: 0.38; 95% CI: 0.23, 0.62, p < 0.001), and diabetes mellitus (OR: 0.37; 95% CI: 0.20, 0.69, p < 0.01) were associated with lower seroconversion of RBD-IgG than the other predefined diseases (Supporting Information: Figure 1B). Regarding the antibody level, only the presence of autoimmune disease showed significantly lower NAbs (β: −0.60; 95% CI: 1.18, −0.03; p = 0.04) and RBD-IgG titers (β: −11.13; 95% CI: −19.47, −2.78; p = 0.01) (Supporting Information: Figure 1C,D).
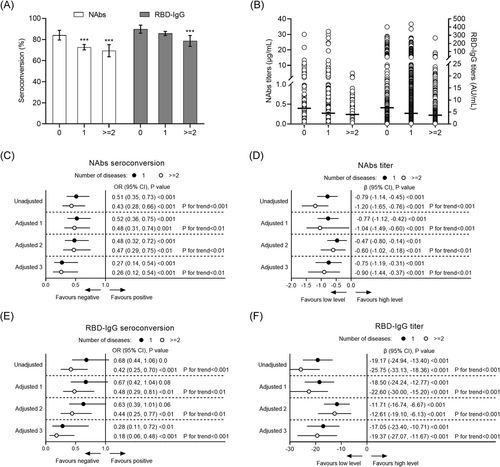
In the secondary analysis, the seropositivity rates of NAbs and RBD-IgG in healthy controls, participants with 1 disease, and participants with ≥2 coexisting diseases were 84.1% (206/245) and 72.7% (838/1152), 69.4% (172/248) (p < 0.001) and 89.8% (220/245), and 85.7% (987/1152) and 78.6% (195/248) (p = 0.002), respectively. In the fully adjusted model (model 4), significantly lower seroconversion of NAbs (OR: 0.26; 95% CI: 0.12, 0.54, p < 0.001) and RBD-IgG (OR: 0.18; 95% CI: 0.06, 0.48, p < 0.001) were associated with the presence of ≥2 coexisting diseases (Figure 3A–F). Concerning the antibody level, participants with ≥2 coexisting diseases also had a significantly lower NAbs (β: −0.90; 95% CI: −1.44, −0.37; p < 0.001) and RBD-IgG titer (β: −19.37; 95% CI: −27.07, −11.67; p < 0.001) compared with the healthy controls (Figure 3). The negative effects of the coexisting diseases on the humoral response increased with the number of comorbidities (p for trend <0.01) (Figure 3).
3.4 Subgroup analysis
In the subgroup analysis (Table 2), although the estimated effect sizes did not meet statistical significance in some stratifications, a negative association between the presence of disease and seroconversion was consistently observed across the subgroups. The interaction test showed that there was no significant difference between each stratification in the association between disease and humoral responses, indicating that there was no significant dependence of age, sex, BMI, vaccine type, and interval time after vaccination on this negative association (all, p for interaction >0.05).
| Subgroup | NAbs | RBD-IgG | ||||
|---|---|---|---|---|---|---|
| Seroconversion, % | OR (95% CI) | p Value for interaction | Seroconversion, % | OR (95% CI) | p Value for interaction | |
| Age | 0.87 | 0.15 | ||||
| ≤55 years | 76.3 (822/1078) | 0.25 (0.10, 0.63) | 88.2 (951/1078) | 0.45 (0.15, 1.40) | ||
| >55 years | 69.5 (394/567) | 0.29 (0.11, 0.82) | 79.5 (451/567) | 0.09 (0.01, 0.68) | ||
| Sex | 0.91 | 0.58 | ||||
| Female | 78.0 (613/786) | 0.33 (0.12, 0.93) | 86.5 (680/786) | 0.43 (0.12, 1.56) | ||
| Male | 70.2 (603/859) | 0.29 (0.12, 0.75) | 84.1 (722/859) | 0.21 (0.05, 0.91) | ||
| BMI | 0.57 | 0.39 | ||||
| <24 kg/m2 | 76.0 (703/925) | 0.26 (0.10, 0.65) | 86.7 (802/925) | 0.19 (0.04, 0.84) | ||
| ≥24 kg/m2 | 71.7 (489/682) | 0.39 (0.14, 1.10) | 84.3 (575/682) | 0.47 (0.13, 1.71) | ||
| Vaccine type | 0.31 | 0.23 | ||||
| Inactivated | 69.5 (916/1319) | 0.29 (0.14, 0.60) | 82.9 (1094/1319) | 0.36 (0.14, 0.94) | ||
| RBD-subunit | 92.0 (300/326) | 0.97 (0.16, 5.75) | 94.5 (308/326) | 0.00 (0.00, Inf.) | ||
| Days between the final dose and antibody test | 0.11 | 0.94 | ||||
| 21–60 days | 79.9 (863/1080) | 0.51 (0.22, 1.20) | 90.2 (974/1080) | 0.28 (0.06, 1.24) | ||
| 61–120 days | 62.5 (353/565) | 0.16 (0.05, 0.49) | 75.6 (428/565) | 0.26 (0.07, 0.92) | ||
- Note: Data are presented as OR and 95% CI or β and 95% CI.
- Abbreviations: BMI, body mass index; CI, confidence interval; Ig, immunoglobulin; Nabs, neutralizing antibodies; OR, odds ratio; RBD, receptor-binding domain; SARS-CoV-2, severe acute respiratory syndrome coronavirus 2.
3.5 Correlation between NAbs and RBD-IgG levels
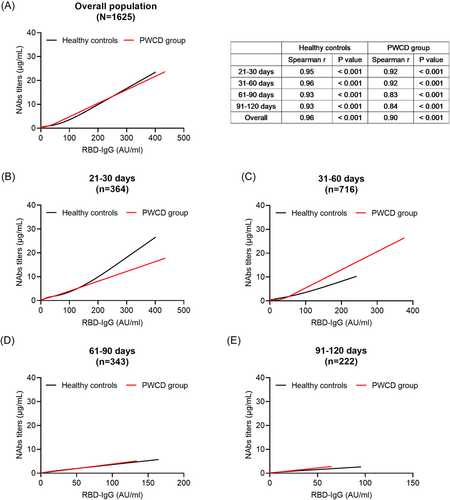
Correlation analysis revealed a strong correlation between NAbs and RBD-IgG titers in the healthy control and PWCD groups (Spearman correlation coefficients: 0.96 and 0.90, respectively; both, p < 0.001) (Figure 4A). In the PWCD group, the correlation coefficient of NAbs and RBD-IgG titers decreased from 0.92 at 21–30 days to 0.84 at 91–120 days, whereas it was stable in the healthy controls (correlation coefficients: 0.93–0.96). The regression relationship between NAbs and RBD-IgG titers exhibited time dependence (Figure 4B–E), suggesting that NAbs and RBD-IgG levels may have different kinetics in healthy controls and PWCD. These results partially explain differences in the effects of the presence of comorbidities on NAbs and RBD-IgG responses.
4 DISCUSSION
In this large, prospective observational study of the most common various chronic diseases, we showed that the presence of comorbidities is significantly associated with waning humoral responses following SARS-CoV-2 vaccination. Moreover, the negative effects of the coexisting diseases on the humoral response increased with the number of comorbidities. To our knowledge, this is the largest study to characterize the negative impact of comorbidities on humoral responses in recipients of SARS-CoV-2 inactivated and RBD-based protein subunit recombinant vaccines.
Our results corroborate and expand findings from studies on humoral responses in patients with comorbidities and some populations with specific chronic diseases. We presented data showing that patients with chronic hepatitis B, cancer, and diabetes mellitus have impaired NAbs responses, and those with chronic kidney disease, cancer, and diabetes mellitus show impaired RBD-IgG reactions after vaccination. Patients with autoimmune diseases showed significantly lower NAbs and RBD-IgG levels after vaccination. This is greatly attributed to the disease mechanisms resulting in functional and compositional changes to the immune system, such as the tumor immune microenvironment and impaired lymphocyte and macrophage function in diabetes mellitus, which negatively affect the immune response after COVID-19 vaccination.34 In addition, different types of treatment and timing of vaccination can cause different levels of immunosuppression. Low serological responses have been observed in patients with cancer receiving chemotherapy and in autoimmune disease patients taking immunosuppressants.20-22, 35 Patients with cancer who were vaccinated during the later chemotherapy cycle also had poor responses than those vaccinated in the early cycle of treatment.36 Similar to the findings in other reports, here, we found different kinetics of NAbs and RBD-IgG.37-39 This may partly explain the differences in antibody responses to NAbs and RBD-IgG in the same type of chronic disease group.
The seroconversion rates and antibody levels of most patients in the PWCD group were similar to those of healthy controls. However, negative associations between comorbidities and the humoral response were still observed when the number of comorbidities increased. These results suggest that PWCD were a vulnerable population to vaccine-induced antibody responses, especially in participants with ≥2 coexisting diseases.
NAbs have been shown to correlate with protection.40 Previous studies have shown small reductions in NAbs levels of 5%–10% per year in measles, mumps, and rubella vaccines.41, 42 However, in this study, a significant and rapid decrease in the humoral response was observed within 60 days after SARS-CoV-2 vaccination in the overall population. In a study of 4868 healthcare workers who received two doses of the COVID-19 BNT162b2 vaccine within 6 months, Levin and colleagues also found a quick decrease in NAb titers initially, during the period of up to 70–80 days, but it slowed thereafter.37 Moreover, there was a similar decrease in the serum RBD-IgG level. Therefore, COVID-19 vaccines may require periodic supplemental doses to “boost” the antibody titers and the development of vaccines should be based on novel approaches.43
Previous studies showed that there were less humoral responses to the COVID-19 Pfizer-BioNTech mRNA vaccine in older individuals and male individuals.28, 44 SARS-CoV-2 NAbs were positively correlated with BMI.45 NAbs titers were significantly higher in obese than in nonobese participants.46 In the subgroup analysis, the negative relationship between comorbidities and the humoral response was stable across each prespecified stratification for both NAbs and RBD-IgG, suggesting our conclusions are robust.
Studies have shown that an early CD4 + T-cell response following SARS-CoV-2 mRNA vaccine administration promotes the development of the B-cell response and substantial expansion of effector CD8 + T cells, which, together, are capable of contributing to future recall responses.47 Specific CD4 + T-cell responses rapidly waned after a single inactivated SARS-CoV-2 vaccine dose, but became boosted and more sustained following a second dose.48 The lymphocyte count in the PWCD group was significantly lower than that in the healthy controls group. It is not known how lymphocyte subsets and functions changed in the PWCD group. Further studies are needed to investigate their relationship to humoral responses induced by SARS-CoV-2 vaccines.
Our study has some limitations. First, patients' medication information was missing, such as use of chemotherapy, immunosuppressants, monoclonal antibodies, and so forth. In addition, statins and metformin have been reported to impair the antibody response and efficacy of vaccines,49, 50 and information on these administrations was also lacking. The effect of the coexistence of these drugs and diseases on antibody responses is unknown and needs to be investigated in the future. Second, without a head-to-head comparison with mRNA vaccines, our findings may not be extrapolated to mRNA vaccines. Finally, we did not test for T cell-mediated responses or other additional immune tests, which are being performed in the next steps of a future study.
In conclusion, our data provide evidence that humoral responses following SARS-CoV-2 vaccination are impaired in patients with certain chronic diseases. Most patients with common chronic diseases show equal antibody responses compared with controls; however, humoral responses are still significantly compromised in the presence of multiple chronic diseases. These results could inform physicians and policymakers regarding decisions on screening populations at higher risk of poor vaccination responsiveness and providing additional vaccinations in people with chronic diseases.
AUTHOR CONTRIBUTIONS
Peng Hu and Hong Ren contributed to the concept, design, supervision, administration, technology, and material support of the study; all authors contributed to the data acquisition and interpretation; Hu Li and Dachuan Cai contributed to the drafting of the manuscript; Mingli Peng, Min Chen, Ning Ling, Yinghua Lan, and Dazhi Zhang contributed to the critical revision of the manuscript for important intellectual content; and Hu Li contributed to the statistical analysis. All authors approved the final version, and agree to be accountable for all aspects of the work.
ACKNOWLEDGMENTS
This work is supported by the National Science and Technology Major Project of China (2017ZX10202203-007, 2017ZX10202203-008, 2018ZX10302206-003) and a pilot project of clinical cooperation between traditional Chinese and western medicine for significant and complicated diseases of the National Administration of Traditional Chinese Medicine: Hepatic Fibrosis. We also acknowledge the support of the Kuanren Talents Program of the Second Affiliated Hospital of Chongqing Medical University, National Natural Science Foundation of China (81772198, 81902068), and Natural Science Foundation of Chongqing, China (cstc2020jcyj-msxmX0389).
CONFLICT OF INTEREST
The authors declare no conflict of interest.
ETHICS STATEMENT
This study was approved by the Ethics Committee of the Second Affiliated Hospital of Chongqing Medical University and conducted in accordance with the ethical guidelines of the Declaration of Helsinki. Written informed consent was obtained from all study participants.
Open Research
DATA AVAILABILITY STATEMENT
Data are available from the corresponding author upon reasonable request.


