Clinical severity of Omicron subvariants BA.1, BA.2, and BA.5 in a population-based cohort study in British Columbia, Canada
Abstract
The SARS-CoV-2 variant Omicron emerged in late 2021. In British Columbia (BC), Canada, and globally, three genetically distinct subvariants of Omicron, BA.1, BA.2, and BA.5, emerged and became dominant successively within an 8-month period. SARS-CoV-2 subvariants continue to circulate in the population, acquiring new mutations that have the potential to alter infectivity, immunity, and disease severity. Here, we report a propensity-matched severity analysis from residents of BC over the course of the Omicron wave, including 39,237 individuals infected with BA.1, BA.2, or BA.5 based on paired high-quality sequence data and linked to comprehensive clinical outcomes data between December 23, 2021 and August 31, 2022. Relative to BA.1, BA.2 cases were associated with a 15% and 28% lower risk of hospitalization and intensive care unit (ICU) admission (aHRhospital = 1.17; 95% confidence interval [CI] = 1.096–1.252; aHRICU = 1.368; 95% CI = 1.152–1.624), whereas BA.5 infections were associated with an 18% higher risk of hospitalization (aHRhospital = 1.18; 95% CI = 1.133–1.224) after accounting for age, sex, comorbidities, vaccination status, geography, and social determinants of health. Phylogenetic analysis revealed no specific subclades associated with more severe clinical outcomes for any Omicron subvariant. In summary, BA.1, BA.2, and BA.5 subvariants were associated with differences in clinical severity, emphasizing how variant-specific monitoring programs remain critical components of patient and population-level public health responses as the pandemic continues.
1 INTRODUCTION
Since initial detection in South Africa on November 19, 2021,1 the severe acute respiratory syndrome coronavirus 2 (SARS-CoV-2) Omicron variant of concern (VOC) spread globally, faster than any other variant of the virus described to date. Shortly after characterization of the dominant subvariant BA.1, a second subvariant of Omicron, BA.2 was detected, and rapidly expanded in some geographic regions to become the most dominant Omicron subvariant in as little as 5 weeks.2 At the time of initial detection, BA.2 displayed 39 distinct substitutions or deletions compared to BA.1, many of which localized to key regions of spike, prompting concerns over their impact on vaccine effectiveness, transmissibility, and clinical severity. As BA.2 infections increased, two new genetically distinct subvariants emerged, BA.4 and BA.5, which were reported to have a growth advantage over BA.23 and escape both vaccine-mediated and BA.1-elicited immunity.4 By mid-April, BA.5 had surpassed BA.2 as the dominant subvariant in some geographic regions.5
In British Columbia (BC), Canada, BA.2 was first detected on December 23, 2021. Expansion of this subvariant was slower than reported in other regions compared to BA.1, only surpassing 50% of the daily sequenced SARS-CoV-2 infections 12 weeks later (by mid-March). The first detections of BA.4 and BA.5 occurred on April 22 and May 10, 2022 respectively, and BA.5 became the predominant sublineage in early July. At the time of this study, BA.4 was not a dominant sublineage in BC, and to date only 1084 cases have been detected; the low case numbers resulted in low numbers of hospitalized cases, therefore we decided to exclude BA.4 from our severity analyses due to insufficient statistical power. We performed genomic and epidemiological analyses on 39,237 out of 164,918 laboratory-confirmed cases of SARS-CoV-2 infection between December 23, 2021 and August 31, 2022 to determine whether key indicators of clinical severity—hospitalization and intensive care unit (ICU) admission—differed between BA.1, BA.2, and BA.5 infections.
2 MATERIALS AND METHODS
2.1 Study population
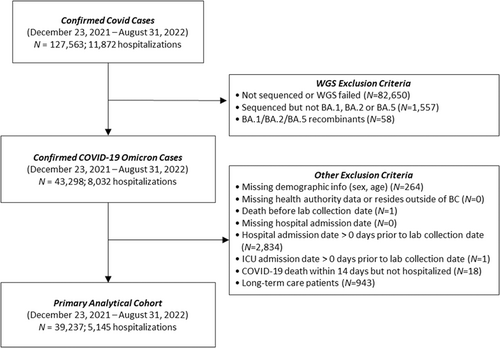
We included all individuals with a primary laboratory-confirmed infection between December 23, 2021, and August 31, 2022 whose SARS-CoV-2 lineage was confirmed by whole genome sequencing (WGS) as belonging to BA.1, BA.2, or BA.5 (including associated sublineages). Our study period start date was selected based on when BA.2 was first identified, and was hence co-circulating with BA.1; the end of the study period was selected to ensure the peak of the BA.5 wave was accounted for—capturing its predominance both at the province level and within each health region of the province. For generalizability purposes, we excluded individuals who were non-BC residents, were admitted to hospital before their positive sample collection date, died within 14 days of their infection without hospitalization, as well as long-term care facilities' residents given their differential baseline frailty compared with the general population. The study population and exclusion criteria are outlined in Figure 1.

2.2 Statistical analysis
Two severity outcomes were examined using survival analysis, namely hospital admission, and ICU admission. Due to the observational nature of the current investigation and to minimize biases due to confounding factors, notwithstanding the careful study population selection, the inverse probability of treatment weighting (IPTW), which uses propensity score to balance baseline patient characteristics, was applied to adjust for confounding factors between the three main Omicron sublineage (“treatment”) groups. Cox proportional hazard regression were applied on the weighted cohort for hospitalization and ICU outcomes. Models were adjusted for age, sex, the provincial health authorities, vaccination status, comorbidities (see supplements for details on selected conditions from the provincial chronic disease registry), and area level measures of social determinants of health (SDOH) incorporated using the Canadian Index of Multiple Deprivation adapted to the province of BC (BCCIMD) spanning four dimensions including ethno-cultural composition, economic dependency, residential instability, situational vulnerability.6
For detailed information on data sources and laboratory methodology, refer to additional methods in the Supplementary Information.
3 RESULTS
During the study period, 39,237 individuals met the criteria for inclusion in the survival analysis (Figure 1). To ensure the sample sizes of each subvariant (BA.1 [N = 19,096], BA.2 [N = 15,764], BA.5 [N = 4377]) in the study population provided sufficient power, we performed a power calculation after computing Cohen's measure of effect size based on the observed outcome probabilities and determined that the population size was adequately powered (0.85 [p ≤ 0.01]) to support the conclusions generated for a sample effect size (w < 0.1).
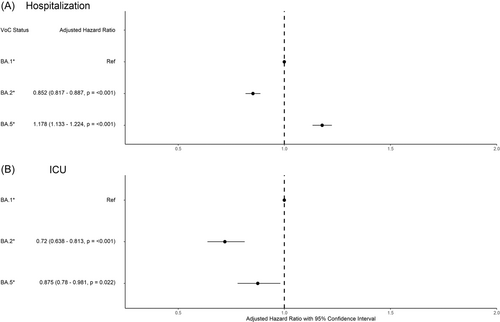
Of the individuals included in our study population, 5145 (13.1%) were admitted to hospital (Table 1). Patient demographics and additional characteristics including vaccination status, associated comorbidities, and SDOH were incorporated into a survival analysis of hospital and ICU admission using inverse probability of treatment weighted (IPTW) methods based on the generalized propensity score (Figure 2, Supporting Information: Tables S1 and S2). We observed a 15% decrease in the adjusted hazard ratio (aHR) for hospitalization associated with BA.2 infection (aHR = 0.852 [0.817–0.887, p ≤ 0.001]) compared to BA.1 (Figure 1). In contrast, BA.5 was associated with an 18% increased rate of hospitalization (1.178 [1.133–1.224, p ≤ 0.001]), compared to BA.1. Our IPTW analysis revealed additional factors that contributed toward the likelihood of being hospitalized for severe COVID-19 illness including age, sex, vaccination status, SDOH and pre-existing conditions (Supporting Information: Table S1). We observed that rate of hospitalization increased incrementally with age and that males were 38.7% more likely to be hospitalized than females. Vaccination was associated with protection against more severe outcomes, reflected by a 43.8% and 61.1% reduced risk of hospitalization with two and 3+ doses, compared to unvaccinated individuals. Regional differences in hospitalization rates were observed within the province of BC, and more severe outcomes were associated with individuals classified as more deprived in regard to ethno-cultural composition. Furthermore, individuals were more likely to be hospitalized with pre-existing conditions including chronic kidney disease (CKD), chronic obstructive pulmonary disease (COPD), diabetes, heart failure, multiple sclerosis (MS), schizophrenia, and substance use disorder (SUD).
| BA.1 | BA.2 | BA.5 | |
|---|---|---|---|
| (N = 19,096) | (N = 15,764) | (N = 4377) | |
| Sex | |||
| Female | 10,790 (56.5%) | 9308 (59%) | 2454 (56.1%) |
| Male | 8306 (43.5%) | 6456 (41%) | 1923 (43.9%) |
| Age (years) | |||
| Mean (SD) | 40.9 (23.6) | 54 (26.5) | 57.5 (27.2) |
| Median (IQR) | 38 (32) | 55 (45) | 63 (46) |
| Age groups | |||
| 0–4 | 1486 (7.8%) | 850 (5.4%) | 281 (6.4%) |
| 5–11 | 889 (4.7%) | 243 (1.5%) | 54 (1.2%) |
| 12–19 | 921 (4.8%) | 300 (1.9%) | 73 (1.7%) |
| 20–39 | 6642 (34.8%) | 3904 (24.8%) | 887 (20.3%) |
| 40–59 | 4892 (25.6%) | 3386 (21.5%) | 738 (16.9%) |
| 60–79 | 2824 (14.8%) | 3542 (22.5%) | 1174 (26.8%) |
| 80+ | 1442 (7.6%) | 3539 (22.4%) | 1170 (26.7%) |
| Health authority | |||
| 1 | 8075 (42.3%) | 5484 (34.8%) | 1508 (34.5%) |
| 2 | 4627 (24.2%) | 4307 (27.3%) | 837 (19.1%) |
| 3 | 1448 (7.6%) | 1475 (9.4%) | 259 (5.9%) |
| 4 | 2480 (13%) | 2413 (15.3%) | 1005 (23%) |
| 5 | 2466 (12.9%) | 2085 (13.2%) | 768 (17.5%) |
| Vaccination statusa | |||
| Not vaccinated | 4062 (21.3%) | 2194 (13.9%) | 711 (16.2%) |
| Vaccinated 1 dose | 644 (3.4%) | 306 (1.9%) | 67 (1.5%) |
| Vaccinated 2 doses | 9786 (51.2%) | 3211 (20.4%) | 690 (15.8%) |
| Vaccinated 3+ doses | 4603 (24.1%) | 10,050 (63.8%) | 2907 (66.4%) |
| Ethno-cultural composition quintileb | |||
| 1 | 3401 (17.8%) | 2700 (17.1%) | 590 (13.5%) |
| 2 | 3585 (18.8%) | 3147 (20%) | 793 (18.1%) |
| 3 | 3633 (19%) | 3347 (21.2%) | 856 (19.6%) |
| 4 | 3465 (18.1%) | 2887 (18.3%) | 868 (19.8%) |
| 5 (Most deprived) | 3970 (20.8%) | 2867 (18.2%) | 956 (21.8%) |
| Missing | 1042 (5.5%) | 816 (5.2%) | 314 (7.2%) |
| Economic dependency quintileb | |||
| 1 | 4341 (22.7%) | 3125 (19.8%) | 801 (18.3%) |
| 2 | 4065 (21.3%) | 3112 (19.7%) | 855 (19.5%) |
| 3 | 3592 (18.8%) | 2634 (16.7%) | 751 (17.2%) |
| 4 | 3109 (16.3%) | 2839 (18%) | 763 (17.4%) |
| 5 (Most deprived) | 2947 (15.4%) | 3238 (20.5%) | 893 (20.4%) |
| Missing | 1042 (5.5%) | 816 (5.2%) | 314 (7.2%) |
| Residential instability quintileb | |||
| 1 | 2775 (14.5%) | 2050 (13%) | 514 (11.7%) |
| 2 | 3411 (17.9%) | 2335 (14.8%) | 590 (13.5%) |
| 3 | 3596 (18.8%) | 2757 (17.5%) | 741 (16.9%) |
| 4 | 4200 (22%) | 3535 (22.4%) | 995 (22.7%) |
| 5 (Most deprived) | 4072 (21.3%) | 4271 (27.1%) | 1223 (27.9%) |
| Missing | 1042 (5.5%) | 816 (5.2%) | 314 (7.2%) |
| Situational vulnerability quintileb | |||
| 1 | 3748 (19.6%) | 3066 (19.4%) | 817 (18.7%) |
| 2 | 3788 (19.8%) | 3017 (19.1%) | 777 (17.8%) |
| 3 | 3529 (18.5%) | 2824 (17.9%) | 804 (18.4%) |
| 4 | 3599 (18.8%) | 3112 (19.7%) | 878 (20.1%) |
| 5 (Most deprived) | 3390 (17.8%) | 2929 (18.6%) | 787 (18%) |
| Missing | 1042 (5.5%) | 816 (5.2%) | 314 (7.2%) |
| Hospitalizations | |||
| No hospital admission | 16,876 (88.4%) | 13,708 (87%) | 3508 (80.1%) |
| Hospital admission | 2220 (11.6%) | 2056 (13%) | 869 (19.9%) |
| ICU admissions | |||
| No ICU admission | 18,794 (98.4%) | 15,567 (98.8%) | 4294 (98.1%) |
| ICU admission | 302 (1.6%) | 197 (1.2%) | 83 (1.9%) |
| Deaths | |||
| Alive | 19,081 (99.9%) | 15,760 (100%) | 4354 (99.5%) |
| Died | 15 (0.1%) | 4 (0%) | 23 (0.5%) |
- Abbreviations: ICU, intensive care unit; IQR, interquartile range; SD, standard deviation.
- a Vaccination status: Vaccinated 3+ doses: Received 3rd dose or more (or second dose in combination with Johnson and Johnson) at least 14 days before lab collection date; Vaccinated 2 doses: Received 2nd dose (or first dose of Johnson and Johnson) at least 14 days before lab collection date; Vaccinated 1 dose: Received 1st dose at least 21 days before lab collection date; Unvaccinated: received no dose of any vaccine 21 days before lab collection date.
- b Area level measures of social determinants of health (SDOH) incorporated using the Canadian Index of Multiple Deprivation adapted to the province of BC (BCCIMD). The scale provided (1–5) is an indicator of deprivation, with 1 = least deprived, and 5 = most deprived.

Among hospitalized patients, 582 were further admitted to ICU (Table 1). We observed a 28% lower rate of ICU admission associated with BA.2 infection (0.72 [0.638–0.813, p ≤ <0.001]) compared to BA.1 (Figure 2). We observed a similar decreased risk among those infected with BA.5, (0.875 [0.78–0.981, p = 0.022]). This analysis also highlights age, sex, vaccination status, and SDOH as risk factors associated with ICU admission following infection with Omicron subvariants (Supporting Information: Table S2). Notably, individuals considered highly deprived based on situational vulnerability were associated with more severe outcomes tangential to ICU admission.
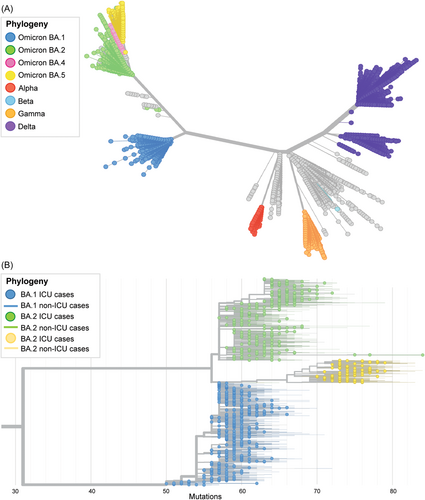
BA.1, BA.2, and BA.5 are phylogenetically distinct both from other variants of concern sequenced during the pandemic and each other (Figure 3A). To investigate the genetic diversity and population structure of these subvariants, we built a phylogenetic tree containing high-quality BA.1/BA.2/BA.5 genomes from our study population, and highlighted cases with the most severe clinical outcomes (i.e., ICU admission) on the tree (Figure 3B). This analysis illustrates that genotypes associated with ICU admission are distributed throughout the phylogeny, indicating that ICU admission is not associated with the evolution of specific genetic subclades of Omicron. Further, we examined differences in haplotypes present at an allele frequency ≥0.01 among those in ICU. There was no statistical difference in the number of mutations (at any site) nor their variability in ICU-admitted patients (mean = 77.6; SD = 4.30) compared to non-ICU infected individuals (mean = 77.3; SD = 4.72), indicating that no mutations from any subvariant could be specifically associated with more severe outcomes (Levene's test: F = 0.66; p = 0.417).

4 DISCUSSION
Given that Omicron continues to evolve and cause infection globally, there is a need to continuously monitor variants that have the potential to cause serious disease. Our findings suggest that compared to BA.1, BA.2 infection corresponds with less severe illness, and BA.5 coincides with more severe illness, after accounting for age, sex, geography, vaccination status, comorbidities, and SDOH (Figure 1). Studies published early in the Omicron wave from Denmark, South Africa, and the United Kingdom found no difference in the clinical severity between BA.1 and BA.2,2, 7, 8 however, more recent reports from these nations (capturing longer study periods) associated BA.2 with a lower risk of hospitalization and/or mortality compared to BA.1.5, 9 Severity analyses involving BA.5 from France and South Africa identified no differences in risk of hospitalization in cases that acquired BA.5 compared to BA.1 infection.5, 10 In contrast, our results support findings recently published in Denmark, which suggest that BA.5 infections are associated with an increased risk of hospitalization compared to earlier Omicron subvariants.11 Although we did not observe a statistically significant increase in aHR for ICU admission related to BA.5 infections, it is noteworthy that crude rates of ICU admission and mortality were higher in BA.5 (1.9% and 0.5%, respectively) compared to BA.1 (1.6%, 0.1%) and BA.2 (1.2%, 0.025%) (Table 1). Differences observed between our study and others could be accounted for by regional differences in testing guidelines, sequencing strategy, vaccination coverage and the state of public health-mandated restrictions.
Our findings also demonstrate a clear protective effect against severe outcomes in those who received two and 3+ doses of the COVID-19 vaccine (44% and 61% lower risk of hospitalization and 61% and 70% lower risk of ICU admission with two, and 3+ doses, respectively), supporting evidence of the booster's protective effect against more severe COVID-19 disease12, 13 whilst differentiating its effect on BA.1, BA.2, and BA.5 sublineages (Supporting Information: Tables S1 and S2). Although our severity analysis did not capture time since last vaccine dose, nor time since last infection, both of these events could have influenced the outcomes we observed. For example, the reduced severity of BA.2 could reflect of a recently boosted population, and the higher severity of BA.5 may be an effect of waning immunity from vaccination, or previous infection.
This study was conducted with a high standard of laboratory-based, statistical, and epidemiological rigor. Using a causal inference framework, IPTW-based propensity scores alleviated confounding threat and reduced biases intrinsic to observational studies. Also, the inclusion of solely WGS-confirmed cases reduces misclassification potential. Incidental hospitalizations represent another potential limitation that was addressed by using a stringent case definition where first positive specimens with a collection date before being hospitalized were excluded.
The conclusions of our study were also limited by the amount of patient-level clinical data that was accessible to us at the time. Additional information on associated co-morbidities that have been reported as risk factors for more severe COVID-19 illness14 (e.g., type 2 diabetes, asthma, autoimmune disease, etc.) have been incorporated into the IPTW analysis to ensure weighting was applied to patients with these pre-existing conditions. Notably, performing the IPTW with and without co-morbidity data did not change the conclusions of this study. At the time of this study, we were unable to obtain detailed clinical characteristics at the time of hospitalization or ICU admission (i.e., mechanical ventilation, intubation, respiratory rate, oxygen saturation, other bloodwork, medications, etc.), however, we agree that these data would provide additional evidence to support the severity findings reported here. A future study capturing these extensive clinical characteristics may also highlight differences in the clinical disease presentation observed in individuals severely affected by BA.1, BA.2, or BA.5 infection, however, this type of analysis would be best supported by an extensive chart review, which was out of scope for this study.
Overall, this investigation reports consistent trends previously identified at earlier stages in the pandemic: rate of hospitalization (1) is greater among males than females, (2) increases incrementally with age, and (3) decreases proportionately with two and 3+ doses of the COVID-19 vaccine. Recognizing the disproportionate effects of the COVID-19 pandemic on marginalized groups, we have incorporated the population-specific finely tuned measures of equity (BCCIMD) into our analysis and report that the risk of more severe disease coincides with several dimensions of SDOH.6
In this study, we combined high-quality SARS-CoV-2 genomic data with rich epidemiological case data using robust statistical analyses to highlight differences in the likelihood of severe outcomes associated with BA.1, BA.2, and BA.5 Omicron subvariants circulating between December 2021 and August 2022. As variants continue to emerge, routine genomic surveillance coupled with continuous integration of epidemiological data rigorously analyzed in real-time is integral to accurately assess risk, and inform patient care and public health measures.
AUTHOR CONTRIBUTIONS
Hind Sbihi, Shannon L. Russell, and James E. A. Zlosnik conceived study concept and design and Hind Sbihi, Braeden R. A. Klaver, Sean P. Harrigan, and Kimia Kamelian contributed to the methodology. Braeden R. A. Klaver conducted the statistical analysis, James E. A. Zlosnik performed the phylogenetic analysis, and Shannon L. Russell wrote and revised the manuscript. Hind Sbihi, Braeden R. A. Klaver, and Sean P. Harrigan provided statistical expertise. Natalie Prystajecky, Linda Hoang, and John Tyson are responsible for the laboratory-related data collection including whole genome sequencing. Beate Sander, Sharmistha Mishra, Naveed Z. Janjua, and Marsha Taylor supported the data interpretation. All authors contributed to editing and reviewing the paper, have approved it for submission and agree to being accountable for its content.
ACKNOWLEDGMENTS
We acknowledge the assistance of the Provincial Health Services Authority, BC Ministry of Health and Regional Health Authorities staff involved in data procurement and management. We thank Dr. Chris Fjell, Dan Fornika, Kim MacDonald, and Sherrie Wang at the BCCDC PHL for laboratory test data management and support in WGS data generation as well as Dr. Drona Rasali and Yayuk Joffres for the development of the BCCIMD. This work was supported by the Canadian Institutes for Health Research (GA1-177697). All inferences, opinions, and conclusions drawn in this letter are those of the authors, and do not reflect the opinions or policies of the Data Steward(s). This study adhered to the STROBE guidelines to ensure the quality and rigor of reporting.
CONFLICTS OF INTEREST
Naveed Z. Janjua participates in Abbvie Advisory Board meeting. All other authors declare no conflict of interest.
ETHICS STATEMENT
This study was reviewed and approved by the Behavioral Research Ethics Board at the University of British Columbia (#H20-02097).
Open Research
DATA AVAILABILITY STATEMENT
The genomic sequencing data is publicly available in GISAID under the submitter British Columbia Center for Disease Control Public Health Laboratory (BCCDC PHL). The individual level demographic and epidemiological data can be made accessible following the data governance and data access policy guidelines, available at http://www.bccdc.ca/about/accountability/data-access-requests. Code used for study models will be made available upon request to the corresponding author.


