Epstein-Barr virus miR-BART2-5p and miR-BART11-5p regulate cell proliferation, apoptosis, and migration by targeting RB and p21 in gastric carcinoma
Abstract
Epstein-Barr virus (EBV) was the first tumor virus discovered in humans and can cause various types of tumors. Molecular classification suggests that EBV-associated gastric cancer (EBVaGC) is a unique subtype of gastric cancer.EBV was also the first virus found to encode its own microRNAs. However, the functions of many miRNAs remain unknown. This study investigated the roles and targets of miR-BART2-5p (BART2-5p) and miR-BART11-5p (BART11-5p) in EBVaGC. The expression of RB and p21 in EBVaGC and EBV negative GC (EBVnGC) cells was evaluated by western blotting. Expression of BART2-5p and BART11-5p in EBVaGC cells was evaluated by droplet digital PCR. The effects of BART2-5p or BART11-5p and their potential mechanisms were further investigated using cell counting kit-8, colony formation assay, flow cytometry analysis, and transwell assay. BART2-5p and BART11-5p were abundantly expressed and RB and p21 were downregulated in EBVaGC cells. BART2-5p regulates RB and p21 expression by directly targeting them. BART11-5p regulates RB expression by directly targeting RB. Both BART2-5p and BART11-5p promoted proliferation and migration of gastric cancer cells, while inhibiting apoptosis and promoting S-phase arrest of the cell cycle. Thus, BART2-5p and BART11-5p play important roles in promoting proliferation and migration, and inhibiting apoptosis in EBVaGC by targeting RB and p21, thus providing new potential therapeutic targets for EBVaGC.
1 INTRODUCTION
Epstein-Barr virus (EBV) belongs to the γ-herpesvirus family and was the first tumor virus identified in humans.1 EBV can cause various types of tumors, including lymphoma, nasopharyngeal carcinoma (NPC), and gastric cancer (GC), among others.2-4 Based on its histopathological characteristics, the molecular classification of GC suggests that EBV-associated GC (EBVaGC) exhibits unique tumorigenesis mechanisms and molecular characteristics.5 According to the 2018 GLOBOCAN project, GC had the fifth highest incidence, with 1 033 701 cases, and the third highest mortality.5 EBVaGC accounts for 2%–20% of all GC cases.6 With an annual incidence of 75 000–90 000 cases, EBVaGC accounts for the majority of EBV-related tumors.5 Compared to other molecular subtypes of GC, EBVaGC has distinct clinicopathological, genomic, and epigenomic features. For example, EBVaGC occurs mainly in young males.6 Common epigenetic features of EBVaGC include extensive DNA promoter hypermethylation and altered expression of EBV-encoded microRNAs (miRNAs).7
EBV was the first virus observed to encode its own miRNAs.7 miRNAs are endogenous 19–25 nucleotide long single-stranded noncoding RNA molecules that mediate posttranscriptional gene silencing by targeting the 3′ untranslated region (UTR) of target mRNA.8 The miRNAs encoded by EBV are grouped into two major clusters: BamHI fragment H rightward open reading frame 1 (BHRF1) and BamHI-A rightward transcripts (BARTs).7 Twenty-five precursor miRNAs and 44 mature miRNAs have been identified in EBV thus far.7 EBV miRNAs interfere with the expression of host genes and inhibit the expression of their own viral antigens.9-11 Although BART miRNAs account for 15% of the total miRNAs in EBVaGC cell lines,12 the functions of many miRNAs remain unknown. The details of the regulatory mechanisms of BART miRNAs require further investigation.
RB transcriptional corepressor 1 (RB, pRB, and RB1) is a typical tumor suppressor gene that was first identified in retinoblastoma.13 RB is a universal cell cycle regulator that plays a central role in controlling initiation of DNA replication and cell division.14 RB exerts its tumor suppressor activity by binding to E2F transcription factors thereby coordinating the G1/S transition in cell cycle progression by controlling the transcription of downstream target genes of enzymes involved in DNA replication.15 The loss of function of RB enables unregulated cell cycle progression, thereby promoting tumor growth. RB is inactivated by genetic or functional inactivation in many human cancers, including retinoblastoma, small-cell lung cancer, prostate cancer, breast cancer, and GC.14, 16-18
The p21 gene, also known as wild-type activating factor-1/cyclin-dependent kinase inhibitory protein-1 (WAF1/CIP1), is a cyclin-dependent kinase (CDK) inhibitor (CKI) that plays an important role as a tumor suppressor in controlling cell cycle progression.19, 20 P21 inhibits G1/S and G2/M progression by inhibiting CDK4, 6/cyclin-D and CDK2/cyclin-E, respectively, thus inhibiting cell cycle progression in G1 and S phases.21 If upregulated, p21 causes cell growth arrest in the G2 phase.22
This study investigated the role of EBV-miR-BART2-5p (BART2-5p) and EBV-miR-BART11-5p (BART11-5p) in EBVaGC and their role in the regulation of cell proliferation, apoptosis, and migration by targeting RB and p21 in GC.
2 MATERIALS AND METHODS
2.1 Cell lines and cell culture
AGS-EBV, GT39, GT38, and SNU719 are EBV-associated GC cell lines; MGC803, AGS, MKN45, and HGC27 are EBV-negative GC (EBVnGC) cell lines. All cell lines were cultured in DMEM (Gibco, Thermo Fisher Scientific) supplemented with 100 U/ml penicillin-streptomycin and 10% fetal bovine serum (FBS) in a 37°C humidified incubator containing 5% CO2.
2.2 Western blot analysis
Treated cells were lysed with radioimmunoprecipitation assay (RIPA) buffer containing 1% phenylmethanesulfonyl fluoride (PMSF) (a protease inhibitor) and 1% phosphatase inhibitor for 30 min to prepare whole-cell extracts. Total protein concentration was measured using a bicinchoninic acid assay (BCA) protein quantitative kit (Boster Biological Technology). Total proteins were separated by 10% SDS sulfate-polyacrylamide gel electrophoresis (SDS-PAGE) and transferred to PVDF membranes. After blocking with 5% skim milk at room temperature, the PVDF membranes were incubated with primary antibodies overnight and then incubated with horseradish peroxidase (HRP)-conjugated secondary antibodies for 2 h at room temperature. Finally, protein bands were detected using Immobilon Western Chemiluminescent HRP substrate. Specific antibodies against RB (Santa, 1:1000), p21 (Cell Signaling Technology, 1:1000), CDK2 (Cell Signaling Technology, 1:1000), CDK4 (Cell Signaling Technology, 1:1000), CDK6 (Cell Signaling Technology, 1:1000), Cyclin D3 (Cell Signaling Technology, 1:1000), BAX (Cell Signaling Technology, 1:1000), caspase-3 (Cell Signaling Technology, 1:1000), caspase-9 (Abmart, 1:1000), N-cadherin (Abcam, 1:1000), E-cadherin (Cell Signaling Technology, 1:1000), Vimentin (Cell Signaling Technology, 1:1000), ZEB1 (Abcam, 1:1000) were used in this study. GAPDH and β-actin (Abcam, 1:1000) were used as loading controls. Student's t-test and ANOVA were used to compare the means between the groups.
2.3 RNA extraction and droplet digital PCR (ddPCR)
Total RNA was extracted from the treated cells using the TRIzol method (Invitrogen). Reverse transcription into cDNA was performed using the PrimeScript RT kit and gDNA Eraser (TaKaRa Bio) according to the manufacturer's protocol. MiRNA expression was evaluated by ddPCR using the QX200™ ddPCR™ EvaGreen Supermix kit (Bio-Rad) on a QX200™ Droplet Reader (Bio-Rad, Hercules).23 The sequences of BART2-5p and BART11-5p were TATTTTCTGCATTCGCCCTTGC and TCAGACAGTTTGGTGCGCTAGTTG, respectively. Droplet digital PCR data were analyzed using the QuantaSoftTM software.
2.4 Transfections with miRNA, small interfering RNA (siRNA) and plasmid
The mimics and inhibitors of miRNAs, siRNAs, and plasmids were transfected into cells using Lipofectamine 2000. The BART2-5p mimic (UAUUUUCUGCAUUCGCCCUUGC), inhibitor (GCAAGGGCGAAUGCAGAAAAUA), BART11-5p mimic (UCAGACAGUUUGGUGCGCUAGUUG), inhibitor (CAACUAGCGCACCAAACUGUCUGA), negative control (NC)(UUCUCCGAACGUGUCACGUTT) and inhibitor NC (CAGUACUUUUGUGUAGUACAA) were provided by GenePharma. The siRNA of RB (GCGCUCUUGAGGUUGUAAUTT) and p21 (CAGGCGGUUAUGAAAUUCATT) were also provided by GenePharma. And the overexpression plasmid of RB and p21 were provided by Genechem. Cells were harvested 24 or 48 h after transfection to detect the expression of related genes and perform further experiments.
2.5 Luciferase reporter assay
The wild-type and mutant 3′-UTR of RB and p21 were inserted into pmirGLO dual-luciferase miRNA targeting expression vectors,24 which were purchased from TSINGKE Biological. First, HEK293T cells were seeded in 24 well plates (5 × 10³ cells/well). After culturing for 12–16 h, 1.5 μg of the recombinant plasmid (wild-type or mutant RB or p21 3′-UTR) and 50 nM miRNA mimics or NC were cotransfected into the cells. Cell lysates were collected 48 h after transfection, and luciferase activity was measured using the dual-luciferase reporter system (Promega). Student's t-test and analysis of variance (ANOVA) were used to compare the means between the groups.
2.6 Cell proliferation assay
Cell proliferation was detected using the Cell Counting Kit 8 (CCK-8)25 (Bosterbio). Cells were seeded into 96-well cell culture plates and cultured at 37°C in an incubator. At 0, 24, 48, 72, and 96 h after transfection, 10 μl CCK-8 reagent and 90 μl cell culture medium were added to each well and incubated at 37°C in an incubator for 2 h. Then, absorbance was measured at 450 nm using a Soft-Max apparatus (Bio-Tek ELx808). Student's t-test and ANOVA were used to compare the means between the groups.
2.7 Colony formation assay
Colony formation assay was performed to detect the proliferation of tumor cells.26 Single cell (100/well) suspensions were inoculated in 6-well plates and cultured at 37°C for 2–3 weeks. The culture was terminated when visible clones appeared on the petri dish. The supernatant was discarded, and cells were gently washed with PBS twice. Each well was fixed with 4% paraformaldehyde for 15–20 min and then treated with crystal violet dye solution (0.1%) for 10–30 min, and then washed with running water. After drying at room temperature, photographs were taken, and relative colony formation ability was calculated. Student's t-test and ANOVA were used to compare the means between the groups.
2.8 Apoptosis and cell cycle assay
Apoptosis was detected using the Annexin V/PI Apoptosis Detection Kit I (Invitrogen). After transfected for 24 or 48 h, the cells were re-suspended in 500 μl binding buffer containing Annexin V-FITC/APC and propidium iodide for 15 min. The samples were analyzed by flow cytometry27 (BD Biosciences).
To analyze cell cycle, transfected cells were fixed with 66% ethanol overnight and then treated with PBS containing 0.5 mg/ml RNase A (Takara) at 37°C for 1 h. Cells were treated then with 5 μg/ml propidium iodide (Abcam) and subjected to flow cytometry analysis.27 Student's t-test and ANOVA were used to compare the means between the groups.
2.9 Transwell assays
A transwell assay was used to detect tumor cell migration.28 The treated cells were adjusted to 1 × 10⁵ cells/ml in serum-free medium and placed in the upper chamber, and culture medium containing 20% FBS was added to the lower chamber. Cells were cultured for 24 or 48 h at 37°C. Membranes were fixed with methanol and stained with crystal violet. The cells in the upper chamber were gently wiped away with a wet cotton swab and the chamber was placed under a microscope to observe and calculate the number of cells passing through the membrane. Student's t-test and ANOVA were used to compare the means between the groups.
2.10 Statistical analysis
All experiments were repeated at least thrice. The results were expressed as mean ± standard error of mean (χ ± s), and the difference between the two groups was compared by Student's t-test or one-way ANOVA for multiple-group comparisons (ns, nonsignificant; p < 0.05, was considered to be statistically significant). SPSS 18.0 Statistical software were performed using for statistical analysis.
3 RESULTS
3.1 Relative expression of RB and p21 in EBVaGC and EBVnGC cell lines
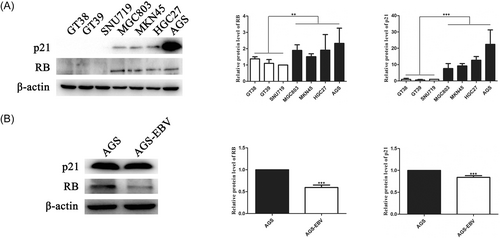
The protein expression of RB and p21 genes in three EBVaGC cell lines (GT38, GT39, and SNU719) and four EBVnGC cell lines (MGC803, HGC27, MKN45, and AGS) was examined by western blot analysis. The results showed that RB and p21 protein expression was downregulated in the three EBVaGC cell lines compared with that in the four EBVnGC cell lines, as shown in Figure 1A. To exclude the influence of genetic background, the expression of RB and p21 in EBV-infected AGS cells (AGS-EBV) and AGS cells were compared separately. The results also showed that RB and p21 protein levels were lower in AGS-EBV cells than in AGS cells (Figure 1B).
3.2 EBV downregulated RB and p21 expression via BART2-5p and BART11-5p
RNAhybrid, RNA22, and Diana tools were used to predict whether EBV-encoded miRNAs could target RB and p21 to explore the reasons for the differences in RB and p21 translation between the EBVnGC and EBVaGC cell lines. Based on the seed match and the free energy of the RNA combination, it was observed that BART2-5p and BART11-5p seed sequences were likely to target the 3′-UTR region of RB, and BART2-5p seed sequences are likely to target p21. There were two binding sites between BART2-5p and RB 3′-UTR, while there was one binding site between BART11-5p and RB 3′-UTR. Quantification of BART2-5p and BART11-5p in EBVaGC cell lines revealed that BART2-5p and BART11-5p expression was abundant in GT39 and AGS-EBV cells (Figure 2A). To determine whether RB and p21 are direct targets of BART2-5p and BART11-5p, HEK293T cells were cotransfected with miRNA oligomers (miRNA mimics or NC) and recombinant plasmids (pmirGLO-RB wild-type (WT)/pmirGLO-p21WT or pmirGLO-RB mutant (MUT)/pmirGLO-p21MUT) for dual-luciferase reporter analysis, as shown in Figure 2B.
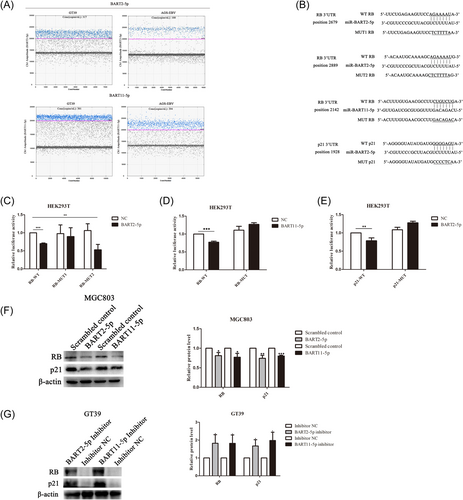
The results showed that compared with the corresponding control group, the luciferase reporter activity of WT pmirGLO-RB was decreased after transfection of HEK293T cells with BART2-5p mimics. Furthermore, the luciferase reporter activity of MUT1 pmirGLO-RB did not change significantly, and the luciferase reporter activity of MUT2 pmirGLO-RB was decreased, as shown in Figure 2C. This suggests that BART2-5p directly targets and downregulates RB via its first binding site (position 2679). In addition, compared with the corresponding control group, the luciferase reporter activity of WT pmirGLO-RB decreased after transfection of HEK293T cells with BART11-5p mimics, and the luciferase reporter activity of MUT pmirGLO-RB did not change significantly, as shown in Figure 2D. Furthermore, compared with the corresponding control group, the luciferase reporter activity of WT pmirGLO-p21 was decreased after transfection of HEK293T cells with BART2-5p mimics, and there was no significant change in the luciferase reporter activity of MUT pmirGLO-p21, as shown in Figure 2E.
Expression of RB and p21 was assessed in the EBVnGC cell line MGC803 and EBVaGC cell line GT39 after transfection of mimics and inhibitors of BART2-5p and BART11-5p, respectively. It was found that the expression of RB and p21 were downregulated after MGC803 cells were transfected with BART2-5p and BART11-5p mimics, while the expression of RB and p21 were upregulated after GT39 cells were transfected with BART2-5p and BART11-5p inhibitors (Figure 2F,G).
These data suggest that BART2-5p could directly target RB and p21 and that BART11-5p could regulate the expression of RB by directly targeting it.
3.3 BART2-5p and BART11-5p could regulate cell proliferation
To explore the biological functions of miRNAs, CCK-8 and plate clonal formation assays were used to detect the effects of BART2-5p and BART11-5p on GC cell proliferation. Mimics and inhibitors of miRNAs were transfected into EBV-negative cell line MGC803 and EBV positive cell line GT39, respectively. The results showed that transfection with BART2-5p and BART11-5p mimics increased cell proliferation, as shown in Figure 3A. Meanwhile, transfection of BART2-5p and BART11-5p inhibitors in GT39 cells reduced proliferation (Figure 3B). The same results were observed after transfecting mimics and inhibitors of BART2-5p and BART11-5p at the same concentration into the EBV-negative cell line AGS and EBV-positive cell line AGS-EBV, respectively, as shown in Figure 3C,D.
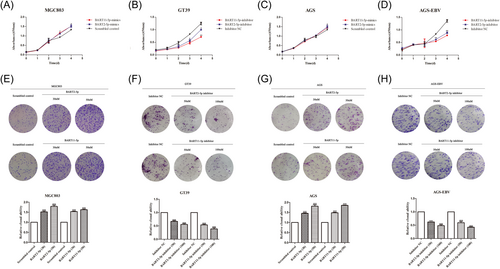
The mimics and inhibitors of miRNAs were transfected into MGC803 and GT39 cells, respectively, for the plate cloning formation assay to verify changes in cell proliferation. The results showed that the clone formation rate of MGC803 cells transfected with BART2-5p and BART11-5p mimics was significantly higher than that of the control group (Figure 3E). The clone formation rate of GT39 cells transfected with BART2-5p and BART11-5p inhibitors was significantly lower than that of the control group (Figure 3F). Similar results were obtained by transfecting mimics and inhibitors of miRNAs into AGS and AGS-EBV cells, respectively (Figure 3G,H).
These results indicated that BART2-5p and BART11-5p promoted the proliferation of GC cells.
3.4 BART2-5p and BART11-5p could regulate cell cycle
Flow cytometry was used to detect the effects of BART2-5p and BART11-5p on GC cell cycle. The mimics and inhibitors of miRNAs were transfected into MGC803 and GT39 cells, respectively, at different concentrations to investigate their effect on cell cycle progression. The results showed that compared with the corresponding NC group, MGC803 cells accumulated a higher percentage of cells in the S phase after transfection with miRNA mimics in a concentration-dependent manner, as shown in Figure 4A. After transfection with miRNA inhibitors, the percentage of GT39 cells in S phase was relatively low, and the percentage of S phase cells decreased in a concentration-dependent manner, as shown in Figure 4B. Transfection of AGS and AGS-EBV cells with the same concentrations of miRNA mimics and inhibitors, respectively, for 24 and 48 h revealed the same pattern, as shown in Figure 4C,D.
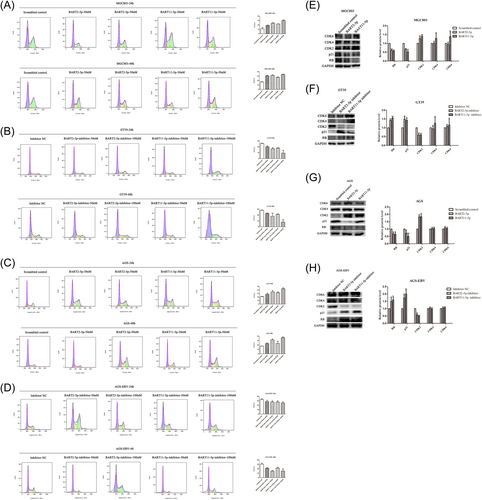
Changes in cell cycle-related molecules were then assessed after transfection of MGC803 and GT39 cells with mimics and inhibitors of BART2-5p and BART11-5p, respectively. The results showed that the expression of CDK2 was upregulated in MGC803 cells transfected with miRNA mimics. There was no significant change in CDK4 and CDK6 expression in MGC803 cells transfected with the BART2-5p and BART11-5p mimics, as shown in Figure 4E. CDK2 expression was also downregulated in GT39 cells transfected with the miRNA inhibitors. There was no significant change in CDK4 and CDK6 expression in GT39 cells transfected with the BART2-5p and BART11-5p inhibitors, as shown in Figure 4F. Transfection of AGS and AGS-EBV cells with the same concentrations of miRNA mimics and inhibitors, respectively, revealed the same pattern, as shown in Figure 4G,H.
Thus, BART2-5p and BART11-5p promote the accumulation of GC cells in the S phase.
3.5 BART2-5p and BART11-5p could regulate apoptosis
To explore the biological functions of BART2-5p and BART11-5p in GC cells, flow cytometry was used to detect how these miRNAs influenced apoptosis. Different concentrations of BART2-5p and BART11-5p mimics and inhibitors were transfected into the MGC803 and GT39 cells, respectively. MGC803 cells were treated with cisplatin (50 μM) for 6 h before detection. Flow cytometry results showed that compared with the corresponding NC group, the apoptosis rate of MGC803 cells significantly decreased after transfection with miRNA mimics, and the apoptosis rate decreased in a concentration-dependent manner, as shown in Figure 5A. After transfection with miRNA inhibitors, the apoptosis rate of GT39 cells increased significantly, as shown in Figure 5B. The same trend was observed after transfecting AGS and AGS-EBV cells with the same concentrations of miRNA mimics and inhibitors for 24 and 48 h, respectively, as shown in Figure 5C,D. AGS cells were treated with cisplatin (50 μM) 6 h before detection.
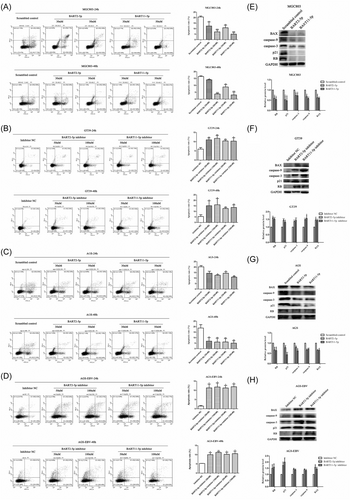
Changes in apoptosis-related molecules were assessed after transfection of MGC803 and GT39 cells with BART2-5p and BART11-5p mimics and inhibitors, respectively, as shown in Figure 5E,F. Results showed that the BAX, caspase-3, and caspase-9 were downregulated in MGC803 cells transfected with miRNA mimics. Similarly, BAX, caspase-3, and caspase-9 were upregulated after transfection of GT39 cells with miRNA inhibitors. The same trend was observed after transfection of AGS and AGS-EBV cells with the same concentrations of miRNA mimics and inhibitors, respectively, as shown in Figure 5G,H.
These results suggest that BART2-5p and BART11-5p inhibit the apoptosis of GC cells.
3.6 BART2-5p and BART11-5p could regulate cell migration
A Transwell assay was used to detect the effects of BART2-5p and BART11-5p on GC cell migration. The results showed that, compared with the corresponding NC group, the migration ability of MGC803 cells was significantly increased after transfection with BART2-5p and BART11-5p mimics in a concentration-dependent manner, as shown in Figure 6A. After transfection with BART2-5p and BART11-5p inhibitors, the migration ability of GT39 cells was significantly reduced (Figure 6B). Similar results were obtained by transfecting AGS and AGS-EBV cells with the same concentrations of miRNA mimics and inhibitors, respectively, as shown in Figure 6C,D.
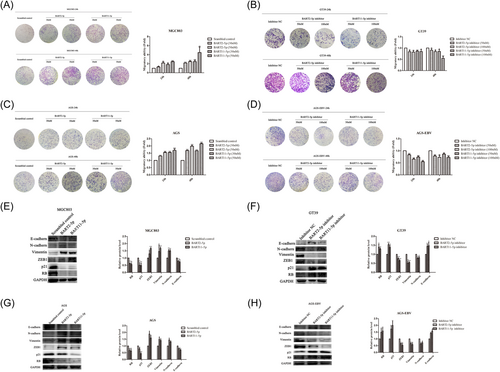
Changes in cell migration-related molecules were assessed in MGC803 and GT39 cells transfected with BART2-5p and BART11-5p mimics and inhibitors, respectively, (Figure 6E,F). The results showed that the N-cadherin, ZEB1, and vimentin were upregulated in MGC803 cells and the expression of E-cadherin was downregulated after transfection with miRNA mimics. Similarly, the expression of N-cadherin, ZEB1, and vimentin was downregulated, and the expression of E-cadherin was upregulated in GT39 cells transfected with miRNA inhibitors. The same results were obtained after transfecting AGS and AGS-EBV cells with the same concentrations of mimics and inhibitors of miRNAs, respectively, as shown in Figure 6G,H.
These results suggest that BART2-5p and BART11-5p promote the EMT and migration of GC cells.
3.7 Overexpression of RB or p21 could partially reverse the effects of BART2-5p and BART11-5p on proliferation, migration, cell cycle and apoptosis of GC cells
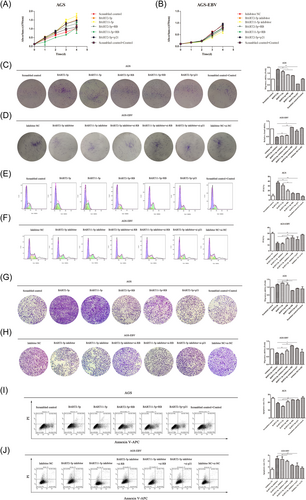
To validate whether RB and p21 are direct targets of BART2-5p and BART11-5p, rescue experiments were performed to determine whether overexpression of RB or p21 could rescue the effects of BART2-5p and BART11-5p on cell proliferation, cell apoptosis, cell cycle, and migration. Two comparisons were designed for rescue experiments. In the first comparison, the mimic of BART2-5p or BART11-5p was cotransfected with RB or p21, respectively, in AGS cells, and in the second comparison, the inhibitor of BART2-5p or BART11-5p was cotransfected with si-RB or si-p21 in AGS-EBV cells. The results showed that the promotion of migration, proliferation, and the accumulation of GC cells in the S phase, inhibition of apoptosis by BART2-5p and BART11-5p in AGS cells was partially reversed by RB or p21 overexpression, as shown in Figure 7A,C,E,G,I. Similarly, cotransfection of BART2-5p or BART11-5p inhibitors and si-RB or si-p21 partially reversed the inhibition of migration, proliferation, and the accumulation of GC cells in the S phase, and the promotion of apoptosis observed in AGS-EBV cells, as shown in Figure 7B,D,F,H,J. In conclusion, this study indicated that BART2-5p and BART11-5p could regulate migration, proliferation, cell cycle, and apoptosis of GC by regulating the expression of RB and p21.
4 DISCUSSION
EBV, a double-stranded DNA virus discovered in 1964, has lymphophagic properties and can transform infected cells via various oncogenic viral proteins.29 After a primary infection, EBV establishes a lifelong carrier state, known as latent infection. During the latency cycle, EBV expresses a limited set of latent gene products known as EBV nuclear antigens (EBNAs), latent membrane proteins (LMPs), EBV-encoded small RNAs (EBERs), 40 miRNAs from BamHI-A rightward transcripts known as BARTs, and 4 miRNAs from BamHI fragment H rightward open reading frame I (BHRF1).30-32 EBV is closely related to the occurrence and development of various tumors, including lymphocytic tumors such as Burkitt's lymphoma and Hodgkin's lymphoma, epithelial tumors such as NPC and GC, and mesenchymal cell-derived tumors such as leiomyosarcoma.7, 33-35 However, only a small fraction of individuals with EBV infection develop EBV-associated cancers, and the risk factors for progression to malignancy are complicated and heavily influenced by genetics and environment. The exact causal mechanism responsible for this phenomenon has not been fully elucidated, and remains an important target for future research.
EBVaGC has unique molecular characteristics and is further classified into one of four subtypes by the Cancer Genome Atlas.7 The latent gene profile of EBVaGC was specific. LMP2A plays an important role in inducing the stemness phenotype, enhancing cell proliferation, preventing cell lysis, and maintaining latent viral infection, performing the oncogenic role of LMP1.36 However, unlike EBNA1, EBERs, and BARTs, which are highly expressed in EBVaGC, LMP2A was expressed in only half of the EBVaGC cases.37 In this study, a difference in the expression of the classical tumor suppressor genes RB and p21 was observed between EBVaGC and EBVnGC cells. Thus, this study further explored whether EBV-encoded BART11-5p could target RB and whether BART2-5p could target RB and p21 simultaneously to inhibit their expression. This study also verified the biological functions of BART2-5p and BART11-5p in EBVaGC and found that both BART2-5p and BART11-5p promote the proliferation and migration, inhibit cell apoptosis, and reduce S-phase arrest of the cell cycle in GC cells. And the effects of miRNAs could be partially reversed by overexpression of RB or p21.
RB was the first identified tumor suppressor, and its encoded protein negatively regulates the cell cycle. It was later found that RB inactivation occurs in many tumor types, especially in hepatocellular carcinoma, lung cancer, and glioblastoma.38-40 Recently, RB has been shown to play other important roles, such as regulating apoptosis, cell differentiation and angiogenesis, induction and maintenance of senescence, and regulation of invasion and metastasis.41, 42 P21 was the first gene identified to be induced by the wild-type p53 protein. Generally, p21 is an important regulator of cell cycle checkpoints, ensuring normal cell division. Increasing evidence suggests that several important tumor suppressor and carcinogenic signaling pathways change the expression of p21, thereby triggering their effects on cell cycle progression and survival by controlling the cell cycle, and inducing apoptosis and senescence.43 Li et al. reported that in addition to its role in cell cycle control during stress response, the loss of p21 also induces EMT, which is mediated in part by activating ZEB1 to downregulate the miR-200 family and miR-183 cluster.44 In the present study, RB and p21 expression was detected in EBVaGC and EBVnGC cell lines. The results showed that the expression of RB and p21 proteins in EBVaGC cell lines was significantly lower than that in EBVnGC cell lines, indicating that EBV infection inhibits the expression of RB and p21 proteins. In a previous study, methylation-specific PCR (MSP) was used to detect the methylation status of the RB gene promoter region in EBVaGC and EBVnGC tissues. The results showed that EBV can induce RB gene promoter hypermethylation, thereby affecting its expression and participating in EBVaGC occurrence.45 This result may explain the downregulation of the RB protein in EBVaGC cell lines to a certain extent. However, it was unclear whether there were other regulatory mechanisms underlying the inhibition of RB and p21 expression by EBV.
MiRNAs can target the 3′-UTR region of genes and regulate gene expression. EBV was the first virus found to encode miRNAs.6 The miRNAs encoded by EBV have been shown to regulate the expression of human genes, affecting the occurrence and development of tumors.46-48 MiR-BART7-3p plays a role in tumor proliferation and invasion via suppression of phosphatase and tensin homolog (PTEN).46 MiR-BART3-3p was found to inhibit tumor infiltration by NK cells and macrophages by altering the senescence-associated secretory phenotype (SASP) in GC.47 In another study, miR-BART5-5p targeted the inhibitor of activated pSTAT3 protein (PIAS3), and pSTAT3 migrated to the nucleus to induce gene transcription.48 EBV-miRNAs have been proposed as biomarkers for distinct EBV-associated tumors and their prognoses.49 In this study, three bioinformatics methods were used to predict EBV-miRNAs targeting RB and p21 genes. Western blot analysis and dual luciferase assay results indicated that both BART2-5p and BART11-5p could regulate the expression of RB protein by targeting its 3′-UTR region. In addition, BART2-5p could also regulate p21 protein expression by targeting its 3′-UTR region. Moreover, Decesse et al. demonstrated a positive transcriptional relationship between RB and p21 in epithelial cells, and found that RB positively regulates the transcriptional expression of the p21 gene.50 This may also explain, to some extent, why the expression of p21 can be inhibited after transfection with BART11-5p mimics in EBVnGC cell lines.
Furthermore, CCK8, plate cloning formation assay, flow cytometry and tanswell assay were used to examine the effects of BART2-5p and BART11-5p on cell proliferation, apoptosis, migration and cell cycle. The results showed that BART2-5p and BART11-5p promoted the proliferation and migration of GC cells, inhibited apoptosis, and reduced S phase cell cycle arrest. This effect could be partially reversed by RB or p21 overexpression, suggesting that BART2-5p and BART11-5p promote GC progression by targeting RB or p21. Yuki et al. and Yoshihiko et al. suggested that BART2-5p might serve as a potential prognostic biomarker in patients with nasal natural killer/T-cell lymphoma and chronic active EBV infection.51, 52 Jiang et al. suggested that BART2-5p may be a valuable biomarker for the early detection of NPC and found that BART2-5p can activate Rho signaling to enhance cell motility by inhibiting RND3, indicating the new role of BART2-5p in promoting metastasis of NPC and its potential value as a prognostic indicator or therapeutic target.53, 54 This shows that although BART2-5p targets different genes in GC and NPC, the mechanisms by which BART2-5p promotes cancer progression are similar. Song et al. found that the EBV-encoded miRNA BART11 downregulated the transcription factor FOXP1 and promoted EMT by directly affecting gastric tumor cells or indirectly affecting the tumor microenvironment, thus accelerating cancer invasion and metastasis, thereby affecting patient survival and prognosis and playing a key role in promoting inflammation-induced carcinogenesis in NPC and GC.55, 56 Wang et al. also found that BART11 inhibits FOXP1 and enhances the transcription of PD-L1, thereby promoting tumor immune escape.57 Ross et al. identified EBF1 as a novel target of BART11-5p and emphasized the potential role of BART-miRNAs in the regulation of B cell differentiation.58 These results suggest that BART11-5p affects tumor progression by targeting different genes in EBVaGC. These results indicate that BART2-5p and BART11-5p may act as oncogenic factors that promote the progression of GC.
In conclusion, RB and p21 are downregulated in EBVaGC cells. Among these, BART2-5p and BART11-5p can jointly target RB, and BART2-5p can also regulate p21 in EBVaGC cells. Furthermore, BART2-5p and BART11-5p participate in regulating cell cycle, proliferation, migration, and apoptosis of GC cells by targeting RB and p21, providing new insight into the pathogenesis of EBVaGC.
AUTHOR CONTRIBUTIONS
Bing Luo and Meng-He Zhao conceived and designed the experiments; Meng-He Zhao and Yan Zhang performed the experiments; Meng-He Zhao, Yan Zhang, Xing Zhang, and Wen Liu analyzed the experimental data; Meng-He Zhao drafted the manuscript; Yan Zhang revised the manuscript. All authors reviewed and approved the final manuscript.
ACKNOWLEDGMENT
This work was supported by the Natural Science Foundation of Shandong Province (ZR2020MH302 [Bing Luo]; ZR2020MC020 [Yan Zhang]; ZR2021MC068 [Wen Liu]).
CONFLICT OF INTEREST
The authors declare no conflict of interest.
Open Research
DATA AVAILABILITY STATEMENT
All data generated or analyzed during this study are included in this. Further enquiries can be directed to the corresponding author.


