Differences in incidence and fatality of COVID-19 by SARS-CoV-2 Omicron variant versus Delta variant in relation to vaccine coverage: A world-wide review
Chao Wang and Bei Liu contributed equally to this study.
Abstract
We aim to evaluate the evolution differences in the incidence and case fatality rate (CFR) of severe acute respiratory syndrome coronavirus 2 (SARS-CoV-2) Delta and Omicron variants. The average incidence and CFRs were described between different countries. A gamma generalized linear mixed model (GLMM) was used to compare the CFRs of Delta and Omicron variants based on vaccination coverage. Totally, 50 countries were included for analyses. The incidence of coronavirus disease 2019 (COVID-19) ranged from 0.16/100,000 to 82.95/100,000 during the Delta period and 0.03/100,000 to 440.88/100,000 during the Omicron period. The median CFRs were 8.56 (interquartile range [IQR]: 4.76–18.39) during the Delta period and 3.04 (IQR: 1.87–7.48) during the Omicron period, respectively. A total of 47 out of 50 countries showed decreased CFRs of the Omicron variant with the rate ratio ranging from 0.02 (95% confidence interval [CI]: 0.01–0.03) (in Cambodia) to 0.97 (95% CI: 0.87–1.08) (in Ireland). Gamma GLMM analysis showed that the decreased CFR was largely a result of the decreased pathogenicity of Omicron besides the increased vaccination coverage. The Omicron variant shows a higher incidence but a lower CFR around the world as a whole, which is mainly a result of the decreased pathogenicity by SARS-CoV-2's mutation, while the vaccination against SARS-CoV-2 still acts as a valuable measure in preventing people from death.
1 INTRODUCTION
The coronavirus disease 2019 (COVID-19) pandemic has brought a huge burden of disease to the world. As of the end of May 2022, there were more than 527 million cases reported, resulting in over 6 million deaths.1 COVID-19 caused by severe acute respiratory syndrome coronavirus 2 (SARS-CoV-2), induced diversified symptoms from mild to life-threatening.2, 3 Nonpharmacological interventions (such as maintaining social distancing, wearing masks, and tracking close contacts) together with the vaccination against SARS-CoV-2 have become the mainstay of health policy strategies to constrain the spread of the virus and reduce the medical burden.4
With a variety of mutations as time goes by, several SARS-CoV-2 variants of concern (VOCs) have greatly changed the epidemic pattern of the COVID-19 pandemic by changing their infectivity, affecting the susceptible population, and changing the case fatality.5 The Delta variant was first detected in India by the end of 2020. Rapidly, it became the major epidemic strain around the world in 2021.6 From the beginning of 2022, the Omicron variant quickly replaced the Delta variant to become the predominant epidemic strain.7 Studies have indicated that both two VOCs possess higher transmissible abilities. Real-world data also suggested a sharp increase in the incidence of COVID-19 during their epidemic periods, especially the Omicron variant.7
The prevention strategy now bears many challenges when facing SARS-CoV-2 mutation.6 Vaccination against SARS-CoV-2 has been expected to be the long-term solution to control the pandemic, putting the social and economic order back on track around the world.8, 9 Studies indicated that COVID-19 vaccines could effectively prevent new infections and severe illnesses and deaths to previous VOCs like Alpha and Beta variants.10 These findings were also consistent with the results of the vaccine's clinical trials. However, there is still a lack of evaluation of the vaccines' effectiveness in the newly emerged VOCs. Based on the current surveillance data, more breakthrough cases have been reported that vaccines developed on the basis of former variants have been doubted for their protection ability against new VOCs.11 The increasing worries have been claimed whether the vaccination against SARS-CoV-2 still was an effective and sufficient way of protecting people from future infection and severe illness in terms of the frequent mutagenicity of SARS-CoV-2.12 Thus, understanding the variations in the infectivity and the case fatality rate (CFR) of COVID-19 by VOCs remains crucially important for medical professionals and policymakers alike.
Practically, the epidemic of Delta and Omicron variants offered us an opportunity to evaluate the evolution differences in infectivity and CFR of these two mutated SARS-CoV-2 variants. In this study, we extracted the incidence and case fatality data of COVID-19 during the exclusive epidemic period of Delta and Omicron and compared their differentiated pathogenicity and lethality. The corresponding vaccination data were also acquired to assess whether vaccines structured based on previous strains still show effectiveness in releasing the disease burden. Factors like stringency index, gross domestic product (GDP) per capita, and proportions aged over 65 years were controlled in detecting vaccine effectiveness around the world. Based on the existing evidence, we hypothesize that (1) countries with different general characteristics show various pandemic patterns in the difference between the Delta and Omicron periods; (2) compared with the Delta variant, the Omicron variant shows a higher incidence but less case fatality around the world as a whole; (3) the vaccination against SARS-CoV-2 still acts as a valuable measure in preventing people from severe illness or even death.
2 METHODS
2.1 Study design and country selection
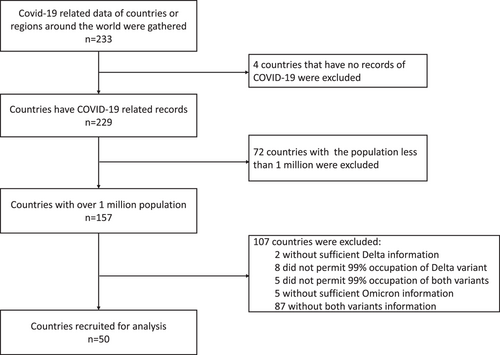
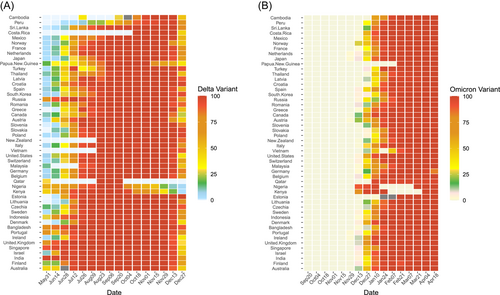
We collected the COVID-19-related data of the involved countries for analysis. Data of new cases and new deaths attributed to SARS-CoV-2 were introduced as the main outcome of the infectivity and case fatality of the target VOCs of Delta and Omicron variants, based on various public databases including Johns Hopkins University CSSE COVID-19 Data, World Bank or local governments.13 Countries with over one million population were firstly enrolled to keep the analysis and conclusion in a more stable way. To sufficiently follow-up on the epidemic change during Delta and Omicron epidemics, countries that reported data on daily or weekly new cases of infection and death, as well as the information of the proportions of variants were included for analysis (Figure 1). In addition, the “Delta period” was defined as the time interval when the Delta variant occupied more than 99% of the total new daily cases (Figure 2A). The “Omicron period” was defined as the time interval when the Omicron variant occupied more than 99% of the total new daily cases (Figure 2B). Since the epidemic strain up to date is still Omicron, we set the end point of the Omicron period as the expiry date of April 27, 2022. To increase the reliability and validity of our results, we excluded the countries if the proportion of Delta or Omicron variant did not reach 99% or above across their epidemic records.
2.2 Data extraction and measurements
The data on the daily new cases and new deaths of COVID-19 recorded by April 27, 2022 on the World Health Organization (WHO) situation reports as well as Our World in Data (OWID) were used.1, 14 In this study, we used the daily numbers of new cases and new deaths in analyzing the situation of each country's situation of COVID-19.14 In addition, we had the daily new death lagged for 7 days since there was suggested an interim between SARS-CoV-2 infection and the related death, which was estimated and averaged as 8 days.15, 16 The average incidence was calculated by the average daily new cases and population size. The average CFR was calculated by the average daily new death and new cases.
The vaccination information was mainly extracted from OWID and supplemented by official governments' release across the world.14 Specifically, we extracted the data on people partially or fully vaccinated to evaluate the effectiveness of COVID-19 vaccines on the Delta or Omicron variant. Partial vaccination coverage was calculated on the basis of the number of people who uptake at least the first dose of the SARS-CoV-2 vaccine. Fully vaccination coverage arrived from the number of people who received all doses prescribed by the initial vaccination protocol, divided by the total population of the country. Moreover, considering the fact that there existed an interim between vaccination injection and protecting efficacy, we extracted the vaccination data backward for 14 days based on the initial and end time points of the Delta period or Omicron period.17, 18 The average vaccination coverages during each period were calculated by arithmetic mean. The type of vaccines was not included since the majority of countries have acquired vaccination strategies with kinds of vaccines distributed, besides the claimed similar efficacy of various SARS-CoV-2 vaccines in preventing severe illness or death.
The none-vaccine stringency index was obtained from the Oxford COVID-19 Government Response Tracker,19 backward for 14 days based on the initial and end time points of the Delta period or Omicron period. The average stringency during each period was calculated by arithmetic mean. This was a composite measure based on nine response indicators including school closures, workplace closures, and travel bans rescaled to a value from 0 to 100 (100 = the strictest).
Data on country income levels and human development index were obtained from the World Bank database.20 GDP per capita based on purchasing power parity (PPP). It was calculated without making deductions for the depreciation of fabricated assets or for the depletion and degradation of natural resources. Data were in constant 2017 international dollars. The Human Development Index (HDI) was a summary measure of average achievement in key dimensions of human development: a long and healthy life, being knowledgeable, and having a decent standard of living.
Basic characteristics of selected countries like population density, median age, the proportion of over 65 years, cardiovascular death rate, female smoker, hospital beds per thousand, and life expectancy (years) were also collected for analysis from World Bank or OWID databases.14, 20
2.3 Statistical analysis
The general characteristics of the countries were described in the median and interquartile range (IQR). We also recategorized the characteristics, and the differences in the CFR of Delta or Omicron were compared between these subgroups and different vaccination coverages by the Kruskal–Wallis test. The average incidences and CFRs were described among different countries. We calculated the rate ratio (RR) and 95% confidence interval (95% CI) to compare the rates of new cases and deaths in each country between Delta and Omicron variants using the Wilson method.21 A pooled analysis was then conducted to summarize the RRs for the incidence and CFRs between countries which was weighted based on the most comprehensive indicator of the human development index. Comparison of the CFRs between Delta and Omicron variants based on vaccination coverages was conducted by the gamma generalized linear mixed model (GLMM) weighted by each country's record. The gamma GLMM model was used to detect whether the decreased CFR was a result of decreased pathogenicity of the Omicron variant, or increased herd immunity alone with increased vaccination coverage, or both.22 CFRs and partial or full vaccination coverages were introduced into the gamma GLMM by their origin unit for better interpretation. The stringency index was introduced directly in terms of its normal distribution. The rest of general characteristics like population size (1–10 million, 10–50 million, and >50 million), proportion of aged over 65 years (<15% and ≥15%) and GDP (<20,000 $, 20,001 to 40,000 $ and > 40,000 $), et al. were included in the adjusted model as categorized variables. R statistical software (version 3.6.3; appendix p 11) was used for data cleaning and statistical analysis. The significance level was considered when the p value was less than 0.05. The spatial data analyses were conducted using ArcGIS (version 10.2, ESRI Corp). R (version 3.6.2) and GraphPad Prism 8.0 (GraphPad Software, Inc.) software were used for statistical analyses and plot production.
3 RESULTS
3.1 Characteristics of countries for analysis
Totally 50 countries were recruited with populations from 1.32 million to 1.39 billion. Population density below 100 persons/Km² was detected in 23 countries (Table 1). The median proportion of the population aged 65 years and older was 16.1% (IQR: 7.9%–19.4%), while the median age of countries showed less degree of variation ranging from 18.1 years (Nigeria) to 48.2 years (Japan). Papua New Guinea showed the highest CFR of Cardiovasc death at 561.5 per 100,000 persons and Japan showed the lowest at 79.4 per 100,000 persons. The GDP per capita was below 20,000$ in 13 countries and above 40,000$ in other 15 countries. The median proportions of female and male smokers were 19.0% (IQR: 5.1%–23.4%) and 31.4% (IQR: 23.6%–39.1%), respectively. About 54% of countries provided more than three hospital beds per 1000 persons. The median life expectancy was 80.3 (IQR: 76.0–82.3) years. The human development index ranged from 0.539 to 0.957. Most of the key variables were correlated to the death of VOCs during their exclusive epidemic periods. Significant associations were not found between the proportion of female smokers, hospital beds per 1000 people, and CFRs. Countries with lower median ages or lower proportions aged 65 and older showed a higher Delta CFR which was not found for the Omicron period. Higher stringency index was significantly correlated with a lower incidence or a higher CFR during the Delta period (p < 0.05) which was not found during the Omicron period (p > 0.05) (Supporting Information: Table S1).
| Characteristic | Median (IQR) | Categorized | N | % | Delta fatality (/1000, M [IQR]) | p value | Omicron fatality (/1000, M [IQR]) | p value |
|---|---|---|---|---|---|---|---|---|
| Population size (million) | 18.2 (5.5, 68.6) | 1 to 10 million | 18 | 36.0 | 5.1 (2.9, 12.9) | 0.006 | 2.6 (1.2, 3.5) | 0.094 |
| 10 to 50 million | 15 | 30.0 | 10.8 (6.4, 28.0) | 4.6 (2.7, 11.2) | ||||
| >50 million | 17 | 34.0 | 15.6 (8.2, 22.8) | 4.4 (1.8, 10.1) | ||||
| Population density (per km²) | 105.8 (61.1, 229.8) | <100 | 23 | 46.0 | 13.5 (6.4, 26.2) | 0.055 | 4.8 (2.8, 11.2) | 0.005 |
| ≥100 | 27 | 54.0 | 6.8 (3.6, 16.9) | 2.5 (1.3, 4.5) | ||||
| Median age (year) | 41.1 (31.8, 43.3) | <40 years | 22 | 44.0 | 17.5 (5.7, 29.7) | 0.012 | 4.6 (2.0, 11.5) | 0.127 |
| ≥40 years | 28 | 56.0 | 6.6 (4.5, 12.3) | 2.7 (1.6, 4.5) | ||||
| Aged >65 years (%) | 16.1 (7.9, 19.4) | <15% | 21 | 42.0 | 18.2 (8.2, 31.4) | 0.003 | 4.5 (2.0, 10.1) | 0.166 |
| ≥15% | 29 | 58.0 | 6.4 (3.9, 12.9) | 2.7 (1.8, 4.9) | ||||
| GDP per capita ($) | 30778.0 (17071.8, 44175.4) | <20, 000 $ | 13 | 26.0 | 24.0 (17.5, 41.6) | <0.001 | 7.3 (4.5, 15.0) | 0.004 |
| 20, 001 to 40, 000 $ | 22 | 44.0 | 8.6 (6.3, 14.4) | 2.9 (2.2, 4.7) | ||||
| >40, 000 $ | 15 | 30.0 | 3.6 (2.9, 6.2) | 2.0 (0.7, 3.0) | ||||
| Cardiovasc death rate (per 100,000) | 153.1 (112.3, 254.2) | <150 | 23 | 46.0 | 4.9 (3.0, 8.8) | <0.001 | 2.3 (1.1, 4.5) | 0.003 |
| ≥150 | 27 | 54.0 | 15.6 (7.3, 24.0) | 4.4 (2.9, 10.8) | ||||
| Female smokers (%) | 19.0 (5.1, 23.4) | <20% | 30 | 60.0 | 9.1 (5.0, 22.2) | 0.303 | 2.9 (1.5, 8.4) | 0.968 |
| ≥20% | 20 | 40.0 | 7.0 (4.5, 15.1) | 3.2 (2.1, 6.6) | ||||
| Male smokers (%) | 31.4 (23.6, 39.1) | <30% | 23 | 46.0 | 6.2 (2.9, 15.6) | 0.026 | 2.7 (0.9, 9.7) | 0.514 |
| ≥30% | 27 | 54.0 | 13.0 (6.8, 19.0) | 3.4 (2.3, 7.0) | ||||
| Hospital beds (/1000 people) | 3.2 (2.3, 5.6) | <3 beds per thousand | 23 | 46.0 | 10.8 (3.6, 24.0) | 0.606 | 4.4 (1.5, 9.7) | 0.345 |
| ≥3 beds per thousand | 27 | 54.0 | 7.3 (5.7, 16.8) | 2.8 (2.0, 7.0) | ||||
| Life expectancy (year) | 80.3 (76.0, 82.3) | <80 years | 24 | 48.0 | 16.9 (12.9, 31.7) | <0.001 | 7.2 (3.3, 11.6) | <0.001 |
| ≥80 years | 26 | 52.0 | 5.2 (3.0, 8.5) | 2.2 (1.0, 2.9) | ||||
| Human development index | 0. 9 (0.8, 0.9) | <0.90 | 28 | 56.0 | 16.2 (8.4, 27.5) | <0.001 | 4.5 (2.9, 10.7) | 0.001 |
| ≥0.90 | 22 | 44.0 | 4.6 (3.0, 6.9) | 2.1 (1.0, 2.9) |
3.2 Change of the incidence and CFR between Delta and Omicron variants
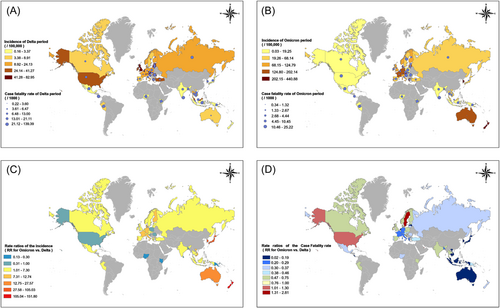
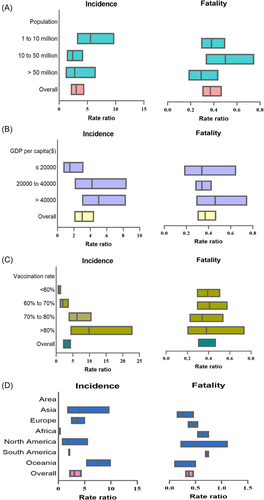
The incidence of COVID-19 ranged from 17.14/100,000 (IQR: 4.07/100,000–38.93/100,000) during the Delta period to 61.66/100,000 (IQR: 17.07/100,000–144.94/100,000) during Omicron period (Supporting Information: Table S2 and Figure 3). A much higher incidence was found by the Omicron variant than by the Delta variant among 41 countries with the RRs ranging from 1.10 (95% CI: 1.06–1.14) in Czechia to 151.80 (95% CI: 123.09–187.20) in New Zealand, while nine countries showed a decreased incidence during Omicron period rather than Delta period, with the RRs ranging from 0.13 (95% CI: 0.10–0.17) by Nigeria to 0.56 (95% CI: 0.54–0.58) by Poland. Kenya and Nigeria showed the top two proportional decreases with RRs as 0.18 (95% CI: 0.14–0.22) and 0.13 (95% CI: 0.10–0.17), respectively. The pooled analysis results showed the overall RR of the Omicron variant for the incidence of COVID-19 was 3.02 (95% CI: 2.06–4.45) compared with the Delta variant. The RR for the incidence of COVID-19 was 1.40 (95% CI: 1.38–1.43), 1.84 (95% CI: 1.82–1.86), and 2.27 (95% CI: 2.18–2.37) in India (GDP per capita < 20000$), the United Kingdom (GDP per capita 20000 to 40000$), and Canada (GDP per capita >40000$), respectively. The RR for the incidence of COVID-19 increased strongly with the increase of the country's GDP. When GDP reached above 40000$ per capita, the RR increased to 5.01 (95% CI: 3.01–8.32). The cCFR revealed a reversed trend and decreased drastically during the Omicron period, varying from 8.57 (IQR: 4.76–18.39) during the Delta period to 3.04 (IQR: 1.87–7.48) during the Omicron period (Supporting Information: Table S2 and Figure 3). Totally, the RR of CFR between the Omicron and Delta periods was 0.37 (95% CI: 0.30–0.47) by the pooled analysis (Supporting Information: Table S3 and Figure 4). A total of 47 countries showed a decreased CFR of COVID-19 by Omicron variant with the RRs ranging from 0.02 (95% CI: 0.01–0.03) (in Cambodia) to 0.97 (95% CI: 0.87–1.08) (in Ireland). Qatar, Sweden, and United States showed increased CFRs of 2.81 (95% CI 0.39–20.26), 2.07 (95% CI: 1.89–2.29), and 1.30 (95% CI: 1.30–1.32), respectively (Supporting Information: Table S2 and Figure 3). The RRs of the Omicron variant for CFR compared with the Delta variant were 0.26 (95% CI: 0.14–0.47), 0.63 (95% CI: 0.53–0.76), 0.44 (95% CI: 0.35–0.55), 0.48 (95% CI: 0.21–1.12), 0.72 (95% CI: 0.68–0.76) and 0.22 (95% CI: 0.09–0.51) among countries in Asia, Africa, Europe, North America, South America, or Oceania areas (Supporting Information: Table S3 and Figure 4).
3.3 Impacts of SARS-CoV-2 vaccination on the CFR during Delta or Omicron periods
The median vaccination coverage was 63.0% (IQR: 51.0%–72.1%) and 53.3% (IQR: 42.3%–63.0%) for people with partial and full vaccination during the Delta period, respectively. The median CFRs of COVID-19 among countries with partial vaccination coverages <50%, 50%–60%, 60%–70%, and ≥70 showed significant differences as 18.6/1000, 6.9/1000, 8.3/1000, and 4.9/1000, respectively (p = 0.009). The median CFRs of COVID-19 in three fully vaccination coverage subgroups of <50%, 50%–60%, or >60% were 16.8/1000 (IQR: 6.6–28.5), 13.0/1000 (IQR: 5.9–16.3), and 4.6/1000 (IQR: 2.9–9.2), respectively (p = 0.009). The median vaccination coverage increased to 76.8% (IQR: 66.6%–81.6%) and 71.9% (IQR: 59.8%–79.1%) for people with partial and full vaccination during the Omicron period, respectively (Figure 5 and Supporting Information: Table S4). Similarly, higher vaccination coverage corresponded to lower CFRs for partial or full vaccination (both p = 0.002). Results of pooled analysis showed that compared with the Delta variant, the RR of the Omicron variant for CFR was 0.41 (95% CI: 0.29–0.58) with the full vaccination rates of 60%–70% and 0.34 (95% CI: 0.22–0.54) with the full vaccination rates of 70%–80%, respectively (Supporting Information: Table S3 and Figure 4).
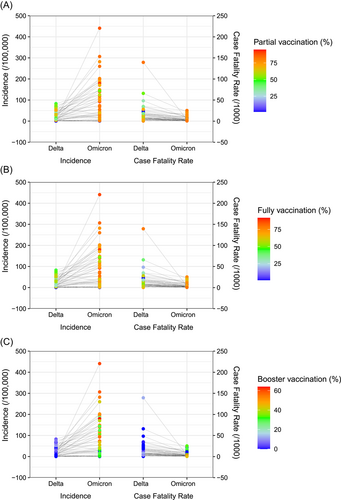
Generally, the CFR dropped from 8.56/1000 (4.76/1000, 18.39/1000) to 3.04/1000 (1.87/1000, 7.48/1000) between Delta and Omicron periods. Partial, fully or booster vaccination coverages increased from 63.0% (IQR: 51.0%, 72.1%), 53.3% (IQR: 42.3%,63.0%) or 1.79% (IQR: 0.0%, 4.07%) to 76.8% (IQR: 66.6%,81.6%), 71.9% (IQR: 59.8%,79.1%) or 39.3% (IQR: 24.8%, 52.2%), respectively. The crude coefficients of gamma GLMMs showed that in different pandemic periods (as of pathogenicity of each variant), and vaccination coverages were of statistical significance except for the booster model (Table 2). When general information like population sizes, GDPs, or human development indexes were introduced into the regression model, the variables of vaccination coverages became nonsignificant, while pandemic periods kept significant in the models. The global goodness of fit of such GLMMs is listed in Supporting Information: Table S5.
| Variables | Fatality (per 1000)/Median coverage (%) (M, IQR) | Crude coefficient | p value | Adjusted coefficient | p value | |
|---|---|---|---|---|---|---|
| Study interval | Delta variant | 8.56 (4.76, 18.39) | 0.87 (0.63 to 1.11) | <0.001 | 0.82 (0.51 to 1.12) | <0.001 |
| Omicron variant | 3.04 (1.87, 7.48) | |||||
| Vaccinated at least 1 dose | Delta variant | 63.0 (51.0,72.1) | –0.02 (–0.03 to –0.01) | <0.001 | 0.01 (–0.01 to 0.02) | 0.782 |
| Omicron variant | 76.8 (66.6,81.6) | |||||
| Study interval | Delta variant | 8.56 (4.76, 18.39) | 0.81 (0.56 to 1.07) | <0.001 | 0.83 (0.49 to 1.16) | <0.001 |
| Omicron variant | 3.04 (1.87, 7.48) | |||||
| Fully vaccinated | Delta variant | 53.3 (42.3,63.0) | –0.02 (–0.03 to –0.01) | <0.001 | –0.01 (–0.02 to 0.01) | 0.602 |
| Omicron variant | 71.9 (59.8,79.1) | |||||
| Study interval | Delta variant | 8.56 (4.76, 18.39) | 0.36 (–0.32 to 0.1.03) | 0.297 | 0.54 (–0.18 to 1.26) | 0.139 |
| Omicron variant | 3.04 (1.87, 7.48) | |||||
| Booster dose | Delta variant | 1.79 (0.0, 4.07) | –0.03 (–0.04 to –0.02) | <0.001 | –0.01 (–0.03 to 0.01) | 0.299 |
| Omicron variant | 39.3 (24.8, 52.2) |
- Note: Stringency index, population size, population density, median age, Cardiovasc death rate, proportion of female smokers, hospital beds per 1000-person, GDP, and the Human development index were included in the adjusted model.
- Abbreviations: GDP, gross domestic product; GLMM, generalized linear mixed model.
4 DISCUSSION
Special attention should first be paid to the low-income and underdeveloped countries since the single factor tests have shown that the CFRs among countries with low GDP per capita, low hospital beds per 1000 people, low life expectancy, or low human development index were significantly higher. An exploratory factor analysis about COVID-19 published in the Lancet has identified that population density, GDP per capita, and human development index were important factors in infection and fatality rates.23 Our results showed that the RR of the incidence of COVID-19 increased strongly with the increase of the country's GDP. This is consistent with the previous literature, GDP per capita had a positive influence on the incidence of confirmed cases of COVID-19.24 Similarly, an ecological study revealed a positive correlation between GDP and COVID-19 case incidence in 50 US states and territories and 28 European countries.25 The potential reason could be high-level development in facilitating infectious disease spread, such as a more advanced transportation system,26, 27 large metropolitan cities with high population density,28, 29 better domestic and international travel for business, and more group activities.30, 31 However, it could also be a result of a coincidence since higher income countries conducted more testing for COVID-19 than did lower income countries. Their pandemic surveillance sensitivity is higher than that of lower income countries in reporting the COVID-19 incidence. On the contrary, the death surveillance related to COVID-19 should be less heterogeneous regardless of varied death case definitions around the world. And our result also supported it as the CFR was found much lower among higher income countries. Increasing vaccination coverage for SARS-CoV-2 in underdeveloped countries was more important as their social development could not be largely improved within a short time. As vaccination before the elderly has been the major strategy around the world, its value was also confirmed that countries with a higher proportion of the population aged >65 years showed much lower CFRs.11 Our result supports such a conclusion in the worldwide view that countries with higher median ages or proportion aged 65 years showed lower CFRs probably due to their higher vaccination coverages among elders. Furthermore, people with underlying chronic conditions should be another key population that needs special attention. Vaccination among such populations was generally more cautious and usually postponed in many countries.32 However, our results showed increased CFRs among countries with higher cardiovascular death rates. It indicates careful consideration should be paid to the risk of SARS-CoV-2 infection and the potential side effects of vaccination among them. During the Delta period, the stringency index was negatively related to new infections. However, such a relationship was not detected during the Omicron period. In other words, the effectiveness of nonpharmaceutical measures in protecting people from new infections was largely decreased in terms of the increased infectivity with SARS-CoV-2's mutation.
Our analysis showed that the Omicron variant acquired a higher incidence than the Delta variant which was similar to other studies. The average incidence of COVID-19 increased about two folds during the Omicron period compared with the Delta period among the countries as a whole after pooled-analysis of the RRs of incidences. Nine out of 50 countries showed decreased incidence whereas the two African countries Kenya and Nigeria had the largest incidence decrease by over 80%. However, the surveillance sensitivity might be a major factor since their incidence of Delta or Omicron variants was all at a very low level.33-35 New Zealand and South Korea reported being with the top two Omicron incidence as of 259/1000,000 and 440/1000,000 which increased by over 100 folds compared with the Delta variant. The sudden infection increase might be related to the relaxed nonpharmacotherapy interventions at a social level. We concluded that the Omicron variant acquired a higher incidence and transmission capability in the population even though the vaccination coverages increased to a higher level during the Omicron period.
On the contrary, CFR showed an obvious decrease of 63% during Omicron period comparing to Delta period overall. To this aspect, only three countries, including Qatar, Sweden, and United States, showed an increase of CFRs. The CFR in Qatar kept at a low level during Delta and Omicron periods, which was estimated at less than 0.1%. The reason for these increases in the CFRs of Sweden and the United States may be associated with the local monitored levels, technology, and control strategies.36 Fortunately, the majority of countries have their Omicron-related case fatality decreased to a large extent. The lowest RR of CFRs between the Omicron and Delta periods was found in two Asia countries of Cambodia and Vietnam reaching 0.02, while their absolute CFRs were largely different as of 2.85/1000 versus 0.35/1000. These findings were consistent with a South African study, which revealed that the Omicron variant was highly transmissible but with significantly lower CFRs than those of previous variants of SARS-CoV-2.37 GLMM analysis confirmed the decrease of CFR after controlling the independent impact of vaccination coverages. Likewise, a recently published large European study demonstrated that the CFR of COVID-19 varied substantially among the European Economic Area countries and was independently linked with low vaccination rates.38 Thus, our second hypothesis was largely supported by the results arrived from the 50 selected countries. However, the CFRs were estimated at>1% in 10 countries, and >0.1% in 43 countries. Based on the fact of drastically increased infectivity, the Omicron variant might still cause a heavy burden on society and public health with a large number of absolute death cases, even though it would decrease the CFR.
Studies have indicated that the effectiveness of the SARS-CoV-2 vaccines against new variants reduced with regard to preventing new infection, but remained in protecting the population from severe related diseases and death. The results of the present review of around 50 countries further supported such conclusions in the real-world environment. On the one hand, we found a positive correlation between vaccination coverage and the incidence of COVID-19. We suppose that it was an interactive effect between the increased incidence of SARS-CoV-2 variants, the limited vaccine effectiveness, and waning immunity/antibody in preventing new infections of Delta or Omicron variants in public.39-42 In other words, as many countries relaxed their epidemic control at the social or personal level, the rebound of new infection cases was destined during the Delta and Omicron waves. It also explained the phenomenon that countries with higher GDPs showed increased RRs for the incidence of COVID-19, while that higher vaccination coverage correlated to higher incidence might still be a result that countries with higher vaccination coverage possessed higher surveillance sensitivities of COVID-19.
On the other hand, vaccination proved to be an independent factor in preventing people from severe diseases and death relating to the new variants of Delta and Omicron, especially when the COVID-19 vaccine coverage rate was over 60%.43 This firstly clarified the effectiveness of vaccination in protecting death in the real environment on the world scale which was also in line with a large number of locational studies.44-46 Our results showed that higher partial or full vaccination coverages significantly correspond to lower CFRs either for the Delta variant or the Omicron variant, respectively. Moreover, GLMM indicated that higher full vaccination coverages through continuous vaccination permit further protective effectiveness among the general population within a country as a whole. It confirms the value of full vaccination to SARS-CoV-2 variants in saving lives. For now, vaccination might still be one of the most cost-effective ways in deducing the social and disease burden of SARS-CoV-2. Moreover, vaccine-stimulated herd immunity maintains crucial to provide protection against infection, mitigate outbreak size, and improve public health conditions on the whole.43, 47 Completion of the vaccination schedule is important in ensuring the effectiveness of SARS-CoV-2 vaccines. We did not perform further stratified analysis (vaccination doses, vaccine-targeted types, vaccination strategies, etc.) due to a lack of sufficient usable data and statistical independence. Therefore, the results of this study have certain limitations, which will become the focus of our subsequent research.
This study was subject to several limitations. First of all, this study was ecologically analyzed based on vaccination coverage and records related to SARS-CoV-2. The causal relationship could not be drawn. The factors that impact the prevalence of COVID-19 or vaccine effectiveness could not be determined which might lead to an ecological fallacy. To address this, we included a variety of factors that might confound the protective effects of COVID-19 vaccination, including the general characteristics, and nonvaccine prevention stringency of each involved country. Second, the data used in our study were extracted from a public database, which bears the risk of insufficient accuracy in representing the actual situation and timeliness. Although we ensured that the sampling frame of each country aligns with a uniform standard, factors like recording criteria and testing or reporting sensitivity within countries were not guaranteed to be representative or comparable. Also, for now, we could only standardize such differences by introducing the general characteristics into our analysis and multifactor models. Third, our estimates of the variables like the new cases or new deaths, although based on country-level information, were not age or population specified, which might lead to a statistical mistake. The kinds of vaccines measured between different countries were not classified for analysis in terms of their similar effectiveness in preventing new infections or severe illnesses claimed by previous reports. A booster dose of vaccination as continuous efforts will be paid for the pandemic control, it is necessary to evaluate the effectiveness of vaccination and prompt vaccine equity before we acquired sufficient public health guarantees.
5 CONCLUSIONS
During the periods of Delta or Omicron, countries with a higher level of economic and social development showed advantages in saving peoples' lives though they bear more infection incidence. Compared with the Delta variant, Omicron showed higher infectivity but less case fatality around the world as a whole which is mainly due to the decreased pathogenicity by mutation. The incidence of COVID-19 increased strongly with the increase of the country's GDP. Vaccination still acts as a valuable measure in preventing people from death, the higher immunization coverage, the lower the fatality rate, even though its effectiveness in preventing new infections is limited for the new variants like Delta or Omicron. Therefore, the findings reaffirmed the importance of the COVID-19 vaccination and the equity of the vaccine distribution.
AUTHOR CONTRIBUTIONS
Qing-Bin Lu, Fuqiang Cui, and Chao Wang conceived and designed the experiments, reviewed drafts of the paper, and approved the final draft. Chao Wang and Bei Liu collected and analyzed the data, prepared figures and tables, authored drafts of the paper, and approved the final draft. Sihui Zhang, Ninghua Huang, and Tianshuo Zhao collected the data and performed the investigations. Chao Wang, Sihui Zhang, and Ninghua Huang cleaned the data and prepared figures and tables. All authors have approved the final draft and agreed to the published version of the manuscript.
ACKNOWLEDGEMENTS
This study was supported by the National Key Research and Development Program of China (2021YFC2301604), National Science and Technology Project on Development Assistance for Technology, Developing China-ASEAN Public Health Research and Development Collaborating Center (KY202101004), Fundamental Research Funds for the Central Universities and Peking University Health Science Center (BMU20170607), Peking University Medicine Fund of Fostering Young Scholars' Scientific & Technological Innovation (BMU2021PY005) and Joint Research Fund for Beijing Natural Science Foundation and Haidian Original Innovation (L202007).
CONFLICT OF INTEREST
The authors declare no conflict of interest.
Open Research
DATA AVAILABILITY STATEMENT
The datasets generated and analyzed during the current study are available in public database as Our World in Data, the Oxford COVID-19 Government Response Tracker, and the World Bank.


