Immunoassay and mass cytometry revealed immunological profiles induced by inactivated BBIBP COVID-19 vaccine
Zhangkai J. Cheng, Huimin Huang, Qiwen Liu, and Ruifen Zhong contributed equally to this study.
Abstract
With the global prevalence of COVID-19 and the constant emergence of viral variants, boosters for COVID-19 vaccines to enhance antibody titers in human bodies will become an inevitable trend. However, there is a lack of data on antibody levels and the protective effects of booster injections. This study monitored and analyzed the antibody potency and the antibody responses induced by the booster injection in the subjects who received three vaccine doses. The study was conducted in a multicenter collaboration and recruited 360 healthy adults aged 20–74. Participants received the first, second, and booster doses of inactivated Sinopharm/BBIBP COVID-19 vaccine at 0, 1, and 7 months. Vaccine-induced virus-specific antibody levels (SARS-COV-2-IgA/IgM/IgG) were monitored at multiple time points, surrogate virus neutralization test (sVNT), and the spatial distribution and proportion of immune cells and markers were analyzed using the CyTOF method before vaccination and a month after the second dose. The titers of SARS-CoV-2-IgA/IgM/IgG and neutralizing antibodies increased to a high level in the first month after receiving the second dose of vaccine and declined slowly after that. The antibody levels of SARS-CoV-2-IgG and sVNT were significantly increased at 0.5 months after the induction of the booster (p < 0.05). Despite a downward trend, the antibody levels were still high in the following 6 months. The B cell concentration (in humoral sample) a month after the second injection was significantly reduced compared to that before the vaccine injection (p < 0.05). The proportion of the C01 cell cluster was significantly decreased compared with that before vaccine injection (p < 0.05). Individual cell surface markers showed distinctions in spatial distribution but were not significantly different. This study has shown that serum antibody titer levels will decrease with time by monitoring and analyzing the antibody efficacy and the antibody reaction caused by the booster injection of healthy people who received the whole vaccination (completed three injections). Still, the significant peak of the antibody titer levels after booster highlights the recall immune response. It can maintain a high concentration of antibody levels for a long time, which signifies that the protection ability has been enhanced following the injection of booster immunization. Additionally, CyTOF data shows the active production of antibodies and the change in the immunity environment.
1 INTRODUCTION
On March 11, 2020, the World Health Organization (WHO) qualified the coronavirus disease 2019 (COVID-19) outbreak as a pandemic. COVID-19 is a respiratory infectious disease caused by severe acute respiratory syndrome coronavirus 2 (SARS-CoV-2), the seventh known coronavirus that can infect and cause human diseases.1 SARS-CoV-2 is an encapsulated single-stranded RNA (ssRNA) virus whose S protein attaches to the host cell's angiotensin-converting enzyme 2 (ACE2) receptor and is then activated by the transmembrane protease serine (TMPRSS2). During viral fusion through the membrane into the host cell, TMPRSS2 cleaves the S protein into two subunits, S1 and S2.2 The RBD of S protein is the principal target for neutralizing SARS-CoV-2 by antibodies, which can inactivate the virus by disrupting its binding to the ACE2 receptor and restricting its transmission and diffusion.
Vaccines are the best reliable and cost-effective method to avoid and manage infectious diseases.3, 4 Three vaccines are mainly used in China: inactivated, adenovirus vector, and recombinant protein. The inactivated vaccine is mainly through the physical or chemical method to kill the infectious virus but at the same time keep the integrity of the antigen particles, make them lose pathogenicity, and retain antigenicity, inducing the protective humoral immunity in the recipient. Sinovac's CoronaVac and Sinopharm's Beijing Bio-Institute of Biological Products Coronavirus Vaccine (BBIBP-CorV) are the two main COVID-19 inactivated vaccines homegrown and used in China. The safety and effectiveness of the two inactivated vaccines have been confirmed in preclinical trials, showing safety and immunogenicity in clinical trials.5-7 Studies8, 9 have demonstrated that the neutralizing antibody reaction was detected within 14 days after the injection of the inactivated vaccine, indicating that the inactivated vaccine may be effective in inducing antibody production. Further increases in neutralizing antibody titers after the third injection indicated the need for a booster injection.
With the decline of immunity and the emergence of new mutations, data describing the changes in antibody dynamics with time after vaccination began to appear. Nevertheless, little information about enhancing the antibody levels and protective effect of inactivated vaccine after injection is available, and it is still uncertain whether the high-level circulating antibody lasts long enough to avoid further infection. This paper studied the immunogenicity, persistence, and effect of the Sinopharm/BBIBP COVID-19 booster vaccine in healthy Chinese adults. We monitored the virus-specific antibodies (SARS-CoV-2-IgA/IgM/IgG) generated by healthy people during the whole vaccination procedure and performed a surrogate viral neutralization test (sVNT) to evaluate their protection against virus invasion. In addition, we also analyzed the immune cell subsets and the expression of surface markers of peripheral blood mononuclear cell (PBMC) in our patient's peripheral blood samples using flow mass spectrometry. The phenograph algorithm was employed to observe the changes in cell subsets after vaccination and explore their mechanism. This study solved the key problem of how antibodies' antibody level and neutralizing ability in healthy people change during vaccination with the BBIBP vaccine and explored the immune mechanism induced by vaccination. This study is a continuing work of a previous paper published.10
2 MATERIALS AND METHODS
2.1 Study subjects
This study was approved by the Scientific Research Project Reviews Ethics Committee of the First Affiliated Hospital of Guangzhou Medical University (Document 2021 No. 31). The study's initial participants were 500 healthy individuals from Guangzhou Medical University's First Affiliated Hospital, Zunyi Medical College's Fifth Affiliated Hospital, and Dongguan's Eighth People's Hospital. A total of 360 healthy volunteers (108 men, 252 women) aged 20–74 years (median: 33) were finally included in the whole study process after meeting all relevant participant selection criteria and removing individual participants who withdrew from the study during follow-up monitoring. Before and during the study, all individuals were free of SARS-CoV-2 infection, completed questionnaires on unpleasant symptoms, and signed informed consent. Participants must be healthy, 18 years old or older, willing to participate, and understandable. The main exclusion criteria include 1. Individuals with uncontrolled epilepsy and other severe neurological conditions; 2. Individuals with severe vaccine allergic responders in the past; 3. Patients with fever, acute diseases, acute episodes of chronic diseases, or uncontrolled major chronic sickness; 4. Pregnant women; 5. Those who test positive for COVID-19 infection by PCR or have a history of COVID-19 infection.
2.2 Vaccination and sample
Upon obtaining the subjects' written informed consent, the Sinopharm/BBIBP COVID-19 vaccine (4 μg dose) was injected at the corresponding time points. The interval between the first and second doses was 28 days, and the third dose (booster) was given 7 months after the first dose. The actual interval between the booster and initial injection was 7–10 months. Participants' blood samples were collected at the following points (based on the first dose): Months 0, 1 (second dose), 2, 3, and 6, and Months 0.5, 1, 3, and 6 post-boost. The data were collected from January 26, 2021, to April 20, 2022.
Healthy participants were followed up, and whole blood samples were collected at the 8-time points mentioned above, with the same sample volume collected at each time point. After standing for 2 h, the whole blood samples were separated at 3000 rpm/s for 10 min. The serum was then extracted and stored at −80°C for testing.
PBMC extraction was performed on participants' blood samples at various follow-up time points, with consistent volume and concentrations of PBMC extracted at each time point per participant. Step 1: take 5 ml whole blood sample and add PBS to dilute by 1:1. Add 5 ml separating solution and diluted sample into the separation tube, and then gradient centrifugation was performed at 3500 rpm, 15 min, under room temperature. Step 2: the supernatant was discarded after centrifugation, and the cell pellet was resuspended using 1 ml of PBS, while 5 volumes of PBS solution were added to the tube for centrifugation at 1500 rpm, 10 min, room temperature. This step was repeated twice to achieve the purpose of washing the cells. Step 3: resuspend and pipet 1 ml of cell cryopreservation solution (10% DMSO + 90% FBS) on cleaned cells to mix. Then add another 1 ml of cryopreservation solution to mix the aliquot according to the required concentration and volume. The PBMC samples were frozen at −80°C before being transferred to the liquid nitrogen tank within 24 h.
We evaluated vaccine-induced immune responses from two aspects, humoral immunoassay and mass cytometry. Humoral immunoassay detected and evaluated the titer of SARS-CoV-2 specific antibody IgA/IgM/IgG and receptor-binding domain (RBD) neutralizing antibody sVNT using serum samples from participants. Mass cytometry, also known as Cytometry by Time of Flight (CyTOF), was used to analyze PBMC extracted from participants' blood samples.
2.3 Serum antibody detection
Serum samples were collected from participants and were used to detect SARS-CoV-2-IgA/IgM/IgG-specific antibodies using an Axceed 260 clinical chemiluminescence immunoassay automatic analyzer (Tianjin Bioscience Diagnostic Technology Co., Ltd.) and a supporting immunoassay detection kit, and referring to relevant laboratory operation specifications and operation instructions. The indirect chemiluminescence method (RLU) measured the corresponding relative light unit. The RLU values were translated to a final titer value in units of S/CO, which is inversely proportional to the concentration of SARS-COV-2 IgA/IgM/IgG antibodies.
2.4 Surrogate virus neutralization test
Using the competitive chemiluminescence method, the Axceed 260 automated test and associated immunoassay kit were used to determine sVNT titers with RBD neutralizing antibody (for wild-type virus). Reagent 0 (antigen of magnetic particle ACE2 receptor), reagent 1 (S protein RBD labeled with alkaline phosphatase), calibrators, and other auxiliary reagents were included in the test kit. If the final titer readout was larger than 30, repeat the experiment to dilute the sample 10 times because the instrument has a test titer upper limit of 30. If the reading stays over 30, the sample was diluted twice further (for a total dilution of 20). The final titer readout in AU/ml units is inversely proportional to the sample's concentration of SARS-CoV-2 neutralizing antibodies. Titer levels higher than 2 AU/ml are positive (manufacturer-designed threshold).
2.5 Mass cytometry
Frozen PBMCs from six volunteers were thawed and resuspended in complete media to create a single-cell suspension. We collected samples from each subject twice, baseline (Group A) and a month after the second dose (Group B) injection.
Before the CyTOF experiment, the PBMCs were evaluated for cell count and quality (count >1 million, living cells >70%). The resuscitated PBMC samples were suspended in FASC buffer (1× PBS + 0.5% BSA), and viability staining was used with 250 nM 194Pt cisplatin (Fluidigm). Fc-receptor blocking solution (BioLegend) was used to block cells. Cells were immobilized and permeated using insertion solution (Fluidigm) and stained for intracellular markers for 30 min on ice. The cells were resuspended in deionized water with 20% EQ beads (Fluidigm) and filtered into a tube with a filter cap.
Cells were labeled using the maxpar antibody labeling kit (Fluidigm) with different metal isotopes chelating proteins and covalently attached to the corresponding antibodies (Supporting Information: S3). Subsequently, the cells are imported into the nebulizer in the form of a single-cell suspension, through which ion clouds are generated, separated in TOF by mass to charge ratio.
FCS files that contain the cell surface or intracellular signal data collected from the CyTOF2 (Fluidigm) instrument (CyTOF experiment data was acquired by Zhejiang Puluoting Health Tech Co., Ltd.), and then they were pre-processed by FlowJo V10 (Tree Star Inc.) through the following three steps: beads normalization, debarcoding, and manual gating. DNA gating, single-cell gating (excluded cell fragments, dead cells, adherents, nontarget cells.), and cell subgroup division were achieved (Supporting Information: S4). After processing data based on the above steps, the corresponding cell subsets types and expression of cell surface markers were analyzed.
2.6 Statistical analysis and data processing
The phenograph algorithm for dimensionality reduction was conducted based on all arcsinh-transformed data for manual gating of interesting populations. Clustering data was performed using the TSNE algorithm, and a hierarchical heatmap was used for data visualization.
Antibody geometric mean titers (GMTs) were determined using the geometric mean of the titer level, and their 95% confidence intervals (CIs) were calculated using the Student's t-distribution on log-transformed data, followed by reverse conversion. MATLAB® R2021a was used to create all calculations and visualizations.
3 RESULTS
3.1 Humoral immunology
Before month 0.5 of booster injection, most antibody titer results have been described in detail in our previous work published.10 The specific antibody (SARS-CoV-2-IgA/IgM/IgG) and neutralizing antibodies (sVNT) titer levels of each monitoring point in the immunization process detected by chemiluminescence immunoassay (the two enhanced monitoring points are merged) are shown in Supplementary S1 with updated results, with the latest time point at Month 6 Post-Boost. Figure 1 shows the specific antibody (SARS-CoV-2-IgA/IgM/IgG) and neutralizing antibodies (sVNT) titer levels fold change after the second dose and booster dose compared to the titer levels before the injection. The titer levels peaked and declined over time following each injection. After the booster doses, all titer levels increased, with SARS-CoV-2-IgG and sVNT increasing most prominently. As long as 6 months following each injection, the two antibody levels remain above the pre-injection level, indicating long-lasting immune memory.
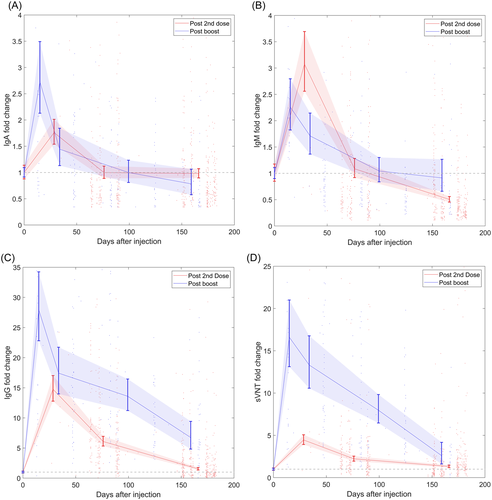
The antibody titer levels for SARS-CoV-2-IgG and sVNT were higher than SARS-CoV-2-IgA and -IgM at all time points. For SARS-CoV-2-IgM/IgG and sVNT, the titer levels showed an increasing trend after the first injection, increased further after the second injection, and reached the first peak at Month 2 before decreasing slowly over time. The GMT of SARS-CoV-2-IgA, on the other hand, remained below the positive threshold of 1 AU/ml at all time points.
The level distributions of antibody titers amongst the tested population are shown in the violin plots in Supporting Information: S2, updated with the latest results. During the vaccination process, the level of SARS-CoV-2-IgA/IgM remained constantly low compared to other antibodies. SARS-CoV-2-IgA GMT stayed below the positive threshold at all stages. After the second injection, SARS-CoV-2-IgM, SARS-CoV-2-IgG, and neutralizing antibodies (sVNT) gradually diminished after reaching the peak levels until the booster injection activated the anamnestic immunity.
The booster dose mildly stimulated SARS-CoV-2-IgA and -IgM to a height of 0.40 and 0.50 respectively at Month 0.5 post-boost, before declining to 0.11 and 0.20 at Month 6 post-boost. Interestingly but unsurprisingly, the post-booster SARS-CoV-2-IgM GMT stayed lower than after the second dose and was similar to the first month after the injection.
Although the SARS-CoV-2-IgG and neutralizing antibodies (sVNT) began to decrease after Month 2 of injection, antibody levels have maintained above the positive threshold. The peak titer levels of SARS-CoV-2-IgG and sVNT GMT post-booster are 39.25 and 38.34, respectively, slowly decreasing to 9.47 and 6.01 at Month 6 post-booster, accounting for 24.1% and 15.7% of the peak value.
3.2 Mass cytometry
We selected the cell samples of six healthy participants (aged 31–47 [median: 40.5], 1 man, 5 women) from 360 healthy participants for resuscitation. Among them, the cell samples selected for resuscitation were obtained from the six healthy participants before vaccination (Group A) and a month after the second dose (Group B). The cells after resuscitation were counted to detect their cell viability. The results showed that the average number of living cells in healthy participants before vaccination (Group A) was 1.315 × 10⁶/ml with an average cell viability rate of 72.60%, while the average number of living cells in Group B was 1.535 × 10⁶/ml with an average cell viability rate of 71.10%.
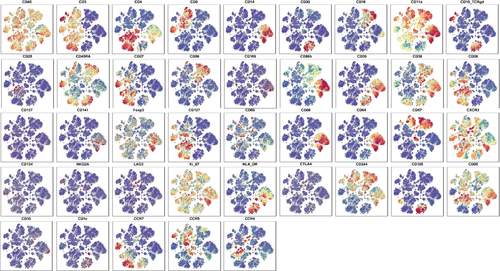
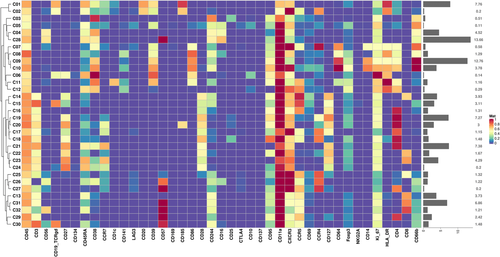
The phenotype and subgroup distribution of the immune cells from PBMC samples were analyzed by flow mass spectrometry and clustering algorithm. We selected 41 cell surface markers to identify cell lineages (Figure 2). The spatial distribution results of these 41 markers in Groups A and B cell clusters showed that the markers with significant differences in population separation were CD45, CD3, CD11a, CXCR3, Ki-67, and CD95, respectively. Different cell surface markers were expressed in the six main cell lineages as follows: CD45, CD3, CD4, CD27, CD28, CD127, CD95, CD11a, CXCR3, and Ki-67 were highly expressed in the CD4 T cell lineage, and CD45R, CD38, CCR4, and CCR7 were sparingly expressed. CD45, CD3, CD8, CD27, CD45R, CD244, CD95, CD11a CXCR3, and Ki-67 were highly expressed in CD8 T cell lineage, and CD28, CD127, CD57, CCR4, CCR5 were sparingly expressed. Highly expressed markers in B cell lineage were CD45, CD20, CD19-TCRgd, CD45R, CD39, CXCR3, Ki-67, HLA-DR, CD11a, CD185, and sparingly expressed markers were CD4, CD38. CD45, CD3, CD19-TCRgd, CD95, CD11a, CXCR3, and Ki-67 were highly expressed in the gdTCR cell lineage. In the monocyte lineage, high expression markers were CD45, CD4, CD14, CD45R, CD66b, CD39, CD38, CD86, CD64, HLA-Dr, CD244, CD95, CD11a, CXCR3, Ki-67, and low expression markers were Foxp3. NK cell lineage has high expression in CD45, CD16, CD45R, CD56, CD38, CD57, CD244, CD95, CD11a, CXCR3, and Ki-67, and low expression in CD66b (Figure 2).
We confirmed and used B cells, CD4 T cells, CD8 T cells, NK cells, DC cells, gdPCR cells, and monocytes for the basis of analysis. The results showed that the differences in the spatial distribution of cells between Groups A and B were mainly reflected in NK cells, monocytes, B cells, CD8+ T cells, and CD4+ T cells, while there were no significant differences among gdPCR lineage (Figure 3A). We further performed analysis on 32 cell clusters (C01–C32) obtained by screening and visualizing them as a heatmap. According to the depth of color, we can understand the different expression levels of different cell surface markers in each cell cluster (Figure 4).
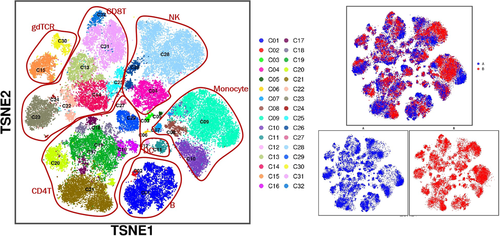
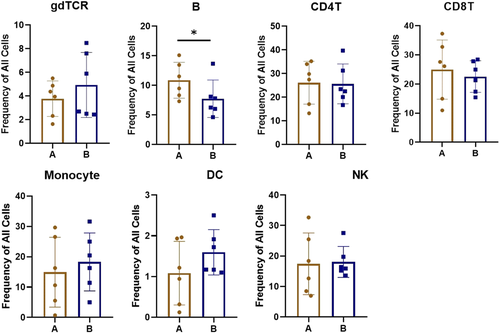
Further observation showed that the five lineages mentioned above with spatial differences in cell clusters between Groups A and B were as follows: C28 cells in NK cell lineage, C09 cells in monocyte lineage, C01 cells in B cell lineage, C20, C21, and C29 cells in CD4 T cell lineage, C13, C14, C23, and C31 cells in CD8 T cell lineage, respectively. Comparing cell subsets between Groups A and B with manual gating based on CD45+ T cell, the concentration of B cells was more significantly changed, with a significant decrease in Group B compared to Group A (p < 0.05) and less or no significant differences observed in the total spectrum of other cell subsets (Figure 5).
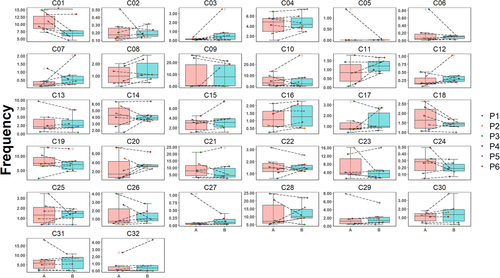
In addition, manual gating was performed based on CD45+ T cells (immune cells) and CD3+ cells (T cells). Thus, 32 cell clusters (C01–C32, manual gating by CD45+ T cells) and 29 cell clusters (C01–C29, manual gating by CD3+ cells) were obtained, respectively. We analyzed the distribution of 32 cell clusters, and the results showed that the change in the C01 cell population was the most obvious between Groups A and B (Figure 6), and Group B was significantly lower than Group A (p < 0.05), while according to the cell subgroup division, C01 belongs to the subgroup related to B cells.
The results of immune cells analysis manual-gating based on the CD3+ T cells showed that the spatial distribution of the cell subsets and the possible changes in the immune profiles between Groups A and B were insignificant (Supporting Information: S5, S6, S7).
4 DISCUSSION
With the global prevalence of COVID-19 and the constant emergence of viral variants, booster injection of the COVID-19 vaccine may effectively reduce infection rates. As of April 24, 2022, 23.1% of the global population had completed booster vaccination, while 50.7% of the national population had completed booster vaccination in China.11 A multicountry trial assessment on BBIBP indicated a vaccine efficacy of 78.7% in preventing hospitalization.12 Given the limitations of current studies on antibody potency produced by inactivated virus booster injection, 360 healthy adults who completed inactivated virus booster injection were recruited in a multicenter collaboration, and their antibody potency was detected and analyzed at multiple time points. We monitored humoral immunity throughout the vaccination process using virus-specific antibodies (SARS-COV-2-IgA/IgM/IgG), virus neutralization tests, cell subsets, and surface markers analysis before and after vaccination CyTOF method. Our previous results described in detail10 have proved that SARS-CoV-2-IgG and neutralizing antibodies (sVNT) had similar trends in title changes. While in the present study, the variation trend was also highly consistent, and the titer levels of the two were still at a high peak 30 days after receiving booster injection, suggesting that booster inactivated vaccine can effectively stimulate the response of memory antibodies in humoral immunity. However, the titer levels of SARS-COV-2-IgM and SARS-CoV-2-IgA did not increase significantly after injection of inactivated vaccine with the booster. After the first injection, the increased amplitude was slower than the corresponding antibody titers. It is speculated that SARS-COV-2-IgM and SARS-CoV-2-IgA may not play a major role in activating memory immunity.
CyTOF results showed that the concentration of B cells in blood was significantly decreased after receiving an inactivated vaccine with a booster dose compared with before vaccine injection. Although the spatial distribution and expression levels of individual cell subsets (such as C01 cell cluster) and cell surface markers involved in immune response showed certain changes, the distribution of results was affected by individual differences due to the quantity limit of samples detected.
The dynamic changes in antibody levels after vaccination are essential for monitoring population immunity and preventing virus infection. In continuous monitoring of antibodies, we found that the changing trend of SARS-CoV-2-IgG and neutralizing antibodies (sVNT) with time was very similar. The trajectory of antibody changes in healthy populations showed that SARS-CoV-2-IgG and sVNT reached the first peak level at Month 2 after injection of the inactivated vaccine and then gradually weakened over time until the memory immunity was activated by booster injection. The changes in antibody levels after the first two injections of inactivated vaccine were consistent with previous studies on inactivated vaccine.5, 8, 9 Similar results have been shown in two studies with Pfizer's BNT162b2 mRNA COVID-19 vaccine13, 14: the titer level of neutralizing and SARS-CoV-2-IgG was significantly upregulated after vaccination, and Lustig et al.14 also found a high correlation between the titers of SARS-CoV-2-IgG and neutralizing antibodies. Due to concerns about decreased immunity and new variants, booster injections have been widely used. Data for this part of the study remained scarce for antibody trends after injection, and it is still uncertain whether high circulating antibody levels last long enough to avoid further infection. Therefore, we added a longer period of monitoring of antibody levels post-booster.
Interestingly, we found that SARS-CoV-2-IgG and sVNT titer levels peaked at Month 0.5 after the boost injection, higher than the peak reached after the second injection, and did not decrease significantly over time. According to a report,15 persistent specific SARS-CoV-2-IgG and sVNT for up to 2 years after SARS-CoV infection. We speculate that this may be related to long-lived plasma cells. Primary and secondary immune responses in the spleen produce independent long-lived plasma cell pools in the bone marrow that migrate to important survival niches and can persist throughout the hosts' lifetime without the need for self-replenishment or turnover, resulting in persistent antigen-specific antibody titers. The memory B cell bank is not required to maintain the bone marrow plasma-cell bank, but when depleted, the plasma cells will be supplied from the memory bank.16-18
Following vaccination, the SARS-CoV-2-IgM and SARS-CoV-2-IgA directed against the SARS-CoV-2 RBD decreased rapidly, indicating a short lifetime of both isotypes.14 Furthermore, SARS-CoV-2-IgM peaks and a rapid and strong SARS-CoV-2-IgG response may indicate that the S protein utilized in the vaccine is highly immunogenic.14 SARS-CoV-2 infected the upper respiratory tract mucosa first during the afflicted population's viral infection period, and the major infected sites underwent long-term high-level stimulation, inducing a significant mucosal immune response. Dimerized IgA antibodies (found primarily in mucosal tissues) were a more efficient neutralizing agent for SARS-CoV-2,19 as seen by the afflicted population's elevated SARS-CoV-2-IgA titer levels.20 Within 1 week of infection diagnosis, the positive rate of specific SARS-CoV-2-IgA in COVID-19 infection can reach more than 50%.21, 22 However, at all vaccination phases, SARS-CoV-2-IgA GMT in a healthy population was significantly below the positive threshold, suggesting that the vaccine did not stimulate mucosal immunity.20, 23
B cells are produced from hematopoietic stem cells and can develop into either common lymphoid progenitor cells or pluripotent progenitor cells in the bone marrow. T cells, natural killer cells, and B cells can be produced by lymphoid progenitor cells. In humoral immunity induced by vaccination, B cells are activated by antigens and lymphocytes secreted by T cells. B cells were stimulated by antigen and differentiated into memory B cells and plasma cells. Germinal centers are microenvironments for affinity maturation of humoral immune responses and mature into a typical structure in the second week after immunization. The selective differentiation of high-affinity memory B cells and plasma cells is based on migrating some B cells to germinal centers after T-cell-dependent activation,24, 25 which is evident in our CyTOF data showing that the inactivated vaccine can stimulate humoral immunity in humans, and this change is reflected in the significant decrease of humoral B cell levels in people vaccinated with the inactivated vaccine. In addition, compared to the second injection, the humoral immunity effect decreased less after the booster injection for 6 months, indicating that the body can maintain a high concentration of SARS-CoV-2-IgG neutralizing antibody for a long time, and BBIBP-CorV provides effective protection against virus invasion.5 However, we observed no significant changes in the remaining immune cells, except for a significant change in the content of B cells in the blood. In general, adaptive immunity to viral infection is dominated by Th1-type-driven cellular immune responses. The direction of T cell response is determined by the cytokine microenvironment produced by antigen-presenting cells, as helper T cells coordinate the overall adaptive response and cytotoxic T cells kill virus-infected cells. The stimulation of the particular Th1/Th17 pathway, on the other hand, may exacerbate the inflammatory response.26
A recent retrospective analysis of the BBIBP-CorV vaccine found that when compared to the vaccine-naïve group, completely vaccinated persons were 80% and 97% effective in avoiding hospitalization and mortality, respectively.27 According to another study,28 the vaccine's efficacy for hospitalization and serious diseases was 74% and 62%, respectively, 14–20 days after the first dose. These findings suggest that a high concentration of SARS-CoV-2-IgG is effective against COVID-19 infection, severe disease, or comorbidities in the short term. Nonetheless, an extended antibody titer follow-up of more than 2 years in the same cohort is required to determine whether humoral immunity fades over time.15
There are several limitations of this study. First, we have only investigated one type of inactivated vaccine. Second, the sVNT experiments were performed only for the original wild-type viral epitopes. Further, the number of subjects (six before and after vaccination) for CyTOF experiments was relatively small due to budget limitations. Lastly, the true protection efficacy of the vaccines can only become clear using real-world infection data, and any lab-based neutralization experiments can only shed light on the antiviral capability of the vaccines.
5 CONCLUSION
Our study has found that the SARS-CoV-2 inactivated vaccine BBIBP-CorV has a protective effect in healthy adults, allowing humans to maintain a long-term and effective humoral immunity after vaccination. The humoral immune response was induced after the first two vaccine injections and reached the first peak 2 months after the first injection, and then gradually decreased over time until the booster dose significantly induced anamnestic immunity, and the antibody levels reached the second peak. The neutralizing antibody levels subsequently dropped over 6 months after the booster, but its levels remain well above the level before the booster dose. CyTOF data has provided evidence for the active production of antibodies and the change in the immunity environment, based on the decrease in the number of B cells and the change in the spectral distribution of immune cells after vaccination.
AUTHOR CONTRIBUTIONS
All authors contributed significantly to this study. Their contributions include conventionalization, study design, participant blood acquisition, experimentation, analysis, and interpretation. The first authors wrote the article. Senior authors reviewed the manuscript. All authors agree to submit the manuscript and be accountable for all aspects of the work.
ACKNOWLEDGMENTS
The authors would like to thank Zhejiang Puluoting Health Tech Co., Ltd. for their technical support. This study was supported by Zhongnanshan Medical Foundation of Guangdong Province (ZNSA-2021005, ZNSA-2020001, and ZNSA-2021016), Guangzhou Institute of Respiratory Health Open Project (Funds provided by China Evergrande Group; 2020GIRHHMS04), State Key Laboratory of Respiratory Disease, Guangdong-Hong Kong-Macao Joint Laboratory of Respiratory Infectious Disease (GHMJLRID-Z-202102), the Emergency key project of Guangzhou Laboratory (EKPG21-30-2), and Cultivation Project of the First Affiliated Hospital of Guangzhou Medical University (ZH202105).
CONFLICT OF INTEREST
The authors declare no conflicts of interest.
Open Research
DATA AVAILABILITY STATEMENT
The data used in this study will be available upon request.


