Efficacy and safety of single-dose antiviral drugs for influenza treatment: A systematic review and network meta-analysis
Yonghong Zhao and Guangliang Huang contributed equally to this study, therefore, should be considered equivalent.
Abstract
To conduct network meta-analysis (NMA) of clinical efficacy and safety of single-dose antiviral drugs, grouped by dosage, in treatment of influenza. Systematic retrievals were conducted in databases, including Pubmed, Embase, Web of Science, the Cochrane Register of Clinical Trials and from the website ClinicalTrials.gov, for clinical trials recorded between the interception of the databases and March 31, 2021. Randomized controlled trials (RCTs) of influenza treatment in which single-dose antiviral drugs were administered were selected according to preset inclusion and exclusion criteria by two researchers who screened the literature independently from each other. The quality of the included studies was assessed using the Cochrane bias risk assessment tool. Software such as Stata 16.0 and Review Manager 5.3 was adopted for statistical analysis. Pairwise meta-analysis and NMA were carried out under the random-effects model. For both binary and continuous variables, odds ratio (OR), mean difference (MD) and their 95% confidence intervals (CI) were used to rank treatment efficiencies and analyze the differences. A total of 12 RCTs involving 7296 participants were included in the analysis. According to the NMA results, peramivir 300 mg (MD = −17.68, 95% CI: [−34.05, −1.32]), peramivir 600 mg (MD = −16.15, 95% CI: [−29.35, −2.95]), baloxavir (MD = −14.67, 95% CI: [−26.75, −2.58]) and laninamivir 40 mg (MD = −12.42, 95% CI: [−22.53, −2.31]) remarkably outperformed laninamivir 20 mg in time to alleviation of symptoms (TTAS). However, no intervention statistically outperform others in antipyretic time, virus titer variations against the baseline 24 and 48 h after medication and adverse events (AEs). The efficacy rankings were: peramivir 300 mg (the surface under the cumulative ranking curve [SUCRA] = 80.3%) > peramivir 600 mg (SUCRA = 76.2%) > baloxavir (SUCRA = 68.4%) > laninamivir 40 mg (SUCRA = 55.0%) > laninamivir 20 mg (SUCRA = 16.6%) for TTAS; baloxavir (SUCRA = 76.3%) > peramivir 600 mg (SUCRA = 67.8%) > laninamivir 40 mg (SUCRA = 47.2%) > laninamivir 20 mg (SUCRA = 40.0%) for antipyretic time; baloxavir (SUCRA = 96.7%) > peramivir 300 mg (SUCRA = 64.5%) ≈ peramivir 600 mg (SUCRA = 63.2%), baloxavir (SUCRA = 93.2%) > peramivir 600 mg (SUCRA = 64.0%) ≈ peramivir 300 mg (SUCRA = 55.0%), for virus titer variations against the baseline 24 and 48 h after medication, respectively; and baloxavir (SUCRA = 83.4%) > peramivir 300 mg (SUCRA = 71.4%) > laninamivir 20 mg (SUCRA = 62.4%) > peramivir 600 mg (SUCRA = 56.2%) > laninamivir 40 mg (SUCRA = 36.8%) for adverse events. Among the single-dose anti-influenza virus drugs compared, peramivir is superior to baloxavir and laninamivir in TTAS, whereas baloxavir has the best efficacy in antipyretic time, virus titer variations against the baseline 24 and 48 h after medication and AEs. This study has been registered in the International Prospective Register of Systematic Reviews (PROSPERO), with a registration number of CRD42021238220.
1 INTRODUCTION
Influenza, also known as flu for short, is a seasonal acute respiratory viral infectious disease that breaks out and spreads worldwide every year.1, 2 The symptoms usually resemble those caused by other respiratory viruses common in moderate climate regions, including fever, chills, cough, headache, sore throat, fatigue, anorexia, running nose, nasal obstruction, and muscle or body pain.2 Most influenza patients have comparatively mild symptoms and can recover within two weeks without any medical care. For a small number of patients, however, influenza can cause them to suffer from various complications, some life-threatening, that require hospitalization. According to a study published in the Lancet at the beginning of 2018, the annual global mortality from influenza-related respiratory diseases is 290,000–650,000.3
Patients' compliance with physicians' treatment plans and pharmacists' instructions is called medication compliance.4, 5 The most common consequences of medication noncompliance is impediment of recovery, or even aggravation of the diseases; at the population level, this might result in major public health problems and the associated economic burdens for the patients, their families, and the entire society.6, 7 There is a wide range of reasons for patients' poor medication compliance; for example, drug prices and other economic factors, obstacles in doctor–patient relationships,8, 9 patients negligence about taking the prescribed medication, discontinuation of treatment or alternation of the dosing by patients without communication with health care providers. Compared with multiple daily medication, treatments requiring a single daily dose are easier to manage and may contribute to a reduction of medication costs and adverse effects of dosing errors. Single-dose treatments may substantially improve patients' medication compliance, especially for those vulnerable to medication difficulties, such as the elderly and children, patients with mental illnesses or hypomnesia patients. Currently, there are mainly three antiviral drugs on the global market that can be administered in single-dose albeit through different routes: laninamivir (inhalation administration), peramivir (intravenous infusion), and baloxavir (oral administration). This study analyzes only the antiviral drugs that can be administered in a single dose and categorizes them into different groups based on different drug formula and dosage (peramivir 300 mg, peramivir 600 mg, laninamivir 40 mg, laninamivir 20 mg and baloxavir). Using a network meta-analysis (NMA), the treatment measures are ranked for their advantages and disadvantages in line with their efficacy and safety to provide a comprehensive and reliable evidence-based medical guidance for clinical medication.
2 MATERIALS AND METHODS
This study has been registered in the International Prospective Register of Systematic Reviews (PROSPERO) (website: https://www.crd.york.ac.uk/prospero/ registration number: CRD42021238220). The report is drafted based on preferred reporting items for a systematic review and meta-analysis (PRISMA). The software used in this study includes EndNote X8 (literature management and writing) (Thomson ResearchSoft), Excel 2019 (data extraction and reorganization) (Microsoft Office), Review Manager 5.3 (methodology quality assessment and pairwise meta-analysis) (The Cochrane Collaboration, Copenhagen) and Stata 16.0 (NMA, heterogeneity assessment, inconsistency test, and the surface under the cumulative ranking curve [SUCRA] plot) (Stata Corporation).
2.1 Inclusion and exclusion criteria and retrieval strategies
The inclusion and exclusion criteria were formulated according to the PICOS scheme. The primary and secondary outcomes were determined by the research team based on the study objectives. Primary outcome measures refer to those that best represent clinical significance and are the most indicative of the study question. For example, the main objective of this study is to explore the overall clinical efficacy and safety of three single-dose antiviral drugs (peramivir, baloxavir, and laninamivir) in the treatment of influenza. Time to alleviation of symptoms (TTAS) is defined as the time from the beginning of treatment to the assessment of influenza-related symptoms, including the time for defervescence in secondary outcome measures. In the original studies included in the meta-analysis, the number of studies with TTAS as a primary outcome indicator represented a majority. In terms of safety, adverse events (AEs) could assess the overall incidence of adverse events, and the number of studies that were also the primary outcome indicators accounted for the largest proportion in terms of safety, which was quite representative, so the total TTAS and AEs were set as primary outcome indicators. Secondary outcome indicators were generally set for two purposes. One was to support the primary outcomes. For example, the change in the antipyretic time and the baseline of the 24 and 48 h viral titers in the secondary outcome indicators provided quantitative measures of the effect of these three single-dose antiviral drugs on TTAS, and thus offered an improved understanding of their efficacy. Another purpose of setting secondary outcomes was to answer secondary research questions. Clinical trials are expensive, and researchers strive to get as much information as possible, answer as many questions as possible, or provide clues for further research in a study. This often yields some additional measurements (Table 1).
| PICOS | Inclusion criteria | Exclusion criteria |
|---|---|---|
| Patient population (P) |
|
|
| Interventions (I) | Peramivir 300 mg i.v. infusion | Studies using drug combination (excluding antipyretics and antitussives) or treatments in combination with other concurrent therapies. |
| Peramivir 600 mg i.v. infusion | ||
| Laninamivir 40 mg inhalation | ||
| Laninamivir 20 mg inhalation | ||
| Baloxavir p.o. | ||
| Comparison (C) | Comparison with placebo or any other anti-influenza virus drug medication. | |
| Outcome indicators (O) | Efficacy indicators: |
|
|
||
| AEs | ||
| Among all the outcome indicators listed, TTAS and AEs are used as primary and the remaining ones as secondary indicators. | ||
| Study design (S) | Randomized controlled trial |
|
- Abbreviations: AE, adverse event; TTAS, time to alleviation of symptoms.
Oseltamivir and placebo that are repeatedly administered are only applied in the construction of the network and are excluded from the analysis.
Databases, including Pubmed, Embase, Web of Science and the Cochrane Register of Clinical Trials, and our retrieval of completed but yet unpublished clinical trials on ClinicalTrials.gov were searched for the data. What we retrieved were clinical trials recorded between the interception of the databases and March 31, 2021. Both subject terms and free terms were used in the search, with the search terms covering: Peramivir, BCX-1812, RWJ 270201, Rapivab, Laninamivir, R 125489, Neuraminidase inhibitor, Baloxavir, Xofluza, Endonuclease inhibitor, Influenza, Flu and Human. In PubMed, for instance, the specified retrieval strategies was as follows:
-
#1 Peramivir[Title/Abstract] OR BCX-1812[Title/Abstract] OR RWJ 270201[Title/Abstract] OR Rapivab[Title/Abstract] OR Laninamivir[Title/Abstract] OR R 125489[Title/Abstract] OR Neuraminidase inhibitor[Title/Abstract] OR Baloxavir[Title/Abstract] OR Xofluza[Title/Abstract] OR Endonuclease inhibitor[Title/Abstract]
-
#2 Influenza OR Flu OR "Influenza, Human"[Mesh]
-
#3 #1 AND #2.
2.2 Literature screening and data extraction
Literature retrieved in line with the retrieval strategies above was exported into software EndNote X8, the automatic similarity identification function of which was applied to restrict the titles, authors, and publication years for a brief similarity identification. Based on the inclusion and exclusion criteria, two researchers initially screened the literature independently from each other by thumbing through the titles and abstracts to exclude those that did not meet the inclusion and exclusion criteria and record the underlying reasons. The “his” retained after the initial screening were further examined by thoroughly reading the full text to exclude those that turned out to not meet the inclusion or fall under our exclusion criteria, with the exclusion reasons recorded. Subsequently, the two researchers cross-checked the literature included and jointly decided whether each item should be included or not. If there were any disagreements, a third researcher would be consulted for final decisions. Excel 2019, used for literature management and data extraction, was applied to extract important information about the patient population, intervention measures, course of disease, and outcome indicators, into a data extraction table prepared in advance. Information derived from ClinicalTrials.gov was screened and sorted using the same methodology and criteria.
2.3 Quality assessment of methodology
Two researchers assessed independently from each other the quality of the methodologies used in each selected study. A third researcher would be consulted for discussions and resolutions in the case of different opinions. The quality of each study was assessed according to the quality evaluation standard provided by the Cochrane Collaboration,10 which involves the following seven aspects: random sequence generation, allocation concealment, blinding of participants and personnel, blinding of outcome assessment, incomplete outcome data, selective reporting and other sources of potential bias. Ultimately, the quality of each study was ranked as “low risk,” “high risk” or “unclear.”
2.4 Statistical methods
2.4.1 Pairwise meta-analysis
The random-effects model was adapted for pairwise meta-analysis,11 with the evaluation indicators categorized into either binary or continuous variables. For binary variables (AEs in this study), odds ratio (OR) and their 95% confidence intervals (CIs) were used in the effect analysis statistics. For continuous variables (TTAS, antipyretic time and virus titer variations against the baseline), mean difference (MD) and their 95% CIs were calculated to evaluate the combined effect size. The magnitude of heterogeneity was judged by calculating I2 statistics, with 50% of the value of I2 as the limit to decide whether the heterogeneity between different studies was significant.12
2.4.2 Network meta analysis
NMA was conducted using the random-effects model within the framework of frequency science.13 The results for binary and continuous variables were expressed as the values of OR and MD and their 95% CIs, respectively. The global inconsistency model14 was used to assess the consistency of the entire network, which would be considered sound when p > 0.05. The degree of consistency of each closed-loop in NMA was evaluated via the loop-specific approach.15 A merge of data between two evidence sources (for direct and indirect comparisons) would be implemented if the information in the two sources was sufficiently similar. The inconsistency factors (IFs) and their 95% CIs were calculated to specifically identify the consistency of each closed-loop, which would be considered satisfactory if the lower limit of their 95% CIs contained 0.16 The node-splitting method17 was also used to assess inconsistencies of the model. Satisfactory consistency would be indicated by p > 0.05 between each node and would be required for a data merge. In addition, a predictive interval plot18 was drawn for heterogeneity analysis, providing the 95% CIs under the fixed-effects model and the random-effects model. No obvious heterogeneity between the two would be recognized if both results turned positive or negative. The SUCRA19 was applied to rank all indicators of each intervention, with larger SUCRA indicating a higher ranking as well as better efficacy of that intervention. With a comparison-adjusted funnel plot,20 the potential publication bias in outcomes of small and large-scaled studies (the number of studies ≥10 as usually required) was assessed. This was done by calculating the difference between the effect size of a certain pairwise comparison in each study and the combined effect size of all the similar comparisons, and subsequently regressing the calculated value based on standard error (SE) of effect size. In this manner, a concise linear regression curve was constructed in the funnel plot to help us explore the extent of bias in the results more intuitively.
3 RESULTS
3.1 Study selection and basic characteristics
A total of 6724 studies have been retrieved, of which 12 were RCTs21-32 (including 13 records, which means 13 interventions were included in the 12 RCTs) with a total of 7296 participants. Literature retrieval and screening procedures are summarized in Figure 1. NMA was performed on 10 of the 12 RCTs. The remaining two studies, due to their small sample size and large heterogeneity, were not included in the pooled data and were only subjected to a systematic review. Among the 12 RCTs, nine (all including 10 records) are studies from the databases, and the remaining three are unpublished clinical trials derived from ClinicalTrials.gov. All the included studies were published between 2010 and 2021. Of the 12 studies, there are nine multicenter trials (including 10 records), eight parallel double-blind RCTs (including nine records), five three-arm trials and seven double-arm trials (including eight records); seven studies (including eight records) focus on healthy influenza patients without underlying diseases while the other five studies on high-risk influenza patients; three studies solely concentrate on children and seven studies on adults. Information about the course of influenza covers at least 48 h. The basic characteristics of the studies are shown in Table 2.

| Publication | Interventions | Size | Age (mean ± SD or range, years) | Duration of illness (mean ± SD or range, h) | Condition | Outcomes |
|---|---|---|---|---|---|---|
| Hayden, 201821 | Baloxavir | 456 | 33.5 ± 13.5 | ≤48 | Otherwise healthy patients with influenza (adults and adolescents) | (1), (2), (3), and (4) |
| Placebo | 231 | 33.9 ± 13.7 | ≤48 | |||
| Oseltamivir | 377 | 36.0 ± 11.8 | ≤48 | |||
| Baker, 202022 | Baloxavir | 115 | 6.1 ± 2.90 | ≤48 | Otherwise healthy pediatric patients with influenza (only pediatric patients) | (1), (2), (3), and (4) |
| Oseltamivir | 58 | 6.02 ± 3.20 | ≤48 | |||
| Ison, 202023 | Baloxavir | 388 | 52.3 ± 16.8 | ≤48 | High-risk influenza patients over the age of 12 (adults and adolescents) | (1), (2), (3), and (4) |
| Placebo | 386 | 51.9 ± 16.7 | ≤48 | |||
| Oseltamivir | 389 | 51.1 ± 17.0 | ≤48 | |||
| Kato, 202024 | Peramivir 600 mg | 70 | <65 years: 72.86% | ≤48 | Influenza patients aged 16-79 years with pre-existing chronic respiratory disease (only adults) | (3) |
| Peramivir 300 mg | 67 | <65 years: 80.60% | ≤48 | |||
| Oseltamivir | 72 | <65 years: 77.78% | ≤48 | |||
| Nakamura, 201725 | Peramivir 600 mg | 46 | 72.2 ± 14.1 | 28.2 ± 16.1 | High-risk adult patients (only adults) | (1), (2), and (4) |
| Oseltamivir | 46 | 70.1 ± 11.1 | 25.8 ± 12.9 | |||
| Sugaya, 201026 | Laninamivir 40 mg | 61 | 6.8 ± 1.4 | 18.19 ± 7.74 | Influenza patients under the age of 9 (only pediatric patients) | (1), (2), and (4) |
| Laninamivir20 mg | 61 | 6.9 ± 1.5 | 18.19 ± 8.13 | |||
| Oseltamivir | 62 | 6.7 ± 1.5 | 19.09 ± 8.50 | |||
| Watanabe, 201027 | Laninamivir40 mg | 334 | 34.9 ± 11.5 | 23.5 ± 8.27 | Adult influenza patients (only adults) | (1), (2), and (4) |
| Laninamivir 20 mg | 326 | 35.6 ± 11.7 | 24.01 ± 7.89 | |||
| Oseltamivir | 336 | 34.7 ± 11.3 | 24.25 ± 8.28 | |||
| Kohno, 201128 | Peramivir 300 mg | 364 | 34.9 ± 11.7 | ≤48 | Adult influenza patients (only adults) | (1), (3), and (4) |
| Peramivir 600 mg | 362 | 35.9 ± 12.0 | ≤48 | |||
| Oseltamivir | 365 | 34.6 ± 11.7 | ≤48 | |||
| Watanabe, 201329 | Laninamivir 40 mg | 101 | 42.7 ± 13.9 | 22.86 ± 7.57 | Influenza in patients with chronic respiratory diseases (only adults) | (1), (2), and (4) |
| Oseltamivir | 100 | 40.4 ± 11.1 | 22.60 ± 8.80 | |||
| NCT0070540630 | Placebo | 203 | 35 ± 11.3 | ≤36 | Acute, uncomplicated human influenza (only adults) | (1), (2), and (4) |
| Peramivir 600 mg | 202 | 35 ± 12.1 | ≤36 | |||
| NCT0260939931 | Oseltamivir | 84 | 20–78 | NA | High-risk emergency department patients with influenza (only adults) | (4) |
| Peramivir 300 mg | 95 | 19–80 | NA | |||
| NCT0236915932 | Peramivir 600 mg | 114 | 8.0 ± 5.07 | NA | Pediatric subjects with uncomplicated influenza (only pediatric patients) | (1), (2), (3), and (4) |
| Oseltamivir | 23 | 9.9 ± 4.99 | NA |
- Note: (1) TTAS, (2) antipyretic time, (3) virus titer variations against the baseline, and (4) AEs.
- Abbreviations: NA, unreported; SD, standard deviation.
3.2 Quality assessment
All RCTs have reported the methods for random sequence generation and adopted the parallel-grouping or double-blind double-simulation allocation plan, with complete outcome data, as well as outcome indicators that are not selectively reported. Eight studies (67%) have blinded the researchers, participants, and outcome assessors, and three studies (25%) were open trials. All studies were funded by commercial entities. The risks of bias in the included studies were generally low (Figure 2).

3.3 Primary outcomes
3.3.1 Pairwise meta-analysis for TTAS
Figure 3 presents the effects of five single-dose interventions (peramivir 300 mg, peramivir 600 mg, laninamivir 40 mg, laninamivir 20 mg, and baloxavir) on TTAS. The I2 test was conducted to evaluate the magnitude of heterogeneity between studies,12 and the random-effects model was used for meta-analysis. I2 values were 76% and 83% for the comparisons between peramivir 600 mg versus oseltamivir and laninamivir 20 mg versus oseltamivir, respectively (Figure 3A). The analysis revealed relatively high heterogeneity between two studies, the one by Sugaya, 2010 and NCT02369159, both of which were subsequently excluded from the meta-analysis and were only subjected to descriptive analysis. Descriptive analysis refers to the preliminary collation and induction of the collected data with the purpose to understand the overall characteristics of things, generally including the analysis of means, medians, modes, rates, variance, and standard deviations. The systematic review refers to a new method of literature synthesis that systematically and comprehensively collects clinical research literature for a specific clinical problem, uses unified scientific evaluation standards, screens out documents that meet quality standards, and uses statistical methods to quantitatively or qualitatively synthesize them to provide the latest knowledge and offer the basis for decision-making and improve clinical practice. The “descriptive analysis” in our study falls under the category of “systematic review,” which provides a more comprehensive understanding of the clinical efficacy and safety of three single-dose antiviral drugs (peramivir, baroxavir, and lamamivir) in the treatment of influenza by collating and summarizing the median antipyretic time, median TTAS and incidence of AEs in the two studies excluded from the meta-analysis. As is shown by the results of pairwise meta-analysis, laninamivir 40 mg remarkably outperformed laninamivir 20 mg (MD = −12.80, 95% CI: [−23.04, −2.56]) in TTAS, indicating a statistically significant difference (Figure 3B).


3.3.2 TTAS evidence network
Eight RCTs21-23, 25, 27-30 (nine records) have reported TTAS outcomes; six of those were double-arm trials, three were three-arm trials, and two were head-to-head comparison trials, with a total of five single-dose interventions and a grand total of 5377 cases (Figure 4).

3.3.3 TTAS probability ranking (SUCRA)
In terms of TTAS, the efficacy of the five single-dose interventions ranked as follows: peramivir 300 mg (SUCRA = 80.3%), peramivir 600 mg (SUCRA = 76.2%), baloxavir (SUCRA = 68.4%), laninamivir 40 mg (SUCRA = 55.0%) and laninamivir 20 mg (SUCRA = 16.6%). Figure 5 presents the SUCRA probability ranking.

3.3.4 NMA for TTAS
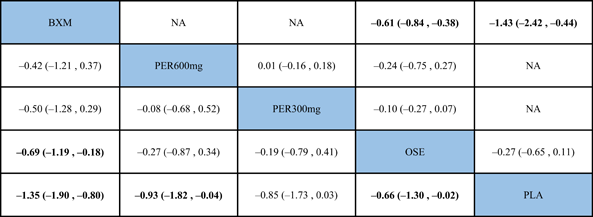
The NMA results revealed that among the five single-dose interventions, peramivir 300 mg (MD = −17.68, 95% CI: [−34.05, −1.32]), peramivir 600 mg (MD = −16.15, 95% CI: [−29.35, −2.95]), baloxavir (MD = −14.67, 95% CI: [−26.75, −2.58]) and laninamivir 40 mg (MD = −12.42, 95% CI: [−22.53, −2.31]) remarkably outperformed laninamivir 20 mg in TTAS, indicating a statistically significant difference (Table 3).
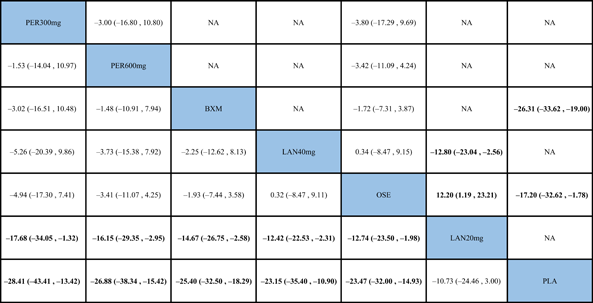 |
- Note: Treatments were ranked according to their efficacy in SUCRA (from top left to bottom right). The results of pairwise meta-analysis are listed along the top right of the triangle, whereas NMA results along the bottom left of the triangle. NA = data not available. Bold font indicates a statistically significant difference between interventions.
- Abbreviations: BXM, baloxavir; LAN20 mg, laninamivir 20 mg; LAN40 mg, laninamivir 40 mg; NA, data not available; OSE, oseltamivir; PER300 mg, peramivir 300 mg; PER600 mg, peramivir 600 mg; PLA, placebo.
3.3.5 TTAS inconsistency and heterogeneity test
The inconsistency of the model was assessed using the global inconsistency test, the loop-specific test, and the node-splitting method. The global inconsistency test revealed no significant differences between the consistency model and the inconsistency model (p = 0.817) (Figure 6). The local inconsistency test indicated consistency of all closed loops because, as shown by the loop-specific test data, the lower limits of their 95% CIs all contained 0 (p > 0.05), with all the τ2 values being close to 0 (Table 4). Comparisons were conducted between each partition node, as suggested by the results of the node-splitting method which indicated no statistically significant differences between the results of direct and indirect comparisons (p > 0.05). Therefore, all comparisons between any two interventions were consistent, which supported the merge of all results (Table 5).

| Loop | IF | seIF | Z_value | P_value | CI_95 | Loop_Heterog_tau2 |
|---|---|---|---|---|---|---|
| BXM–OSE–PLA | 8.450 | 9.229 | 0.916 | 0.360 | (0.00, 26.54) | 0.000 |
| LAN40 mg–LAN20 mg–OSE | 5.600 | 13.386 | 0.418 | 0.676 | (0.00, 31.84) | 0.000 |
| PER300 mg–PER600 mg–OSE | 4.031 | 10.976 | 0.367 | 0.713 | (0.00, 25.54) | 0.000 |
- Abbreviations: BXM, baloxavir; LAN20 mg, laninamivir 20 mg; LAN40 mg, laninamivir 40 mg; OSE, oseltamivir; PER300 mg, peramivir 300 mg; PER600 mg, peramivir 600 mg; PLA, placebo.
| Side | Direct | Indirect | Difference | p | |||
|---|---|---|---|---|---|---|---|
| Coef. | SE | Coef. | SE | Coef. | SE | ||
| PER300 mg vs. PER600 mg | 3.005739 | 7.038785 | −4.727171 | 14.17444 | 7.73291 | 15.63057 | 0.621 |
| PER300 mg vs. OSE | 3.76203 | 6.883398 | 10.36193 | 14.13096 | −6.599899 | 15.40741 | 0.668 |
| PER600 mg vs. OSE | 3.426552 | 3.911081 | −4.314329 | 82.69599 | 7.740881 | 82.78081 | 0.925 |
| LAN40 mg vs. LAN20 mg | 12.80433 | 5.22374 | 1.819548 | 23.66115 | 10.98478 | 23.92672 | 0.646 |
| LAN40 mg vs. OSE | −0.3395542 | 4.493482 | 10.31356 | 142.0586 | −10.65311 | 142.2717 | 0.940 |
| LAN20 mg vs. OSE | −12.12 | 5.616712 | −22.93418 | 23.27509 | 10.73418 | 23.8161 | 0.652 |
| BXM vs. OSE | 1.718219 | 2.84954 | 8.822119 | 15.2352 | −7.103901 | 15.42951 | 0.645 |
| BXM vs. PLA | 26.30862 | 3.728901 | 10.0249 | 15.1398 | 16.28372 | 15.57054 | 0.296 |
| OSE vs. PLA | 17.52786 | 7.841211 | 26.17979 | 5.273912 | −8.651931 | 9.49589 | 0.362 |
- Abbreviations: BXM, baloxavir; LAN20 mg, laninamivir 20 mg; LAN40 mg, laninamivir 40 mg; OSE, oseltamivir; PER300 mg, peramivir 300 mg; PER600 mg, peramivir 600 mg; PLA, placebo.
Additionally, a few heterogeneities were revealed by the predictive interval plot (Figure 7). Of the 21 pairwise comparisons, seven (laninamivir 20 mg vs. peramivir 300 mg, placebo vs. peramivir 300 mg, laninamivir 20 mg vs. peramivir 600 mg, laninamivir 20 mg vs. laninamivir 40 mg, placebo vs. laninamivir 40 mg, baloxavir vs. laninamivir 20 mg and oseltamivir vs. laninamivir 20 mg) were noted because their CIs were inconsistent with the values in their respective predictive intervals. Although all the differences between these interventions appeared to be statistically significant, based on pairwise comparisons, all predictive intervals were wider than their CIs and intersected with the invalidity line. Therefore, the impact of heterogeneity on each pairwise comparison needs more studies.

3.3.6 Funnel plot and small sample effect assessment for TTAS
No funnel plot has been drawn for TTAS because the number of the outcome indicators of TTAS included in the study was smaller than 10.
3.3.7 Pairwise meta-analysis for AEs
Figure 8 shows the impacts of the five single-dose treatments (peramivir 300 mg, peramivir 600 mg, laninamivir 40 mg, laninamivir 20 mg, and baloxavir) on AEs. The random-effects model was used for meta-analysis, with the heterogeneity test results indicating low to moderate heterogeneity between different studies (I2 value: 0%–56%). According to the results of pairwise meta-analysis, no treatment was statistically significant for AEs.

3.3.8 AEs evidence network
Nine RCTs21-23, 25, 27-31 have reported AEs outcomes; among those five were double-arm trials, four were three-arm trials, and two were head-to-head comparison trials, with a total of five single-dose treatments and a grand total of 6750 cases (Figure 9).

3.3.9 AEs probability ranking (SUCRA)
For AEs, the efficacy of the five single-dose interventions was ranked as follows: baloxavir (SUCRA = 83.4%), peramivir 300 mg (SUCRA = 71.4%), laninamivir 20 mg (SUCRA = 62.4%), peramivir 600 mg (SUCRA = 56.2%) and laninamivir 40 mg (SUCRA = 36.8%). Figure 10 presents the SUCRA probability ranking.

3.3.10 NMA for AEs
The NMA results revealed that, among the five single-dose treatments, AE for none was statistically significant (Table 6).
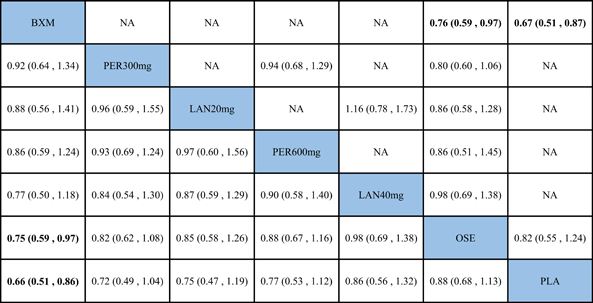 |
- Note: Treatments were ranked according to their efficacy in SUCRA (from top left to bottom right). The results of pairwise meta-analysis are listed along the top right of the triangle, whereas NMA results along the bottom left of the triangle. Bold font indicates a statistically significant difference between interventions
- Abbreviations: BXM, baloxavir; LAN20 mg, laninamivir 20 mg; LAN40 mg, laninamivir 40 mg; NA, data not available; OSE, oseltamivir; PER300 mg, peramivir 300 mg; PER600 mg, peramivir 600 mg; PLA, placebo.
3.3.11 AEs inconsistency and heterogeneity tests
According to the inconsistency results of the model, the global inconsistency test revealed no significant differences between the consistency model and the inconsistency model (p = 0.814) (Figure 11); the local inconsistency test indicated consistency of all closed loops because, as shown by the loop-specific test data, the lower limits of their 95% CIs contained 0 (p > 0.05) and all τ2 values were close to 0 (Table 7). Comparisons were conducted for each partition node. The node-splitting method revealed no statistically significant differences between the results of direct and indirect comparisons (p > 0.05). This supported a merge of the results (Table 8).

| Loop | IF | seIF | Z_value | P_value | CI_95 | Loop_Heterog_tau2 |
|---|---|---|---|---|---|---|
| BXM–OSE–PLA | 0.401 | 0.460 | 0.872 | 0.383 | (0.00, 1.30) | 0.000 |
| PER300 mg–PER600 mg–OSE | 0.204 | 0.351 | 0.582 | 0.561 | (0.00, 0.89) | 0.000 |
| LAN40 mg–LAN20 mg–OSE | 0.100 | 0.495 | 0.202 | 0.840 | (0.00, 1.07) | 0.000 |
- Abbreviations: BXM, baloxavir; LAN20 mg, laninamivir 20 mg; LAN40 mg, laninamivir 40 mg; OSE, oseltamivir; PER300 mg, peramivir 300 mg; PER600 mg, peramivir 600 mg; PLA, placebo.
| Side | Direct | Indirect | Difference | p | |||
|---|---|---|---|---|---|---|---|
| Coef. | SE | Coef. | SE | Coef. | SE | ||
| PER300 mg vs. PER600 mg | 0.0655976 | 0.1612411 | 0.1336869 | 0.4083223 | −0.0680893 | 0.4390536 | 0.877 |
| PER300 mg vs. OSE | 0.2261545 | 0.1449994 | −0.2279728 | 0.6191069 | 0.4541273 | 0.6377919 | 0.476 |
| PER600 mg vs. OSE | 0.1426705 | 0.1422494 | −0.214896 | 0.6681689 | 0.3575666 | 0.6844984 | 0.601 |
| LAN40 mg vs. LAN20 mg | −0.1468243 | 0.2042489 | 0.0532216 | 0.8744972 | −0.2000458 | 0.8950519 | 0.823 |
| LAN40 mg vs. OSE | 0.0231624 | 0.1773176 | 0.3794167 | 141.9222 | −0.3562543 | 141.9226 | 0.998 |
| LAN20 mg vs. OSE | 0.150481 | 0.2042817 | 0.3505315 | 0.8744684 | −0.2000505 | 0.8950464 | 0.823 |
| BXM vs. OSE | 0.2827303 | 0.1270524 | 0.1208662 | 115.7472 | 0.1618641 | 115.7474 | 0.999 |
| BXM vs. PLA | 0.3952138 | 0.1349017 | 1.215904 | 0.8687252 | −0.8206907 | 0.8799615 | 0.351 |
| OSE vs. PLA | 0.1501611 | 0.1305724 | −0.670498 | 0.8706936 | 0.8206591 | 0.8799478 | 0.351 |
In addition, a few heterogeneous features were noted based on the predictive interval plot (Figure 12). Of the 21 pairwise comparisons, two (oseltamivir vs. baloxavir and placebo vs. baloxavir) revealed network heterogeneity because their CIs were not consistent with their values tested in their respective predictive intervals. Baloxavir appeared to have an advantage (with a statistically significant difference) over oseltamivir and placebo, but the predictive interval for each of the two pairwise comparisons was wider than the corresponding CIs and intersected with the invalidity line, indicating that the efficacy of baloxavir might not necessarily be superior to that of oseltamivir and placebo and, therefore, suggesting a need for further studies.

3.3.12 Funnel plot and small sample effect assessment for AEs
No funnel plot has been drawn for AEs because the number of the outcome indicators available was smaller than 10.
3.4 Secondary outcomes
3.4.1 Pairwise meta-analysis
The I2 test was conducted to evaluate the magnitude of heterogeneity between different studies, and the random-effects model was used for meta-analysis. The results of the heterogeneity test and the pairwise meta-analysis for antipyretic time, as well as virus titer variation relative to the baseline at 24 and 48 h after medication, are presented in Figures A1-A3 in the appendix.
3.4.2 Evidence network
Seven RCTs21-23, 25, 27, 29, 30 (eight records) have reported antipyretic time outcomes; among those six were double-arm trials, two were three-arm trials, and one was head-to-head comparison trial, with a total of four single-dose interventions (peramivir 600 mg, laninamivir 40 mg, laninamivir 20 mg, and baloxavir), and a grand total of 4260 cases (Figure 4). Four RCTs21-23, 28 (five records) have reported virus titer variation against the baseline at 24 h after the treatment (three double-arm trials, two three-arm trials, and one head-to-head comparative trial) with a total of three single-dose interventions (peramivir 300 mg, peramivir 600 mg, and baloxavir) and a grand total of 3015 cases (Figure 5). Five RCTs21-24, 28 (six records) have reported virus titer variation against the baseline at 48 h after the treatment (three double-arm trials, three three-arm trials, and one head-to-head comparison trial) with a total of three single-dose interventions (peramivir 300 mg, peramivir 600 mg, and baloxavir) and a grand total of 3535 cases (Figure A6 in the appendix).
3.4.3 Probability ranking (SUCRA)
In antipyretic time and virus titer variation against the baseline at 24 and 48 h after medication, the efficacy of the single-dose treatments was respectively ranked as follows: baloxavir (SUCRA = 76.3%), peramivir 600 mg (SUCRA = 67.8%), laninamivir 40 mg (SUCRA = 47.2%), and laninamivir 20 mg (SUCRA = 40.0%); baloxavir (SUCRA = 96.7%), peramivir 300 mg (SUCRA = 64.5%), and peramivir 600 mg (SUCRA = 63.2%); and baloxavir (SUCRA = 93.2%), peramivir 600 mg (SUCRA = 64.0%), and peramivir300 mg (SUCRA = 55.0%). These SUCRA probability rankings are listed in Figures A7-A9 in the appendix.
3.4.4 NMA
According to the NMA results, no treatment was found to be statistically significant according to the antipyretic time or virus titer variation against the baseline at 24 or 48 h after medication. These results are shown in Tables A1–A3 in the appendix.
3.4.5 Inconsistency and heterogeneity tests
The results of the global inconsistency test, loop-specific test and node-splitting method for antipyretic time and virus titer variation against the baseline at 24 and 48 h after medication are presented in Figures A10-A12, Tables A4–A6 and A7–A9 in the appendix. Since there was only one study (PER 300 mg–PER 600 mg–OSE) with data for virus titer variation against the baseline at 24 h after medication, the predictive interval plot could not be generated. The predictive interval results for antipyretic time and virus titer variation against the baseline at 48 h after medication are shown in Figures A13 and A14 in the appendix. Based on NMA estimation, these three outcome indicators were sound as far as their inconsistency and heterogeneity, and comparatively stable.
3.4.6 Funnel plot and small sample effect evaluation
For antipyretic time and virus titer variation against the baseline at 24 and 48 h after medication, no funnel plots were generated because these outcomes were reported by fewer than 10 studies.
4 DISCUSSION
For the three anti-influenza single-dose drugs included in this study, up to five interventions were investigated based on different administration doses. The NMA results are ranked as follows: peramivir 300 mg > peramivir 600 mg > baloxavir > laninamivir 40 mg > laninamivir 20 mg in TTAS. Compared with oral baloxavir and inhaled laninamivir, peramivir is able to reach the blood at a comparatively high concentration via intravenous infusion, with the plasma drug concentration quickly reaching the peak—a sign of its superior bioavailability.33, 34 According to some studies,35, 36 certain influenza virus subtypes (such as H5N1 and H7N9) will cause severe viral pneumonia for their high affinity to epithelial cells and alveoli of lower respiratory tract. Under such circumstances, inhaled laninamivir would be unsatisfactory in efficacy due to its failure to reach the lower respiratory tract. Intravenous peramivir and oral baloxavir, on the other hand, can be absorbed to get distributed throughout the body and take effect after reaching the relevant parts of the lower respiratory tract. In antipyretic time, the ranking was: baloxavir > peramivir 600 mg > laninamivir 40 mg > laninamivir 20 mg. In virus titer variation against the baseline at 24 and 48 h after medication, it was: baloxavir > peramivir 300 mg ≈ peramivir 600 mg. And in AEs: baloxavir > peramivir 300 mg > laninamivir 20 mg > peramivir 600 mg > laninamivir 40 mg. As a cap-dependent endonuclease inhibitor, baloxavir inhibits the cap-snatching behavior of the virus by inhibiting the endonuclease activity of the polymerase acidic protein (PA) subunit of the RNA polymerase of influenza virus, thus blocking replication of the virus. Since no processes similar to cap-snatching have been identified in human cells, baloxavir has a strong specificity for its blocking of the multiplication process of influenza virus.37 In relatively many studies, the degree of virus shedding is used as a measure of the transmission intensity of influenza.38-40 By shortening the time during which the virus stops shedding and rapidly reducing the viral load, the spread of the disease can be effectively curbed. As far as the outcome indicator of virus titer variation against the baseline is concerned, the results reveal that baloxavir outperforms both peramivir 300 mg and peramivir 600 mg in virus titer variation against the baseline at 24 and 48 h after medication. Taieb et al. conducted two NMAs for healthy influenza patients without other underlying diseases and high-risk influenza patients,41, 42 both of which revealed that virus titer dropped remarkably 24 h after baloxavir administration (p < 0.05) compared with peramivir 600 mg, and dropped more rapidly 48 h after baloxavir administration compared with laninamivir 40 mg. Consistent with the research outcomes of Taieb et al., the results of our study indicate that baloxavir is more effective than neuraminidase inhibitors (NAIs) in reducing virus titer within 24 and 48 h.
Two clinical studies have been excluded from our data base for their relatively small sample sizes and large heterogeneity noted when they were included in data analysis. One, conducted by Sugaya et al.,26 revealed the median antipyretic time for laninamivir 40 mg, laninamivir 20 mg, and oseltamivir as follows: laninamivir 40 mg (MD = −2.8, 95% CI: [−13.2, 3.2]) was shorter than oseltamivir (p = 0.423) and laninamivir 20 mg (MD = −7.4, 95% CI: [−16.0, 1.7]) was shorter than oseltamivir (p = 0.128) in antipyretic time after 38.1, 33.5, and 40.9 h, respectively. Although there was a lack of appropriate measures for a direct comparison between laninamivir 40 mg and laninamivir 20 mg, it can be judged from the median antipyretic time that laninamivir 20 mg would slightly outperform laninamivir 40 mg. The incidence of AEs for laninamivir 40 mg, laninamivir 20 mg and oseltamivir was 9.8%, 19.7% and 11.3%, respectively, indicating an advantage of laninamivir 40 mg over laninamivir 20 mg. Another study, the NCT02369159 clinical trial,32 reported the median TTAS of peramivir 600 mg and oseltamivir as 101.3 and 75.5 h, and their AEs incidence as 20.6% and 21.7%, respectively.
The advantages of our NMA include the following: (1) Massive number of English databases and clinical trials available for automatic retrieval to collect the most comprehensive evidence presently possible; (2) Most of the studies included in our analysis are polycentric large-sample RCTs. Thanks to a total sample size of more than 7000 cases, the accuracy and reliability of the research data is likely high. Nevertheless, our study was limited by the following: (1) The relatively large heterogeneity and inconsistency for certain outcome indicators. Because the number of studies available for pairwise comparisons was small, subgroup and sensitivity analysis could not be carried out to identify the sources of heterogeneity and inconsistency. Therefore, the results need to be interpreted with caution. The reasons for comparatively large heterogeneity and inconsistency for certain outcome indicators may be related to the different routes of drug administration, differences in patients' age and ethnicity, severity of the disease, diagnostic criteria and influenza virus detection methods, virus strain types, and requirements set for the endpoint criteria. Comparatively large heterogeneity and inconsistency in the outcome indicator of virus titer variation against the baseline may be attributed to different detection methods of the virus, for example, the reverse transcription-polymerase chain reaction was used in some studies21, 29 while the rapid antigen test (RAT) in other studies.27, 28 There might also be a relationship between the type of influenza virus strains, their seasonality, and geographic spread and treatment efficacy. These factors could influence data comparability among different studies. (2) Since all studies were funded by commercial entities, there is a risk of bias that might affect the accuracy and reliability of the results. (3) In the cases of only one study using certain interventions, the stability of the evidence network might be low. (4) For lack of relevant studies, it is impossible to establish a network relationship for pneumonia and bronchitis, two of the key outcome indicators in this field. As a result, more clinical trials are needed to determine the relative impact of antiviral drugs on these indicators. (5) No funnel plots have been generated because the number of studies with the outcome indicators analyzed in our study was smaller than 10, which may lead to publication bias or small-sample events. Therefore, the results need to be interpreted in a prudent manner. Because of the aforementioned limitations, we recommended that the results of our study be interpreted in combination with expert advice and in the context of specific clinical conditions.
5 CONCLUSIONS
In summary, we have compared the efficacy and safety of five fractional dose treatments of three single-dose anti-influenza virus drugs. According to the results, peramivir outperforms both baloxavir and laninamivir in TTAS, while baloxavir has the best efficacy in antipyretic time, viral titer variation against the baseline at 24 and 48 h after medication and AEs. We recommend that more high-quality, polycentric, large-sample, and randomized double-blind clinical trials be performed in the future to supplement and improve our results.
AUTHOR CONTRIBUTIONS
Xiuju Liu, Yonghong Zhao, Guangliang Huang, Wenjuan He, and Qian Sun designed the study and revised the manuscript. Guangliang Huang, Wenyan Cui, Yonghong Zhao and Huichao Wang extracted the data. Yonghong Zhao, Wenjuan He, and Guangliang Huang evaluated the quality of the randomized controlled trials. Xiaojuan Zhao, Dan Li and Qian Sun verified the data. Xiuju Liu, Guangliang Huang, and Yonghong Zhao analyzed the data and wrote the manuscript. All authors read and approved the final manuscript. All authors contributed to the article and approved the submitted version.
ACKNOWLEDGEMENTS
The authors would like to express their gratitude to all the researchers who kindly provided the data for the network meta-analysis, at the same time, the authors also thank EditSprings (https://www.editsprings.cn/) for the expert linguistic services provided.
CONFLICTS OF INTEREST
The authors declare no conflicts of interest.
Appendix
See Figures A1-A14 and Tables A1-A9


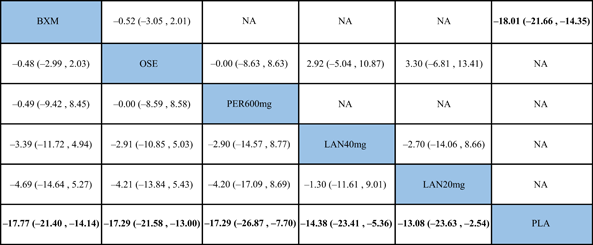 |
- Note: Treatments were ranked according to their efficacy in SUCRA (from top left to bottom right). The results of pairwise meta-analysis are listed along the top right of the triangle, whereas NMA results along the bottom left of the triangle. Bold font indicates a statistically significant difference between interventions.
- Abbreviations: BXM, baloxavir; LAN20 mg, laninamivir 20 mg; LAN40 mg, laninamivir 40 mg; NA, data not available; OSE, oseltamivir; PER300 mg, peramivir 300 mg; PER600 mg, peramivir 600 mg; PLA, placebo.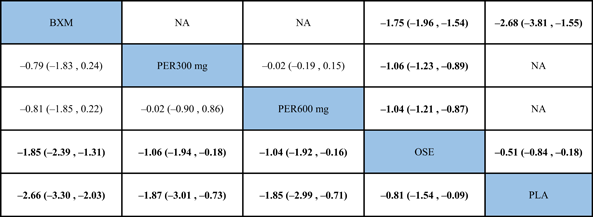
| Loop | IF | seIF | Z_value | P_value | CI_95 | Loop_Heterog_tau2 |
|---|---|---|---|---|---|---|
| LAN40 mg–LAN20 mg–OSE | 4.700 | 9.676 | 0.486 | 0.627 | (0.00, 23.67) | 0.000 |
| BXM–OSE–PLA | 1.807 | 4.882 | 0.370 | 0.711 | (0.00, 11.38) | 0.000 |
- Abbreviations: BXM, baloxavir; LAN20 mg, laninamivir 20 mg; LAN40 mg, laninamivir 40 mg; OSE, oseltamivir; PLA, placebo.
| Loop | IF | seIF | Z_value | P_value | CI_95 | Loop_Heterog_tau2 |
|---|---|---|---|---|---|---|
| BXM–OSE–PLA | 0.246 | 0.256 | 0.963 | 0.336 | (0.00, 0.75) | 0.000 |
| PER300 mg–PER600 mg–OSE | NA | NA | NA | NA | NA | 0.000 |
- Note: Loop PER300 mg–PER600 mg–OSE is formed only by multiarm trial (s)—Consistent by definition.
- Abbreviations: BXM, baloxavir; OSE, oseltamivir; PER300 mg, peramivir 300 mg, PER600 mg, peramivir 600 mg; PLA, placebo.
| Loop | IF | seIF | Z_value | P_value | CI_95 | Loop_Heterog_tau2 |
|---|---|---|---|---|---|---|
| BXM–OSE–PLA | 0.483 | 0.285 | 1.694 | 0.090 | (0.00, 1.04) | 0.000 |
| PER300 mg–PER600 mg–OSE | NA | NA | NA | NA | NA | 0.003 |
- Note: Loop PER300 mg–PER600 mg–OSE is formed only by multiarm trial (s)—Consistent by definition.
- Abbreviations: BXM, baloxavir; OSE, oseltamivir; PER300 mg, peramivir 300 mg, PER600 mg, peramivir 600 mg; PLA, placebo.
| Side | Direct | Indirect | Difference | p | |||
|---|---|---|---|---|---|---|---|
| Coef. | S.E. | Coef. | S.E. | Coef. | S.E. | ||
| PER600 mg vs. OSE | 0.0026502 | 4.403143 | -0.6483048 | 40.8555 | 0.6509549 | 41.09208 | 0.987 |
| LAN40 mg vs. LAN20 mg | 2.701169 | 5.791048 | -6.667411 | 14.75302 | 9.368581 | 16.20704 | 0.563 |
| LAN40 mg v.s OSE | −2.915556 | 4.057994 | 2.92824 | 141.7512 | −5.843797 | 141.9253 | 0.967 |
| LAN20 mg vs. OSE | −3.299999 | 5.160407 | −12.6298 | 15.43539 | 9.329804 | 16.20645 | 0.565 |
| BXM vs. OSE | 0.775101 | 2.019948 | −1.781162 | 9.246228 | 2.556263 | 9.336177 | 0.784 |
| BXM vs. PLA | 18.00638 | 1.866396 | 11.38996 | 6.387758 | 6.616425 | 6.337544 | 0.296 |
| OSE vs. PLA | 15.12925 | 4.076408 | 18.07429 | 2.5184 | −2.945039 | 4.688498 | 0.530 |
- Abbreviations: BXM, baloxavir; LAN20 mg, laninamivir 20 mg; LAN40 mg, laninamivir 40 mg; OSE, oseltamivir; PER600 mg, peramivir 600 mg; PLA, placebo.
| Side | Direct | Indirect | Difference | p | |||
|---|---|---|---|---|---|---|---|
| Coef. | SE | Coef. | SE | Coef. | SE | ||
| PER300 mg vs. PER600 mg | 0.02 | 0.4496805 | 1.604297 | 100.1687 | −1.584297 | 100.1679 | 0.987 |
| PER300 mg vs. OSE | 1.06 | 0.4498103 | 1.852233 | 50.01764 | −0.7922327 | 50.01966 | 0.987 |
| PER600 mg vs. OSE | 1.04 | 0.4492228 | 2.624297 | 100.0198 | −1.584297 | 100.0208 | 0.987 |
| BXM vs. OSE | 1.747678 | 0.1073849 | 3.897458 | 0.4959923 | −2.14978 | 0.5078545 | 0.000 |
| BXM vs. PLA | 2.676796 | 0.4138707 | 2.576404 | 1.317765 | 0.1003915 | 1.381085 | 0.942 |
| OSE vs. PLA | 0.5112983 | 0.4699158 | 1.278415 | 0.5849975 | −0.7671163 | 0.7502281 | 0.307 |
- Abbreviations: BXM, baloxavir; OSE, oseltamivir; PER300 mg, peramivir 300 mg; PER600 mg, peramivir 600 mg; PLA, placebo.
| Side | Direct | Indirect | Difference | p | |||
|---|---|---|---|---|---|---|---|
| Coef. | S.E. | Coef. | S.E. | Coef. | S.E. | ||
| PER300 mg vs. PER600 mg | −0.0773587 | 0.306132 | 0.9182183 | 99.99804 | −0.995577 | 99.99847 | 0.992 |
| PER300 mg vs. OSE | 0.190417 | 0.3040076 | 0.6882063 | 50.00966 | −0.4977894 | 50.0106 | 0.992 |
| PER600 mg vs. OSE | 0.2677757 | 0.3077976 | 1.263359 | 99.97286 | −0.9955831 | 99.97334 | 0.992 |
| BXM vs. OSE | 0.6082061 | 0.116464 | 2.67387 | 0.5665849 | −2.065664 | 0.5757212 | 0.000 |
| BXM vs. PLA | 1.411903 | 0.3206973 | 0.6303285 | 1.087894 | 0.7815747 | 1.133381 | 0.490 |
| OSE vs. PLA | 0.2717827 | 0.3195508 | 1.328381 | 0.4410588 | −1.056599 | 0.5446905 | 0.052 |
- Abbreviations: BXM, baloxavir; OSE, oseltamivir; PER300 mg, peramivir 300 mg; PER600 mg, peramivir 600 mg; PLA, placebo.
Open Research
DATA AVAILABILITY STATEMENT
Data available on request from the authors: the data that support the findings of this study are available from the corresponding author upon reasonable request.