Precise analysis of the effect of basal core promoter/precore mutations on the main phenotype of chronic hepatitis B in mouse models
Abstract
High replication and mutation rates of hepatitis B virus (HBV) often lead to reduced or suppressed hepatitis B e antigen expression. The most common mutations are genomic variations in the basal core promoter (BCP) and pre-core (PC) regions. However, the effect of BCP/PC mutations on HBV phenotype in vivo remains unclear. We compared and analyzed BCP/PC mutations and BCP/PC reverse mutations in mouse models. In addition to terminating the expression of HBeAg, BCP/PC mutations also resulted in a significant decrease in HBsAg, HBV DNA, and cccDNA in the early stage, and an obvious increase in serum alanine aminotransferase throughout the transfection period. In both groups, serum HBV DNA was positively correlated with intracellular HBV DNA and cccDNA. Further, we found that interleukin-4 (IL-4) and L-10 levels were significantly lower in the BCP/PC(M) group than in the BCP/PC(R) group at 4 weeks post-injection. However, IL-1β was significantly lower in the BCP/PC(M) group than in the BCP/PC(R) group at 26 weeks post-injection. In summary, we precisely analyzed the effect of BCP/PC mutations on the phenotype in vivo, which is important to evaluating disease progression and treatment responses of variable chronic hepatitis B patients.
Highlights
-
BCP/PC(M) and BCP/PC(R) chronic hepatitis B mouse models were established successfully by injecting two kinds of cccDNA.
-
The HBV markers, including HBsAg, HBeAg, HBcAg, HBV DNA, and cccDNA in serum and/or in the liver could persist for at least 26 weeks.
-
BCP/PC mutations resulted in a decrease in HBsAg, HBV DNA, cccDNA in the early stage, and an increase in serum ALT throughout the transfection period.
-
HBV DNA in the serum could better respond to viral replication and cccDNA status in vivo.
-
BCP/PC mutations contributed to an inefficient immune response in the late stages of chronic infection.
Abbreviations
-
- ALT
-
- alanine aminotransferase
-
- BCP
-
- basal core promoter
-
- cccDNA
-
- covalently closed circular DNA
-
- CHB
-
- chronic hepatitis B
-
- HBV
-
- hepatitis B virus
-
- HBeAg
-
- hepatitis B e antigen
-
- HBsAg
-
- hepatitis B surface antigen
-
- HBcAg
-
- hepatitis B core antigen
-
- HCC
-
- hepatocellular carcinoma
-
- PC
-
- pre-core
1 INTRODUCTION
Chronic hepatitis B virus (HBV) infection may lead to liver fibrosis, liver cirrhosis, and hepatocellular carcinoma (HCC).1-3 A total of 248 million individuals are reportedly chronically infected with HBV worldwide.4 HBV has a high replication and mutation rate, and the most common HBV genomic sequence variations include double substitution mutations in the basal core promoter (BCP) region at nucleotides 1762 and 1764 (A1762T/G1764A) and stop codon mutations in the pre-core (PC) region at nucleotides 1896 and 1899 (G1896A/G1899A).5, 6
There are reports that BCP/PC mutations block or reduce HBeAg expression7-9 and interfere with HBeAg response to antiviral drug.10, 11 Considering that analysis of BCP/PC combined mutants is important to evaluating disease progression and treatment responses in chronic hepatitis B (CHB) patients,12 Parekh et al performed comparative experiments in vitro by transfecting naturally occurring core promoter mutants and wild-type clones, and then analyzing the difference in HBV phenotype.13 However, there are no precise in vivo data.
We previously isolated and identified an HBV strain with typical BCP/PC (ntA1762T/G1764A/G1896A/G1899A) combined mutations, B genotype, and adw serum subtype.14 However, the phenotypic specificity of this strain with natural BCP/PC combined mutations remains unclear, especially the effect of BCP/PC combined mutations on HBsAg.15 Therefore, we used HBV DNA of the BCP/PC mutation or its reverse mutation gene as a template to synthesize covalently closed circular DNA (cccDNA), which was then injected hydrodynamically into the tail vein of CBA/CaJ mice, respectively. The prototypical features of natural BCP/PC mutations in HBV were precisely and dynamically studied using a comparative analysis method in a CHB mouse model.
2 MATERIALS AND METHODS
2.1 Production of HBV cccDNA
The pEASY-HBV/BCP/PC(M) plasmid (A1762T, G1764A, G1896A, and G1899A mutations) was provided by Chongqing Medical University Laboratory Animal Center, Chongqing, China. The pEASY-HBV/BCP/PC(R) plasmid was generated from the pEASY-HBV/BCP/PC(M) plasmid using Quick Change site-directed mutagenesis kit (Stratagene). For ntA1762T and G1764A, the forward primer was 5′-GTTAGGTTAAAGGTCTTTGTACTAGGAGGCTGTAGGCATAAATTG-3′, and reverse primer was 5′-CTAGTACAAAGACCTTTAACCTAACCTCCTCCCCCAACTCCTCCC-3′; for ntG1896A and G1899A, the forward primer was 5′-GGGTGGCTTTGGGGCATGGACATTGACCCGTATAAAGAATTTG-3′, and reverse primer was 5′-CAATGTCCATGCCCCAAAGCCACCCAAGGCACAGCTTGGAGG-3′. A previously reported method was used to amplify the HBV DNA sequence using pEASY-HBV/BCP/PC(M) plasmid or pEASY-HBV/BCP/PC(R) plasmid as templates, and then to circularize the DNA [BCP/PC(M) cccDNA and BCP/PC(R) cccDNA].16 All mutant clones were verified by sequencing.
2.2 Transfection of cccDNA into cells
HepG2 cells (5 × 10⁵ cells/well) were seeded in 24-well plates and maintained in Dulbecco modified Eagle medium supplemented with 10% fetal bovine serum and cultured overnight in a humidified incubator at 37℃ with 5% CO2. The cells were then transfected with cccDNA (500 ng/well) for 48 hours using Lipofectamine 3000 (Invitrogen). The experimental group and the control group were transfected with BCP/PC(M) HBV cccDNA and BCP/PC(R) HBV cccDNA, respectively.
2.3 Quantitative assay of hepatitis B surface antigen and HBeAg in the cell supernatant
At 24, 48, and 72 hours posttransfection, the culture supernatant was collected. The levels of hepatitis B surface antigen (HBsAg) and HBeAg in the culture medium were assessed using enzyme-linked immunosorbent assay (ELISA) according to the manufacturer's protocol (KHB, China). The serum standards of HBsAg and HBeAg were purchased from Beijing Controls & Standards Biotechnology Co, Ltd (China).
2.4 Establishment of the animal models
Male CBA/CaJ mice (8-10 weeks of age, 22-26 g, specific pathogen-free) were provided by the Laboratory Animal Center of Chongqing Medical University (SCXK (YU) 2018-0003). The mice were maintained under optimal conditions for hygiene, temperature, and photoperiods (12:12 hours light:dark), and allowed food and water intake ad libitum, according to the institutional guidelines for the care and use of laboratory animals.
Seventy CBA/CaJ male mice were divided randomly into three groups and subjected to hydrodynamic tail intravenous injection of cccDNA or normal saline. The details are as follows: BCP/PC(M) group (n = 28) was injected with BCP/PC(M) HBV cccDNA (2 μg/2 mL/mouse); BCP/PC(R) group (n = 21) was injected with BCP/PC(R) HBV cccDNA (2 μg/2 mL/mouse); and the blank group (n = 21) was injected with normal saline (2 mL/mouse). Serum samples were collected via the tail vein at 1, 2, 4, 8, 12, 16, 20, 24, and 26 weeks post-injection (pi). Liver tissue was collected at 4, 8, 12, 16, 20, 24, and 26 weeks pi by sacrificing three or four mice from each group. All animal procedures were approved by the Ethics Committee of Chongqing Medical University (permit number: 2015019). All surgical procedures were performed using anesthesia to minimize animal suffering.
2.5 Evaluation of HBV-specific serological markers and alanine aminotransferase in mice
Mouse sera were tested for HBV-specific serological markers (HBsAg, HBeAg, and viral DNA) and alanine aminotransferase (ALT) at designated time points. The levels of HBsAg and HBeAg in serum were detected using a radioimmunoassay diagnostic kit (Beijing North Biotechnology Research Institute, China). A Catalyst Dx chemistry analyzer (IDEXX) for the measurement of serum ALT. Serum DNA was extracted from serum using the TIANamp Virus DNA/RNA Kit (Tiangen Bio-Tech, China), and quantified using SYBRTM Green PCR master mix (Bio-Rad). A qPCR standard curve was generated using 10-fold dilutions of the pEASY-BCP/PC(M) HBV DNA plasmid (5.0 × 10³-5.0 × 10⁸ copies/μL). Primers for amplification of HBV DNA fragments were designed based on the conserved region of the HBV gene.17 All primer sequences are shown in Table S1.
2.6 Detection of HBV DNA and cccDNA in mouse liver tissue
HBV DNA was extracted from the liver using the TIANamp Genomic DNA Kit (Tiangen Bio-Tech, China) and then quantitated by qPCR as described previously. The procedure for the extraction of liver cccDNA is the same as that for HBV DNA. First, the extracted cccDNA was treated with T5 Exo (New England Biolabs) for 30 minutes at 37℃ to degrade HBV rcDNA and keep the HBV cccDNA molecule unchanged, at the same time, selective qPCR methods based on the use of primers spanning the nick in the HBV rcDNA were used. All the primer sequences are shown in Table S1.
2.7 Hepatic histopathological and immunohistochemical analyses
Mice liver tissues were fixed in 10% neutral-buffered formalin and embedded in paraffin. Then, 4-μm thick sections were stained with hematoxylin and eosin for light microscopic evaluation. The expression of HBsAg and HBV core antigen (HBcAg) was determined in the liver sections by immunohistochemical (IHC) using horse anti-HBsAg (1:100) (ab9193; Abcam, UK) and rabbit anti-HBcAg (1:200) (GTX40523; GeneTex) antibodies.
2.8 Quantitative RT-PCR of interleukin-1β, IL-4, IL-6, and IL-10 in liver tissue
Total RNA was extracted using Trizol solution (Invitrogen), and then complementary DNA (cDNA) was synthesized using 1 μg of total RNA and GoScript™ Reverse Transcriptase according to the manufacturer's instructions (Promega). The resulting cDNA was subjected to qPCR analysis. The relative expression levels of the target gene were calculated using the  method and normalized against β-actin reference transcripts. The sequences of the specific primers are listed in Table S1.
2.9 Statistical analysis
All data are expressed as the mean ± standard error of at least three independent experiments. For bivariate correlations, Spearman's rho test was used. Statistical analysis was performed using the independent-samples t-test. P < .05 was considered significant. All statistical analyses were performed using the SPSS 19.0 software.
3 RESULTS
3.1 Transfection of BCP/PC(M) and BCP/PC(R) cccDNA into HepG2 cells
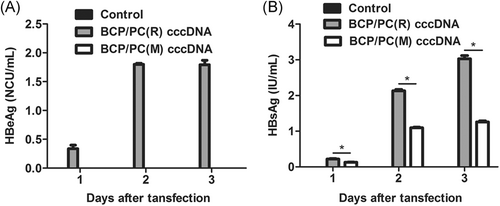
The levels of HBeAg and HBsAg in the supernatant were detected by ELISA. Undoubtedly, HBeAg was only detected in the BCP/PC(R) group, but not in the BCP/PC(M) and normal saline groups (Figure 1A). HBsAg was detected in both the BCP/PC(M) and BCP/PC(R) groups (Figure 1B). Interestingly, the HBsAg expression was lower in the BCP/PC(M) group than in the BCP/PC(R) group (P < .05). These data verified that both BCP/PC(M) and BCP/PC(R) cccDNAs induce HBV antigen expression in HepG2 cells.
3.2 Specific markers were expressed in mouse models
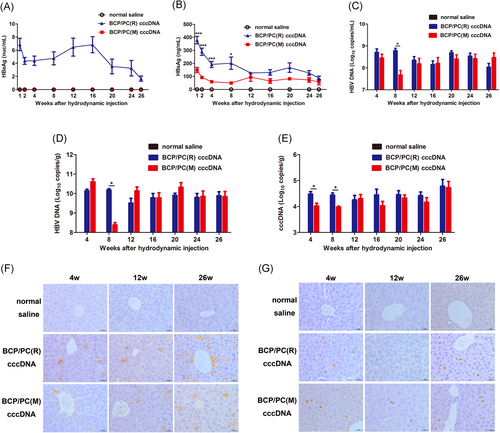
Seventy CBA/CaJ male mice were subjected to hydrodynamic tail intravenous injection of BCP/PC(M) cccDNA, BCP/PC(R) cccDNA, or normal saline. The results showed that HBV markers in both the BCP/PC(M) and BCP/PC(R) groups were positively expressed at specified time points and persisted in serum or liver for 26 weeks (Figure 2A-G). HBV DNA levels in serum and liver were consistently high (>107 copies/mL and 108 copies/g, respectively) (Figure 2C,D), and cccDNA levels were also greater than 104 copies/g for 26 weeks (Figure 2E).
3.3 Effect of BCP/PC mutations on levels of virus-specific markers in serum and liver
By comparing two animal models, we found that BCP/PC mutations resulted in the termination of HBeAg expression. In the early stage (before 8 weeks injection), the serum HBsAg expression was lower in the BCP/PC(M) group than in the BCP/PC(R) group (P < .05), but there was no significant difference in HBsAg after 8 weeks (Figure 2B). The concentrations of serum HBsAg averaged 149.3 ng/µL and 378.8 ng/μL in the BCP/PC(M) and BCP/PC(R) group at 1 week pi, respectively. Simultaneously, we found that BCP/PC mutations significantly reduced HBV DNA and cccDNA levels in both serum and liver tissues at 8 weeks pi (P < .05, Figure 2C-E). Consistent with the serum HBsAg, there was no difference in HBV DNA and cccDNA levels after 8 weeks. HBsAg and HBcAg in the livers of mice were detected at 4, 12, and 26 weeks pi HBsAg expression was hepatocellular and cytoplasmic and localized in the central lobule (Figure 2F). HBsAg expression was lower in the BCP/PC(M) group than in the BCP/PC(R) group at 4 weeks pi HBcAg-positive hepatic cells (positive signal mainly located in the nucleus) were interspersed randomly throughout the hepatic lobule (Figure 2G). There was no significant difference in HBcAg expression in both groups.
3.4 Correlation between serum and intrahepatic viral markers
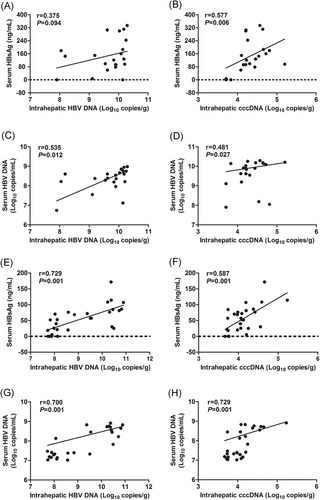
The serum HBV DNA was found to be positively correlated with liver HBV DNA and cccDNA in both the BCP/PC(R) and BCP/PC(M) groups (r = 0.535, P = .012 and r = 0.481, P = .027; r = 0.700, P = .001 and r = 0.729, P = .001, respectively). The serum HBsAg titer was positively correlated with liver cccDNA in both the BCP/PC(R) and BCP/PC(M) groups (r = 0.577, P = .006; r = 0.587, P = .001, respectively). However, the serum HBsAg titer was positively correlated with liver HBV DNA only in the BCP/PC(M) group (r = 0.729, P = .001), and not in the BCP/PC(R) group (r = 0.375, P = .094) (Figure 3A-H). Taken together, these results indicated that the detection of serum HBV DNA could serve as a better measurement of HBV DNA and cccDNA activity in liver.
3.5 Effects of BCP/PC mutations on hepatic injury in the mouse model
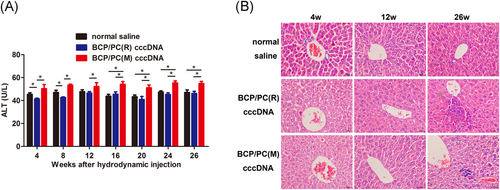
ALT, an enzyme located in liver cells, is released into the circulation by necrotic hepatocytes. Therefore, we monitored ALT concentration in the serum to assess the toxicity following cccDNA administration (Figure 4A). BCP/PC(M) cccDNA infection resulted in a significant increase in serum ALT over the course of 26 weeks compared with BCP/PC(R) cccDNA (P < .05). Furthermore, histological examination of liver sections showed that HBV infection resulted in mild infiltration of inflammatory cells in livers and hepatic necrosis after HBV cccDNA administration. The liver tissue of HBV-infected mice showed inflammatory cell infiltration at 26 weeks pi and exhibited clearly visible lesions. In addition, BCP/PC(M) cccDNA induced less inflammatory cell infiltration than that in the BCP/PC(R) cccDNA group. Although severe liver damage was not observed, a large number of hepatocytes showed fat degeneration or vacuole degeneration. The structure of the hepatic lobule and hepatic cord was fuzzy. These results suggest that persistent HBV cccDNA infection could cause scattered chronic inflammatory cell infiltrates and BCP/PC(M) cccDNA induced less inflammatory cell infiltration than BCP/PC(R) cccDNA did (Figure 4B).
3.6 Effects of BCP/PC mutations on helper T lymphocyte (Th) cytokines
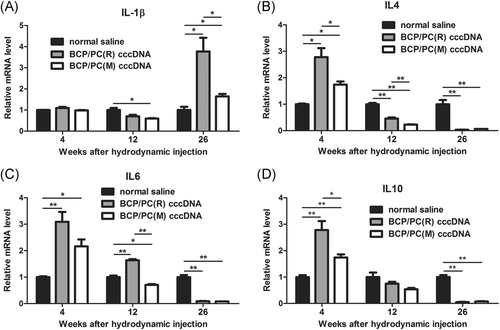
Interleukin-1β (IL-1β), IL-4, IL-6, and IL-10 expression in liver tissue was detected by qRT-PCR (Figure 5A-D). At 4 weeks pi, IL-4, IL-10 expression was significantly lower in the BCP/PC(M) group than in the BCP/PC(R) group. In addition, IL-4, IL-6, and IL-10 expression were significantly higher in the BCP/PC(M) and BCP/PC(R) groups than in the blank group. At 12 weeks pi, IL-4 and IL-6 expression was lower in the BCP/PC(M) group than in the BCP/PC(R) group. At 26 weeks pi, IL-4, IL-6, and IL-10 expression was significantly downregulated and did not differ between the BCP/PC(M) and BCP/PC(R) groups. Interestingly, IL-1β expression was lower in the BCP/PC(M) group than in the BCP/PC(R) and blank groups. These results indicated that anti-inflammatory cytokines were frequently upregulated in the early stage of infection, but in late stage of infection, anti-inflammatory cytokines were downregulated and pro-inflammatory cytokines were upregulated.
4 DISCUSSION
HBV is an incomplete closed double-stranded DNA virus. In addition to strict species specificity and tissue specificity, it also has the characteristics of high replication and high mutation rates for the lack of a proofreading function in the reverse transcriptase.18 Several studies indicated that the appearance BCP/PC mutations significantly increased the risk for HCC in CHB patients.19-22 Moreover, Xu et al23 found that CHB patients with BCP/PC mutants were more susceptible to severe hepatitis and acute-on-chronic liver failure, and Tang et al24 found that the BCP variant was the strongest predictor of significant fibrosis. These results suggested that BCP/PC mutations were closely associated with liver diseases aggravation. It was also reported that BCP/PC mutations could inhibit the synthesis of HBeAg,25, 26 which serves as an immunotolerogen for establishing viral persistence. Thus far, BCP/PC mutations have been shown to play a pivotal role in viral infection. Therefore, a precise understanding of the impact of BCP/PC mutations on HBV phenotypes is of great significance for the development and treatment of CHB. However, most of these previous studies used clinical samples or in vitro experiments to analyze the effect of BCP/PC mutations on HBV phenotype, and in vivo data have been difficult to obtain due to the interference of different genetic backgrounds and genotypes.13, 27 To overcome these problems, it is important to establish a suitable mouse model of chronic infection.
Here, the HBV DNA of the strain with BCP/PC combined mutation or its reverse mutation gene was used as a template to synthesize cccDNA, which was then injected hydrodynamically into the tail vein of CBA/CaJ mice to establish BCP/PC(M) and BCP/PC(R) animal models, respectively. The results showed that HBV markers, including HBsAg, HBeAg, HBcAg, HBV DNA, and cccDNA in serum and/or in the liver can persist for at least 26 weeks. At the same time, HBsAg and HBcAg could be detected in the liver throughout the infection cycle, suggesting that cccDNA in the mouse liver caused continuous transcription and translation of the viral antigen. HE staining results showed that the liver tissue showed inflammatory cell infiltration in the BCP/PC(M) and BCP/PC(R) groups at 26 weeks pi.
By comparing the BCP/PC(M) and BCP/PC(R) animal models, it was found that BCP/PC mutations could not only terminate the expression of HBeAg, but also significantly reduce the expression of HBsAg, HBV DNA, and ccDNA in the early stage, as well as the elevation of ALT during the whole infection cycle. We further examined the levels of Th cytokines. At 4 weeks pi, Th2 cytokines (IL-4 and IL-10) were significantly lower in the BCP/PC(M) group than in the BCP/PC(R) group (P < .05). Studies have shown that Th2 cytokines actively participate in causing persistent infection.28 Furthermore, the expression of HBeAg in the BCP/PC(R) group suggested that HBeAg may be used as an allergen to inhibit humoral immunity in the early stage of infection in the BCP/PC(R) group, leading to high HBV DNA and HBsAg expression and low ALT level compared with those in the BCP/PC(M) group. Interestingly, at 26 weeks pi, the mRNA levels of IL-4, IL-6, and IL-10 in the liver were all significantly lower in the BCP/PC(M) and BCP/PC(R) groups than in the control group, while those of IL-1β were higher than those in the control group. These results indicated that the virus is more likely to produce Th1 cytokines at late stage of infection. In addition, IL-1β was significantly lower in the BCP/PC(M) group than in the BCP/PC(R) group (P < .05), consistent with the HE staining results that the BCP/PC(M) group had less inflammatory cell infiltration than the BCP/PC(R) group. BCP/PC mutations contributed to an inefficient immune response in the late stages of chronic infection, may eventually leading to an increased risk of hepatocellular carcinoma.19
We found that the amounts of HBsAg or HBV DNA in the serum were strongly correlated with the degree of virus replication and the number of copies of cccDNA in the liver in the BCP/PC(M) group. However, serum HBsAg showed no correlation with liver HBV DNA copies in the BCP/PC(R) group. This indicated that, irrespective of HBeAg, HBV DNA in the serum can better respond to viral replication and cccDNA status in vivo.
Taken together, the effects of BCP/PC mutations on phenotype were accurately interpreted for the first time. In addition, the experimental methods provide strong support for HBV research, including personalized model establishment by extracting the patient's serum DNA. The results of the effects of BCP/PC mutations on phenotype provide a theoretical basis to further explore the mechanism of the decline of HBsAg, increase in ALT, and changes in Th cytokines.
ACKNOWLEDGMENTS
The authors thank Professor Zhi Ping Peng (Department of Radiological Medicine and Oncology, College of Basic Medicine, Chongqing Medical University) for the serum HBsAg and HBeAg assays. This study was supported by the National Natural Science Foundation of China (grant number: 81570541) and the Min-Sheng Project of Chongqing Science and Technology (grant number: cstc2017shmsA130097).
CONFLICT OF INTERESTS
The authors declare that there are no conflict of interests.
AUTHOR CONTRIBUTIONS
GQL and HTZ: conceptualization. YL, YWT, MC, QX, and YW: methodology. YL, ZHZ, and XQL: formal analysis and investigation. YL: writing-original draft preparation. GQL: writing-review and editing.
ETHICS STATEMENT
All experiments were performed in compliance with relevant laws and institutional guidelines and in accordance with the ethical standards of the Declaration of Helsinki. All animal procedures were approved by the Ethics Committee of Chongqing Medical University (permit number: 2015019).


