Molecular epidemiology of rotavirus gastroenteritis in Central Kenya before vaccine introduction, 2009–2014
Abstract
Between July 2009 and June 2014, a total of 1,546 fecal specimens were collected from children <5 years of age with acute gastroenteritis admitted to Kiambu County Hospital, Central Kenya. The specimens were screened for group A rotavirus (RVA) using ELISA, and RVA-positive specimens were subjected to semi-nested RT-PCR to determine the G and P genotypes. RVA was detected in 429/1,546 (27.5%) fecal specimens. RVA infections occurred in all age groups <59 months, with an early peak at 6–17 months. The infections persisted year-round with distinct seasonal peaks depending on the year. G1P[8] (28%) was the most predominant genotype, followed by G9P[8] (12%), G8P[4] (7%), G1P[4] (5%), G9P[4] (4%), and G12P[6] (3%). In the yearly change of G and P genotypes, a major shift from G9P[8] to G1P[8] was found in 2012. Phylogenetic analysis of the nucleotide sequences of the VP7 and VP4 genes of seven strains with unusual G8 or P[6] showed that the VP7 nucleotide sequences of G8 were clustered in lineage 6 in which African strains are included, and that there are at least two distinct VP4 nucleotide sequences of P[6] strains. These results represent basic data on RVA strains circulating in this region before vaccine introduction. J. Med. Virol. 89:809–817, 2017. © 2016 Wiley Periodicals, Inc.
INTRODUCTION
Group A rotavirus (RVA) infection is the leading cause of severe and fatal diarrhea, and is associated with 453,000 childhood deaths globally [Tate et al., 2012]. About 85% of these deaths occur in low-income countries, particularly in Africa and Asia, due to a lack of timely and appropriate treatment for dehydration [Parashar et al., 2006]. In Kenya, RVA is estimated to cause, each year, more than 8,000 deaths and 27% of all diarrheal disease hospitalizations among children aged <5 years [WHO, 2012a; Khagayi et al., 2014]. A previous study showed that RVA disease costs the Kenyan health care system US$10.8 million annually [Tate et al., 2009].
Effective and safe RVA vaccines are considered to be a high-impact and cost-effective public health intervention tool to greatly reduce the number of diarrhea deaths and, thereby, facilitate the achievement of the Millennium Development Goal 4 [Rodrigo et al., 2010; Tessa et al., 2010]. Two RVA vaccines: a pentavalent bovine-human reassortant vaccine (RotaTeqTM) and a monovalent attenuated human RVA (HuRVA) vaccine (Rotarix™) have been recommended by the World Health Organization (WHO) for global use [WHO, 2009]. As of May 1, 2016, these vaccines have been implemented in the national immunization programs of 81 countries, including 38 low-income countries that are eligible for support from Gloval Alliance for Vaccines and Immunization (GAVI) [PATH, 2016]. Kenya introduced rotavirus vaccine into her Expanded Programme for Immunization (EPI) in July 2014.
The RVA virion is composed of three layers with two outer capsid proteins, VP7 and VP4. VP7 and VP4 define the G and P types, respectively. RVAs have been classified into at least 27 G types and 37 P types so far [Matthijnssens et al., 2011; Trojnar et al., 2013]. The major G-P types in HuRVAs are G1P[8], G2P[4], G3P[8], G4P[8], and G9P[8], which comprise more than 80% of HuRVA worldwide [Santos and Hoshino, 2005; Bányai et al., 2012]. It has been shown that there is a greater diversity of RVA G and P genotypes in low-income countries in Africa and Asia than in high-income countries [Santos and Hoshino, 2005; Bányai et al., 2012]. The implications of such strain diversity on vaccine effectiveness are not fully understood, although available data provided by pre- and post-licensure studies have shown that both vaccines appear to induce cross-protection against the prevalent strains encountered [Patel et al., 2009; Cherian et al., 2012; Dóró et al., 2014]. Nonetheless, there is a need to monitor G and P genotype prevalence to assess vaccine effectiveness against various RVA strains following vaccination. Surveillance of G and P genotypes will also allow monitoring of G and P genotype changes that may alter vaccine effectiveness or that may be a result of vaccination, such as possible breakthrough events under vaccine immune selective pressure [Dóró et al., 2014]. Importantly, pre-licensure surveillance is necessary to provide baseline data for monitoring the impact of RVA vaccination on the diarrheal disease burden, and for evaluation of any possible changes in the G and P genotype distribution following vaccine introduction [WHO, 2008; Bányai et al., 2012].
In this study, we conducted hospital-based surveillance between July 2009 and June 2014 to determine the prevalence and molecular epidemiology of RVA infections in Central Kenya prior to the introduction of RVA vaccine into the country's national immunization program in July 2014.
MATERIALS AND METHODS
Sample Collection
From July 2009 to June 2014, a total of 1,546 fecal specimens were collected from infants and young children <5 years of age hospitalized for acute gastroenteritis at Kiambu County Hospital, one of the few main referral healthcare facilities in the central region of Kenya, where RotarixTM vaccination was introduced in July 2014. Only children under 5 years of age who presented acute diarrhea for not more than 7 days and had experienced an episode of three looser than normal or watery stools in a 24-hr period with or without episodes of vomiting were enrolled in this study [WHO, 2002]. This study was approved by the Kenya Medical Research Institute (KEMRI)/National Ethical Review Committee (KEMRI/RES/7/3/1). Written informed consent was obtained from parents/guardians of the participants prior to sample collection.
RVA Detection
Fecal suspension was prepared by adding about 1 g of stool sample or 100 μl of rectal swab suspension to 1 ml of 0.01 M phosphate-buffered saline (PBS) (pH 7.2). The mixture was vortexed vigorously followed by centrifugation at 10,000 rpm for 5 min. The supernatant was stored at −30°C until use. The fecal suspension was tested for RVA antigen by ELISA as described previously [Taniguchi et al., 1987] with some modifications. All specimens were stored in aliquots at −80°C for further testing.
Viral RNA Extraction and Polyacrylamide Gel Electrophoresis (PAGE)
RVA double-stranded RNA was extracted from the fecal suspension with ISOGEN-LS (Nippon Gene Co., Ltd., Toyama, Japan) according to the manufacturer's protocol.
The extracted RNA was electrophoresed on 10% polyacrylamide gels (size: 138 (W) × 130 (H) mm; thickness: 2 mm) for 16 hr at 20 mA at room temperature. RNA segments were visualized by silver staining using EzStain Silver kit (ATTO Corporation, Japan) according to the manufacturer's protocol.
G and P Genotyping
The extracted RNA was reverse transcribed into the complementary DNA (cDNA) using ReverTra Ace® qPCR RT Kit (Toyobo Biotechnology Co., Ltd., Japan). The cDNA was then amplified in a two-step multiplexed semi-nested reverse transcription-polymerase chain reaction (RT-PCR) to determine the G and P genotypes of RVA strains using KOD-Plus-Ver.2 high fidelity DNA polymerase kit (Toyobo Biotechnology Co., Ltd.) as described previously with some modifications [Gouvea et al., 1990; Taniguchi et al.,1990; Taniguchi et al., 1992]. The amplified product was then analyzed on a 1.2% agarose gel.
Nucleotide Sequence Analysis
Full-length cDNA of the VP4 and VP7 genes of seven RVAs with G8 or P[6] was prepared by RT-PCR. The PCR products were sequenced with ABI PRISM BigDye terminator cycle sequencing ready reaction kits (PE Biosystems, Chiba, Japan), and an automated sequencer, ABI PRISM 3100 genetic analyzer (PE Applied Biosystems, Foster City, Calif.). Nucleotide sequences were analyzed for construction of a phylogenetic tree using the Neighbor-Joining method.
Nucleotide sequences of the VP4 and VP7 genes obtained in this study were deposited in the DDBJ/EMBL/GenBank database under the following accession numbers: LC177385-LC177387 (VP4 gene) and LC177388-LC177392 (VP7 gene).
RESULTS
Prevalence of RVA Gastroenteritis in Central Kenya
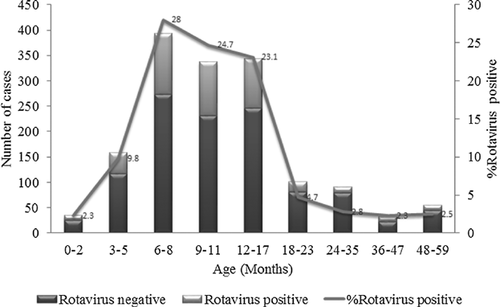
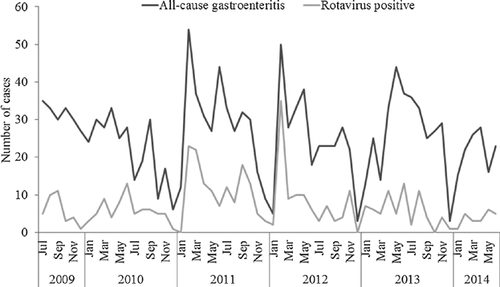
A total of 1,546 fecal specimens were collected from infants and children hospitalized at Kiambu County Hospital from July 2009 to June 2014. Of these, 429 were found to be positive for RVA by ELISA, representing a prevalence rate of 27.5% (Table I). RVA was detected most frequently in infants and young children aged <18 months (87.6%) with a peak at 6–17 months. There was a drastic reduction in the number of cases after 18 months of age (12.4%) (Fig. 1). Hospital admissions due to RVA gastroenteritis persisted year-round, with seasonal peaks in February, March, June or September depending on the year (Fig. 2).
| Year | Gastroenteritis cases | RVA-positive cases | % Positive |
|---|---|---|---|
| 2009a | 188 | 34 | 18.1 |
| 2010 | 263 | 70 | 26.6 |
| 2011 | 352 | 135 | 38.3 |
| 2012 | 294 | 100 | 34.0 |
| 2013 | 319 | 69 | 21.6 |
| 2014b | 130 | 21 | 16.2 |
| Total | 1,546 | 429 | 27.5 |
- a Data for July–December only.
- b Data for January–June only.
Distribution of G and P Genotypes
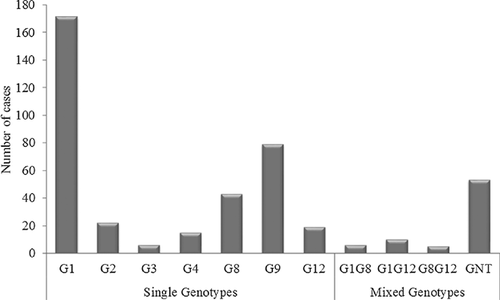
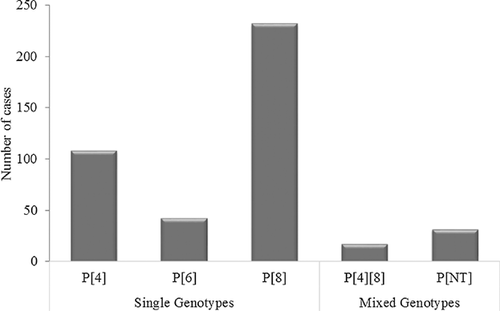
The 429 samples positive for RVA by ELISA were subjected to G and P genotyping by multiplex semi-nested RT-PCR. A total of seven different G genotypes and three different P genotypes were detected. Among the G genotypes, G1 predominated (39.9%), followed by G9 (18.4%), G8 (10.0%), G2 (5.1%), G12 (4.4%), G4 (3.5%), and G3 (1.3%). Mixed G genotypes constituted 4.8% of the G genotypes detected (Fig. 3). The G types of the remaining samples (12.4%) could not be determined. Of the P genotypes, P[8] predominated (53.8%), followed by P[4] (25.2%), P[6] (9.8%) and mixed infection, P[4][8] (4.0%) (Fig. 4). The P types of 31 samples (7.2%) could not be determined.
Distribution of G-P Combinations
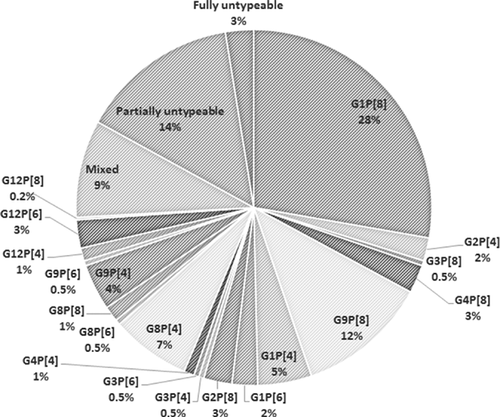
Based on the global distribution of G-P combinations, various G-P combinations were classified into two groups: usual combinations (G1P[8], G2P[4], G3P[8], G4P[8], and G9P[8]) and unusual combinations (any combinations other than the usual ones). Five usual and 14 unusual combinations of G and P genotypes were detected in 42% and 32% of the RVAs, respectively. Of the usual combinations, G1P[8] was predominant (28%), followed by G9P[8] (12%). The unusual G-P combinations included G8P[4] (7%), G1P[4] (5%), G9P[4] (4%), G2P[8] (3%), G12P[6] (3%), G1P[6] (2%), and others (Table II and Fig. 5). Besides the single strain infections, mixed infections were detected in 9% of the cases.
| Number of RVA strains in a year (%) | |||||||
|---|---|---|---|---|---|---|---|
| GP combination | 2009a | 2010 | 2011 | 2012 | 2013 | 2014b | Total |
| Usual | |||||||
| G1P[8] | 5 (15) | 23 (33) | 24 (18) | 18 (18) | 40 (58) | 9 (43) | 119 (28) |
| G2P[4] | 0 | 2 (3) | 5 (4) | 2 (2) | 0 | 0 | 9 (2) |
| G3P[8] | 0 | 0 | 0 | 0 | 0 | 2 (10) | 2 (0.5) |
| G4P[8] | 0 | 3 (4) | 7 (5) | 1 (1) | 0 | 0 | 11 (3) |
| G9P[8] | 0 | 9 (13) | 40 (30) | 2 (2) | 0 | 0 | 51 (12) |
| Subtotal of usual ones | 5 (15) | 37 (53) | 76 (56) | 23 (23) | 40 (58) | 11 (52) | 192 (45) |
| Unusual | |||||||
| G1P[4] | 0 | 3 (4) | 6 (4) | 6 (6) | 5 (7) | 1 (5) | 21 (5) |
| G1P[6] | 0 | 3 (4) | 1 (1) | 2 (2) | 2 (3) | 2 (10) | 10 (2) |
| G2P[8] | 0 | 2 (3) | 5 (4) | 3 (3) | 1 (1) | 0 | 11 (3) |
| G3P[4] | 0 | 2 (3) | 0 | 0 | 0 | 0 | 2 (0.5) |
| G3P[6] | 0 | 0 | 1 (1) | 0 | 0 | 1 (5) | 2 (0.5) |
| G4P[4] | 1 (3) | 0 | 1 (1) | 1 (1) | 0 | 1 (5) | 4 (1) |
| G8P[4] | 3 (9) | 3 (4) | 12 (9) | 11 (11) | 2 (3) | 0 | 31 (7) |
| G8P[6] | 0 | 0 | 1 (1) | 1 (1) | 0 | 0 | 2 (0.5) |
| G8P[8] | 0 | 0 | 2 (1) | 4 (4) | 0 | 0 | 6 (1) |
| G9P[4] | 12 (35) | 3 (4) | 2 (1) | 1 (1) | 0 | 0 | 18 (4) |
| G9P[6] | 2 (6) | 0 | 0 | 0 | 0 | 0 | 2 (0.5) |
| G12P[4] | 0 | 1 (1) | 0 | 4 (4) | 0 | 0 | 5 (1) |
| G12P[6] | 0 | 2 (3) | 1 (1) | 8 (8) | 0 | 0 | 11 (3) |
| G12P[8] | 0 | 0 | 0 | 1 (1) | 0 | 0 | 1 (0.2) |
| Subtotal of unusual ones | 18 (53) | 19 (27) | 32 (24) | 42 (42) | 10 (14) | 5 (24) | 126 (29) |
| Mixed | 0 | 0 | 1 (1) | 34 (34) | 3 (4) | 0 | 38 (9) |
| Partially untypeable | 7 (21) | 11 (16) | 22 (16) | 1 (1) | 16 (23) | 5 (24) | 62 (14) |
| Fully untypeable | 4 (12) | 3 (4) | 4 (3) | 0 | 0 | 0 | 11 (3) |
| Total | 34 | 70 | 135 | 100 | 69 | 21 | 429 |
- a Data for July–December only.
- b Data for January–June only.
Yearly Change of G-P Genotype Distribution
Some differences in the G-P genotype distribution were observed year by year. The most dominant G-P combinations were G9P[4] in 2009, G9P[8] in 2010–2011, and G1P[8] in 2012–2014 (Table II). The major G-P combination shifted from G9P[8] to G1P[8] in 2012. The prevalence of unusual G8 and G12 decreased significantly after 2013.
Association of G-P Genotypes With Age
The age specific distribution of G-P genotypes is shown in Table III. We observed apparent variation in the G-P genotype distribution among children of different age groups. There was a tendency that the RVAs with unusual G-P combinations were detected more frequently in the younger age groups. The ratios of unusual G-P combination/usual G-P combination were as follows: 19/20 (0.95) in 52 RVA strains in 0–5 months, 69/98 (0.70) in 226 RVA strains in 6–11 months, 32/59 (0.54) in 118 RVA strains in 12–23 months, and 6/15 (0.40) in 33 in RVA strains in 24–59 months.
| Number (%) of RVA strains per age group | |||||
|---|---|---|---|---|---|
| Strain | 0–5 | 6–11 | 12–23 | 24–59 | Total |
| Usual | |||||
| G1P[8] | 10 (19) | 52 (23) | 45 (38) | 12 (36) | 119 (28) |
| G2P[4] | 1 (2) | 6 (3) | 1 (1) | 1 (3) | 9 (2) |
| G3P[8] | 1 (2) | 0 | 1 (1) | 0 | 2 (0.5) |
| G4P[8] | 2 (4) | 5 (2) | 4 (3) | 0 | 11 (3) |
| G9P[8] | 6 (12) | 35 (15) | 8 (7) | 2 (6) | 51 (12) |
| Subtotal of usual ones | 20 (38) | 98 (43) | 59 (50) | 15 (45) | 192 (45) |
| Unusual | |||||
| G1P[4] | 3 (6) | 11 (5) | 6 (5) | 1 (3) | 21 (5) |
| G1P[6] | 0 | 6 (3) | 4 (3) | 0 | 10 (2) |
| G2P[8] | 1 (2) | 7 (3) | 3 (3) | 0 | 11 (3) |
| G3P[4] | 0 | 1 (0.4) | 1(1) | 0 | 2 (0.5) |
| G3P[6] | 0 | 1 (0.4) | 1(1) | 0 | 2 (0.5) |
| G4P[4] | 0 | 1 (0.4) | 3 (3) | 0 | 4 (1) |
| G8P[4] | 7 (13) | 16 (7) | 6 (5) | 2 (6) | 31 (7) |
| G8P[6] | 1 (2) | 1 (0.4) | 0 | 0 | 2 (0.5) |
| G8P[8] | 0 | 5 (2) | 1(1) | 0 | 6 (1) |
| G9P[4] | 4 (8) | 12 (5) | 2 (2) | 0 | 18 (4) |
| G9P[6] | 0 | 2 (1) | 0 | 0 | 2 (0.5) |
| G12P[4] | 0 | 1 (0.4) | 2 (2) | 2 (6) | 5 (1) |
| G12P[6] | 3 (6) | 5 (2) | 2 (2) | 1 (3) | 11 (3) |
| G12P[8] | 0 | 0 | 1(1) | 0 | 1 (0.2) |
| Subtotal of unusual ones | 19 (37) | 69 (31) | 32 (27) | 6 ((18) | 126 (29) |
| Mixed | 6 (12) | 17 (8) | 9 (8) | 6 (18) | 38 (9) |
| Partially untypeable | 7 (13) | 33 (15) | 17 (14) | 5 (15) | 62 (14) |
| Fully untypeable | 0 | 9 (4) | 1(1) | 1 (3) | 11 (3) |
| Total | 52 | 226 | 118 | 33 | 429 |
Phylogenetic Analysis of Some Kenyan HuRVAs
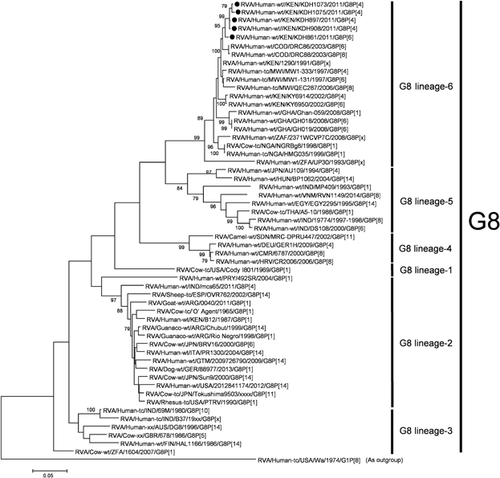
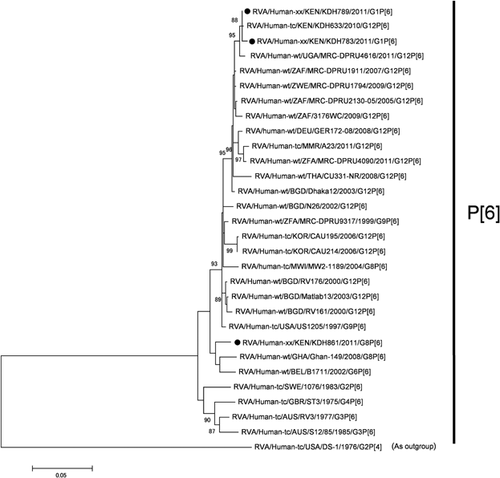
Among the unusual G or P genotypes, G8 and G12 of the G types, and P[6] of the P types have been the characteristic genotypes in Kenya. The whole genomic analysis of the G12 RVAs was carried out previously [Komoto et al., 2014]. In this study, we analyzed the VP7 gene sequences of five G8 strains: KDH861 (G8P[6]), KDH897 (G8P[4]), KDH908 (G8P[4]), KDH1073 (G8P[4]), and KDH1075 (G8P[4]), and the VP4 gene sequences of three P[6] strains: KDH783 (G1P[6]), KDH789 (G1P[6]), and KDH861 (G8P[6]).
On phylogenetic analysis, all the five Kenyan G8 VP7 gene sequences were grouped in the same cluster in lineage 6, which includes most African G8 strains (Fig. 6). The identities of the VP7 gene sequences among the G8 strains in lineage 6 were very high: 98.5–99.6%. On phylogenetic analysis of the VP4 gene sequences of three Kenyan P[6] strains, the VP4 gene sequences of KDH783 (G1P[6]) and KDH789 (G1P[6]) were found to be very similar to that of Kenyan G12P[6] strain (KDH633), but were distinct from that of KDH861 (G8P[6]) (Fig. 7).
DISCUSSION
The objective of this study was to determine the prevalence and molecular epidemiology of RVA gastroenteritis in Central Kenya before the introduction of RVA vaccine into the country's national immunization program. In this study, RVA was detected in 27.5% of children <5 years of age hospitalized with acute gastroenteritis. This finding is consistent with those from previous studies in different regions of Kenya indicating an overall high prevalence of RVA infection in the country [Kiulia et al., 2008; Nokes et al., 2008; Mwenda et al., 2010; van Hoek et al., 2012].
RVA infections occurred in all age groups from 0 to 59 months, with a peak at 6–17 months of age. Interestingly, we could detect RVA in seven neonates (1.6%). A similar phenomenon of RVA infecting infants early in life is common in developing countries [Cunliffe et al., 1998; Glass et al., 2013], and is noteworthy in the contextual definition of an optimal RVA immunization schedule. Ideally, an optimally effective vaccination schedule should aim to induce immunity before a sizeable proportion of the target population acquires natural infection. Thus, completion of the rotavirus immunization schedule early in infancy is desirable for such a low-income setting as Kenya in order to maximize the vaccine impact. In addition, there was a drastic reduction in the number of cases of RVA infection among children aged >18 months (12.4%). This finding concurs with the WHO Strategic Advisory Group of Expert (SAGE)'s observation that providing RVA vaccine to children >24 months of age will be of little benefit [WHO, 2012b].
In this study, RVA was found year-round with some seasonal peaks depending on the year. This observation is consistent with recent country-level assessment of RVA epidemiology conducted in various tropical countries in anticipation of RVA vaccination programs [Levy et al., 2009]. The assessment revealed that seasonal peaks occur year-round in different tropical countries and can vary over time in the same country. However, the effect of such seasonal changes on RVA infection is not as extreme as is seen in temperate areas of the world [Cook et al., 1990]. One possible explanation for this is that less climatic variability exists in tropical zones, so variations in climatological variables are not large enough to cause an effect similar to that in temperate areas [D'Souza et al., 2008; Atchison et al., 2010]. Nonetheless, the fact that RVA responds to climatic changes in many different climatic zones throughout the world suggests that paying close attention to local climatic conditions may help improve our understanding of the transmission and epidemiology of RVA disease.
Remarkable genetic diversity of RVA strains, characterized by substantial frequencies of unusual and emerging genotypes, was observed in this study. Of the seven G genotypes detected, G1 predominated, followed by G9, G8, G2, and G12. The prevalence of G1 has remained predominantly high in various settings in Kenya over the last three decades [Kiulia et al., 2008; Nyangao et al., 2010; Nokes et al., 2010]. In this study, the unusual association of G1 with P[4] and P[6] is noteworthy. The G9 strain was found mainly associated with P[4] and P[8]. The G9 strain was detected first in the late 1990s in Kenya, and has displayed a marked fluctuating prevalence in different settings in the country from time to time [Steele and Ivanoff, 2003; Kiulia et al., 2008]. The G9 strain was not detected in this study in 2013 and 2014. As a whole, the major G-P combinations shifted from G9P[8] to G1P[8] in 2012.
Globally uncommon G8 strains, in association with P[4], P[8] and P[6], were detected at considerably high prevalence rates (11% and 16%) in 2011 and 2012, respectively. However, the proportion of G8 strains declined in 2013 and 2014 in this study. The G8 strains were identified for the first time in Kenya in the early 1990's [Nakata et al., 1999], and various studies have described their prevalence in the country to range from 4.7% to 16.6% [Nokes et al., 2010; Nyangao et al., 2010; Kiulia et al., 2014]. G8 strains has become increasingly prevalent in many parts of Africa [Cunliffe et al., 1998; Mwenda et al., 2010], and have been recovered sporadically from humans and animals like pigs and cows worldwide [Esona et al., 2009].
The substantially high prevalence of the worldwide emerging G12 strains (15%), in combination with P[6], P[4], and P[8], observed in 2012 confirms the growing transmission and increased medical importance of these strains in Kenya. G12 genotypes, first identified in 1987 [Taniguchi et al., 1990; Urasawa et al., 1990], have increasingly been identified in several African countries in the recent past [Page et al., 2009; Cunliffe et al., 2009; Oluwatoyin et al., 2012; Ndze et al., 2013].
The globally usual G genotypes G2, G3, and G4 circulated at remarkably low frequencies during the study period. Of noteworthy, G3 which predominantly circulated in Kenya in the late 1990s and early 2000s, was found to be notably absent in the recent studies conducted in the country [Kiulia et al., 2008], and this strain seems to be vanishing from circulation in Kenya. A similar temporal decline of G2, G3 and G4 in Africa has been reported [Bányai et al., 2012]. Such natural changes in the prevalence of rotavirus strains will be important to consider when assessing the impact of vaccination on the RVA strain distribution in a country. During the study, we also detected a substantial amount of mixed infections, including both the unusual and emergent combinations. The epidemiological implications of these mixed infections and unusual strains remain to be elucidated. Nonetheless, the high proportions of these strains point to possible natural reassortment events arising from co-circulating local strains. Complete genome sequencing of the strains would be necessary to help to determine any degree of natural reassortment.
There was a tendency that unusual G-P combinations were detected more in the younger age groups. In the older age groups, the cases may have had sufficient immune potency of cross-protection against the various genotypes through multiple infections against HuRVAs. The vaccine efficacy against the unusual genotypes such as G8 and G12 and unusual G-P combinations should be evaluated in future.
On phylogenetic analysis, all the five Kenyan G8 VP7 gene sequences were grouped in the same cluster in lineage 6, which is composed of African G8 strains, showing the geographic segregation of G8 RVAs in Africa. Two G1P[6] and one G8P[6] strain were grouped into distinct clusters, indicating that there are at least two groups of P[6] RVAs prevailing in Kenya.
There are conceivable issues on the relationships between rotavirus vaccine efficacy and G-P genotype distribution and between rotavirus vaccine introduction and emergence of selected G-P genotypes. The findings in this study will contribute to the national baseline data on RVA disease burden and the molecular epidemiology in Kenya before vaccine introduction. The data will be basically useful for assessing the impact and effectiveness of the RVA vaccine, and for monitoring any possible changes in the epidemiology and evolution of field strains under vaccine immune selective pressure.
ACKNOWLEDGMENTS
We wish to thank the Director of the Kenya Medical Research Institute for his collaborative support.


