In Vivo MRI Tracking of Degradable Polyurethane Hydrogel Degradation In Situ Using a Manganese Porphyrin Contrast Agent
Eric Tawagi and Kyle D. W. Vollett are co-first authors and contributed equally to this work.
Grant Support: This work was supported by the Natural Sciences and Engineering Research Council of Canada (grant #RGPIN-2019-06137), Canada Foundation for Innovation/Ontario Research Fund (grant #34038), Translational Biology and Engineering Program Seed Grant, and the Dean's Spark Professorship (to H-L.M.C.). E.T. is funded by an NSERC postgraduate scholarship—doctoral. K.D.W.V. is funded by an Ontario Graduate Scholarship. D.A.S. was funded by an Ontario Graduate Scholarship.
Abstract
Background
A noninvasive method to track implanted biomaterials is desirable for real-time monitoring of material interactions with host tissues and assessment of efficacy and safety.
Purpose
To explore quantitative in vivo tracking of polyurethane implants using a manganese porphyrin (MnP) contrast agent containing a covalent binding site for pairing to polymers.
Study Type
Prospective, longitudinal.
Animal Model
Rodent model of dorsal subcutaneous implants (10 female Sprague Dawley rats).
Field Strength/Sequence
A 3-T; two-dimensional (2D) T1-weighted spin-echo (SE), T2-weighted turbo SE, three-dimensional (3D) spoiled gradient-echo T1 mapping with variable flip angles.
Assessment
A new MnP-vinyl contrast agent to covalently label polyurethane hydrogels was synthesized and chemically characterized. Stability of binding was assessed in vitro. MRI was performed in vitro on unlabeled hydrogels and hydrogels labeled at different concentrations, and in vivo on rats with unlabeled and labeled hydrogels implanted dorsally. In vivo MRI was performed at 1, 3, 5, and 7 weeks postimplantation. Implants were easily identified on T1-weighted SE, and fluid accumulation from inflammation was distinguished on T2-weighted turbo SE. Implants were segmented on contiguous T1-weighted SPGR slices using a threshold of 1.8 times the background muscle signal intensity; implant volume and mean T1 values were then calculated at each timepoint. Histopathology was performed on implants in the same plane as MRI and compared to imaging results.
Statistical Tests
Unpaired t-tests and one-way analysis of variance (ANOVA) were used for comparisons. A P value <0.05 was considered to be statistically significant.
Results
Hydrogel labeling with MnP resulted in a significant T1 reduction in vitro (T1 = 517 ± 36 msec vs. 879 ± 147 msec unlabeled). Mean T1 values of labeled implants in rats increased significantly by 23% over time, from 1 to 7 weeks postimplantation (651 ± 49 msec to 801 ± 72 msec), indicating decreasing implant density.
Data Conclusion
Polymer-binding MnP enables in vivo tracking of vinyl-group coupling polymers.
Evidence Level
1.
Technical Efficacy
Stage 1.
Tracking biomaterials for soft-tissue engineering in preclinical and clinical settings is challenging.1, 2 Although scientists often use in vitro models to assess biomaterial designs for determining the desired mechanical and chemical properties, evaluating the impact on the biomaterial from a systemic response requires animal experiments.3 However, methods for studying biomaterial implants to obtain requisite data on material erosion (mandatory for US Food and Drug Administration approval of new materials4) are invasive.5 Specifically, materials are explanted at different timepoints for weight/volume measurements, histology, and other ex vivo analyses, a procedure practiced on animals but ethically not feasible in humans. Additional shortcomings exist with this procedure, given that measuring longitudinal response is precluded and many animals must be sacrificed at each timepoint over the predicted lifetime of the implant to monitor its in vivo behavior.6 Because measurements are not taken longitudinally in the same animal, interindividual differences can mask the true response. Real-time imaging may overcome these limitations by monitoring degradation in all animals at all timepoints.
In this context, MRI and computed tomography are medical imaging modalities with high spatial resolution and unlimited tissue penetration and have been applied previously for noninvasive in vivo biomaterial tracking.2, 7, 8 However, newer materials in tissue regeneration that aim to mimic natural tissue have become increasingly challenging to distinguish from surrounding native tissue that exhibits similar contrast.9 Even on MRI, which offers excellent soft tissue contrast, implant identification can be tricky unless an MR contrast agent is employed to label the implant. Most previous studies have utilized an iron oxide-based negative or “dark” contrast agent for labeling.10, 11 Although these T2 agents afford high detection sensitivity, they are fraught with numerous shortcomings, including distortion of implant shape and extent, obliteration of nearby tissue signal, and lack of distinction from abundant endogenous sources of negative contrast (eg air/tissue interfaces, blood clots, or iron deposits).10, 12 Alternatively, positive or “bright” contrast agents, based on gadolinium or manganese (Mn), could provide improved detection specificity, as very few endogenous species have naturally high signal on T1-weighted imaging.13 Furthermore, T1 agents preserve implant shape and size and have the potential to quantify biomaterial content directly.7, 14, 15
However, previous studies in material labeling7, 14 do not provide a covalent binding mechanism necessary for quantitative tracking of material degradation in vivo. In those studies, the high thermodynamic and kinetic stability of porphyrins against metal dissociation were exploited to limit Mn from leaching, and the non-self-aggregating nature of MnP enabled uniform distribution within the biomaterial, but there was no guarantee that the label degraded “with” the biomaterial.16 In designing a covalent binding mechanism, one must also give special attention to polymeric materials, because covalent labeling must be performed during polymer propagation and cannot compromise binding stability or polymer chain growth.
The objective of this study was 2-fold: 1) to design a T1-contrast MnP contrast agent for covalently labeling polymers via free-radical polymerization (eg polymethacrylates, poly[vinyl alcohol], poly[ethylene glycol], polyethylene, and Teflon), and 2) to demonstrate in vitro and in vivo the ability to quantitatively monitor the degradation of a labeled polyurethane/polyacrylic acid hydrogel with regenerative properties.17, 18
Materials and Methods
This study was approved by the University of Toronto's Animal Care Committee (protocol #20012193). All procedures were conducted in accordance with the Canadian Council on Animal Care. Complete reaction conditions and additional details are provided in the Supplementary Information S1.
Chemicals for Synthesis
The base porphyrin 5-(4-aminophenyl)-10,15,20-(tri-4-sulfonatophenyl) porphyrin triammonium (Apo-NH2) was purchased from PorphyChem (Dijon, France, MW = 921.03 g/mol). 2-Aminoethyl methacrylate hydrochloride was purchased from ACROS Organics (The Hague, Netherlands). Mn chloride (MnCl2), 10% formalin, 4-(2-hydroxyethyl)piperazine-1-ethanesulfonic acid (HEPES), N,N-diisopropylethylamine (DIPEA), sodium bicarbonate (NaHCO3), ammonium acetate (NH4OAc), hydrochloride (HCl), and phosphate buffered saline (PBS) were purchased from Sigma-Aldrich (Steinheim, Germany). All chemicals were of appropriate analytical grade and were used without further purification.
Synthesis of MnP Vinyl Agent
In brief, the amine-functionalized porphyrin precursor, Apo-NH2, was reacted with MnCl2 and DIPEA in dimethylformamide (DMF) at 135 °C for 3 hours to form MnP-NH2. The product, MnP-NH2, was then reacted with excess thiophosgene in chloroform to yield isothiocyanate MnP (MnP-NCS), which is an isothiocyanate coupling agent to both protic and aprotic nucleophiles (Fig. S1 in the Supplemental Material). MnP-NCS was then conjugated to 2-aminoethyl methacrylate in aqueous NaHCO3 buffer at room temperature until completion to form a stable thiourea linkage between the porphyrin and the vinyl moiety and to yield MnP-vinyl. The un-metalated molecules, Apo-NCS and Apo-vinyl, were synthesized as reference control agents, using an identical protocol except that an un-metalated precursor (Apo-NH2) was used. The agents were characterized by infrared spectroscopy (FTIR, Nicolet iS50, Thermo Scientific, Madison, WI, USA), mass spectroscopy (Agilent 6538 UHD, Santa Clara, CA, USA), ultraviolet/visible light spectroscopy (UV/vis, Beckman Coulter DU 800, Brea, CA, USA), thin-layer chromatography (TLC, Silica Gel 60 F254, Millipore, Darmstadt, Germany), and nuclear MR spectroscopy (500 MHz Agilent DD2 NMR Spectrometer, Santa Clara, CA, USA).
MnP Labeling of Polyurethane/Polyacrylic Acid Hydrogel
Polyurethane/polyacrylic acid hydrogels were prepared according to a published protocol.19 All steps were performed in a Class II biological safety cabinet. In brief, the in-house synthesized polyurethane crosslinker and acrylic acid in a 50:50 weight percent were dissolved into each other overnight along with 0.3% weight of 2-hydroxy-2-methylpropiophenone photo-initiator (Sigma-Aldrich, Oakville, Ontario, Canada). MnP-vinyl agent was dissolved in ultrapure water at concentrations ranging from 0 mg/mL to 5 mg/mL and added to the acrylate solution to yield a 20% volume of aqueous solution to weight of resin. The solution was mixed for 1 hour and sterile-filtered through a 0.22 μm filter (MilliPore, Oakville, Ontario, Canada). The solution was then pipetted into a polypropylene 96-well plate (Greiner Bio-One, Monroe, NC, USA) and irradiated with UV light (λmax = 365 nm; FireEdge 300, Phoseon Technology, Hillsboro, OR, USA) for 1 minute to initiate free-radical polymerization of the acrylate groups. The crosslinked discs were collected from the 96-well plate. The extent of reacted vinyl groups in the discs was determined by FTIR. The discs were then washed thrice with ethanol and incubated in sterile Dulbecco's phosphate buffered saline (DPBS −/−, Sigma-Aldrich, Canada) for 7 days until equilibrium water uptake was achieved with DPBS replacement on each day. The hydrated discs were used for in vivo experimental studies.
Leaching of MnP from Hydrogel
The retention and stability of MnP (and Apo-MnP) in hydrogel were assessed in vitro and compared to a relative control nonbinding agent, 5,10,15,20-tetrakis(4-sulfonatophenyl)-21H,23H-porphine Mn (III) chloride (Mn-TPPS4, MW = 1023.36 g/mol; Sigma-Aldrich, Canada). Hydrogels were labeled with the covalently binding MnP or Apo-MnP agent or the control Mn-TPPS4 agent, as described previously.2, 7 Hydrogels were then immersed in DPBS at 37 °C in a sealed container to prevent evaporation. The concentration of free agent (MnP, λ = 466 nm or Apo-MnP, λ = 435 nm) in the solution was measured at defined timepoints (2, 7, 23, and 28 days) by UV/vis spectroscopy. Fresh buffer was replenished at every timepoint.
In Vitro MRI of Labeled Hydrogel Discs
In vitro imaging was conducted on phantoms to test and optimize the labeling concentration for adequate sensitivity of detection on MRI. Hydrogel discs labeled with specific concentrations of MnP agent (0, 0.08, 0.4, and 4 ppm) were prepared and loaded in a polystyrene plate and immersed in DPBS. Imaging was performed on a clinical 3 T whole body MRI scanner (Achieva 3.0 T TX, Philips Medical Systems, Best, The Netherlands) using a 32-channel transmit/receive head coil. High-resolution T1-weighted images were acquired using a two-dimensional (2D) spin-echo (SE) sequence: repetition time (TR) = 100 msec, echo time (TE) = 14.1 msec, 120 mm field of view (FOV), 3 mm slice thickness, 0.5 mm × 0.5 mm in-plane resolution, and number of signal averages (NSA) = 8. High-resolution T2-weighted images were acquired using a 2D turbo SE (TSE) sequence: TR = 3000 msec, TE = 80 msec, NSA = 2, echo train length = 8. Quantitative T1 relaxation times were measured using a 2D inversion recovery TSE sequence: inversion times (TIs) = (50, 100, 250, 500, 750, 1000, 1250, 1500, 2000, 2500) msec, TR = 3000 msec, TE = 18.5 msec, TSE factor = 4, 3 mm slice thickness, and 0.5 mm × 0.5 mm in-plane resolution. Quantitative T2 relaxation times were measured using a multiecho SE sequence: 32 echoes with TE spacing = 7.63 msec, TR = 2000 msec.
MRI data were transferred to a workstation for quantitative analysis using in-house software developed in MATLAB (version 9.10; MathWorks Inc., Natick, MA, USA). Calculations of T1 and T2 relaxation times were performed on a pixel-by-pixel basis over the entire image Briefly, T1 was calculated using a variable flip angle approach.20 T2 was calculated by curve-fitting to a mono-exponential decay with constant offset.21 Average T1 and T2 values were computed for each hydrogel within the hydrogel border detected automatically using Matlab's edge detection algorithm on T1-weighted SE images.
In Vivo Animal MRI of Implanted Hydrogel Discs
Four- to six-week-old Sprague–Dawley female rats (N = 8) were purchased from Charles River Laboratories (Laval, Quebec, Canada). Rats were acclimatized for 1 week following delivery. Hydrogel discs (10 mm diameter × 1 mm height) were implanted subcutaneously on the dorsal side of the animals. The dorsal subcutaneous space was chosen because it facilitated identification of unlabeled implants by virtue of the distinctive proximal dermal protrusion caused by the implant.22
Meloxicam (Boehringer Ingelheim, Burlington, Ontario, Canada) was administered subcutaneously for analgesia preoperatively and postoperatively for up to 3 days following surgery. Each animal had up to six labeled or unlabeled discs implanted in the dorsum, three on either side of the midline and spaced 10 mm apart. In some animals, both labeled and unlabeled discs were randomly distributed in the same animal for direct comparison of the discs, while in other animals, only labeled or only unlabeled discs were implanted. If explantation was required, an incision was made at the implant site, the disc removed, and the incision sutured.
Live animal imaging was performed on the same 3 T scanner (Achieva 3.0 T TX) with an 8-channel receive-only wrist coil. The rats were anesthetized on 3% isoflurane delivered in 100% oxygen (2.0 L/min flowrate) and maintained on 1.5% isoflurane (Fresenius Kabi Canada Ltd., Toronto, Ontario, Canada). The animal was placed prone, feet first into the scanner and kept warm on a heated water-blanket. Imaging was performed on 8, 22, 36, and 50 days after implantation, also referred to as 1, 3, 5, and 7 weeks postimplantation, respectively. To visualize anatomic details, sagittal high-resolution T1-weighted and T2-weighted SE images were acquired. T1-weighted images were acquired using a 2D SE sequence with fat suppression: TR = 1666 msec, TE = 14.3 msec, 130 mm FOV, 1 mm slice thickness, 0.5 mm × 0.5 mm in-plane resolution, and NSA = 3. T2-weighted images were acquired using a 2D TSE sequence: TR = 4000 msec, TE = 75 msec, NSA = 2, 1 mm slice thickness, and 0.5 mm × 0.5 mm in-plane resolution. Quantitative T1 relaxation times were measured using a three-dimensional (3D) spoiled gradient echo (SPGR) sequence with variable flip angles20: flip angles (FAs) = [2°, 10°, 20°], TR = 6.8 msec, TE = 3.6 msec, NSA = 8, 1 mm slice thickness, and 0.5 mm × 0.5 mm in-plane resolution.
MRI Data Analysis
T1-weighted SE and SPGR images were visually inspected to distinguish implants (by virtue of bright contrast) from surrounding tissue, and T2-weighted FSE images were inspected to identify regions of edema from an inflammatory response (E.T. 7 years of experience, H.L.M.C. 23 years of experience).
An automated MATLAB script developed in-house (version 1.0, developer HLMC, Toronto, Ontario, Canada) for segmentation of each labeled implant and calculation of mean T1 and median T1. First, a region of interest (ROI) encompassing an area of the background muscle adjacent to the implant was selected on a T1-weighted SPGR image. The T1-weighted SGPR signals of all pixels in the background muscle ROI were averaged and used as the background T1-weighted SPGR signal. Next, a threshold multiplier (=1.8) was chosen such that only pixels with a T1-weighted SPGR signal higher than the background T1-weighted signal multiplied by 1.8 were selected. Then, an ROI encompassing the implant on every slice through which the implant traversed was selected.
The MATLAB script then computed and reported the statistics (mean T1, median T1, number of pixels, and standard deviation) for all pixels segmented by virtue of being above the threshold T1-weighted SPGR signal for all slices encompassing the implant. Thus, the averaged T1 values represented values over the entire 3D volume of the implant, and the total number of pixels corresponded to the volume of the implant. This script was repeated for each labeled implant at all imaging timepoints. The threshold multiplier of a given implant taken at the first imaging timepoint (i.e. 1 week) was kept constant for all subsequent timepoints for that implant.
Given the poor contrast between the unlabeled implant and surrounding tissue, the threshold multiplier for the unlabeled implant was at parity to the background T1-weighted SPGR signal. In Matlab, the ROI encompassing the unlabeled implant was manually selected individually for each slice across all slices within a 3D volume of the implant (E.T. 7 years of experience; H.L.M.C. 23 years of experience). Despite the borders of unlabeled implants being indistinct, given their subcutaneous location, it was possible to estimate the borders by virtue of the shape of the overlying skin or the bright T2-related edematous accumulation at early times. The T1 statistics were reported as above. T1 map images representing pixel-wise T1 relaxation times were generated in MATLAB using the Crameri's “batlow” colormap. All other MRI data were generated on the Philips Digital Imaging and Communications in Medicine (DICOM) viewer (Achieva 3.0 T TX).
Toxicity Study and Histology
Organs and implants were excised and placed in 10% neutral buffered formalin (Sigma-Aldrich, Canada) on ice. The fixed tissues were sent to the University Health Network STTARR Pathology Core for paraffin embedding and sectioning. Staining with hematoxylin (Newcomer Supply, Middleton, WI, USA) and eosin (Sigma, Oakville, Ontario, Canada) or with PicroSirius red (Abcam, Toronto, Ontario, Canada) was performed on 5-μm thick tissue sections. Liver, kidney, lungs, spleen, thymus, and heart were examined by light microscopy by a biopathologist blinded to the source of the samples.
Quantitative Determination of Mn Content in Explants by ICP-AES
Implants were collected as described above, separated from skin and native tissue, and digested. Mn content was then quantified by inductively coupled-plasma atomic emission spectroscopy (ICP-AES) at the university's Department of Chemistry ANALEST facility.
Statistical Analysis
Data were analyzed by unpaired t-tests using Excel software (version 16.0; Microsoft Corp., Redmond, WA, USA). A one-way analysis of variance (ANOVA) was used to determine significant changes in T1 and the number of pixels (representing implant volume), with the dependent variable being time. Data are presented as average values of the stated number of replicates. A P value <0.05 was considered statistically significant.
Results
MnP Synthesis and In Situ Polymerization With Degradable Polyurethane Hydrogel
The synthesis of the MnP agent is shown in Fig. 1. The chemical structure of the MnP product was confirmed on nuclear MR (82% purity), mass spectroscopy, ICP-AES, FTIR, and UV–vis. These characterization data are presented in Figs. S2–S8 in the Supplemental Material.
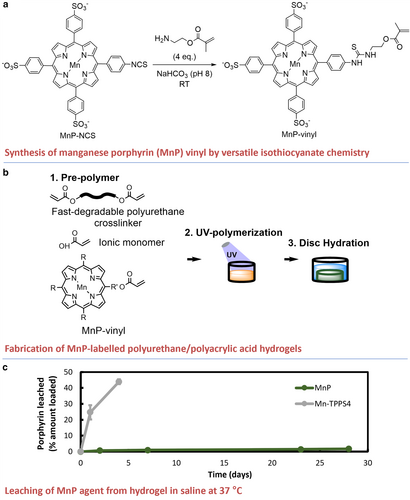
Polyurethane hydrogel discs labeled with defined concentrations of MnP (Fig. 1b) had a green tinge due to MnP light absorption at λ = 466 nm (Fig. S8 in the Supplemental Material). The photopolymerization process with the addition of MnP was effective, which was validated by the disappearance of acrylate groups in the FTIR spectrum of the hydrogels after light curing (95% vinyl conversion, Fig. S9 in the Supplemental Material). The mechanical and physical properties of the discs, including compressive modulus (P = 0.23), water uptake (P = 0.90), and glass transition temperature (qualitative), were statistically unchanged with the addition of MnP (Table S1 and Fig. S10 in the Supplemental Material).
Measurement of leached MnP from hydrogels revealed minimal MnP release (<2% over 28 days) (Fig. 1c). The noncovalently binding Mn-TPPS4 was quickly released from the hydrogel (over 40% within the first 4 days). These findings indicated that covalent bonds conjugating the MnP to the hydrogel were stable. Thus, for the system to remove MnP, hydrogel degradation and product dissolution were required.
Phantom MRI Study of MnP-Labeled Hydrogels
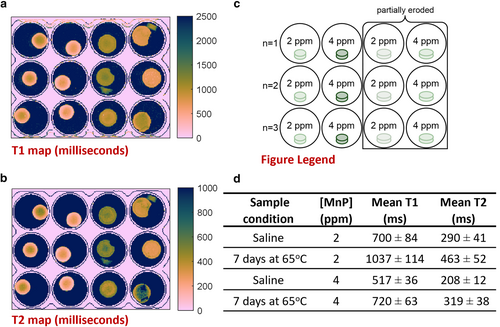
MnP-labeled hydrogel exhibited reduced T1 for sensitive hydrogel detection by MRI. Labeling with 4 ppm MnP significantly reduced T1 (T1 = 517 ± 36 msec vs. 879 ± 147 msec unlabeled), while labeling with 2 ppm MnP did not (T1 = 700 ± 84 msec vs. 879 ± 147 msec unlabeled, P = 0.30) (Fig. 2a, Fig. S11 in the Supplemental Material). Moreover, T1 and T2 maps revealed a reduction in disc contrast over 7 days in DPBS (Fig. 2a,b), which was attributed to the partial erosion of the discs at 65 °C (Fig. 2c,d).
Safety of Contrast Agent In Vivo
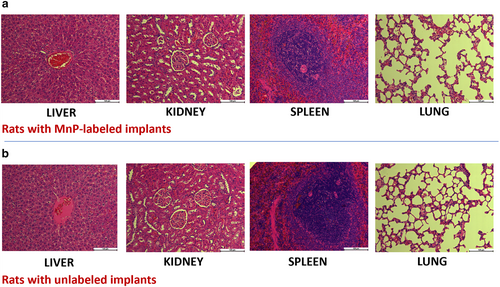
All rats survived and appeared healthy for the 7-week duration of the study. A 7-week histological analysis of the main excretory organs (kidneys, liver) and other major organs of interest (spleen, heart, lungs, and thymus) revealed normal organ structures in rats with either labeled or unlabeled implants (Fig. 3, Fig. S12 in the Supplemental Material).
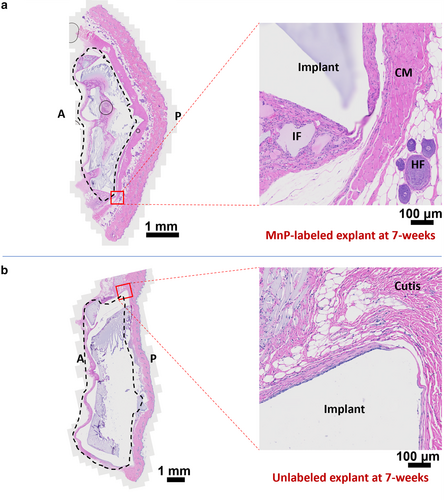
Upon completion of the initial wound healing period of 3 weeks, all groups had healthy skin and coats. Histological analysis of both explants and surrounding tissue revealed minimal foreign body response and fibrosis. Explants were covered by a thin fibrous capsule 20–100 μm thick with a layer of one to three cells across (Fig. 4). Both MnP-labeled and unlabeled groups showed normal histological appearance of the cutaneous muscle, sub-dermis, dermis, and epidermis layers adjacent to the implant. Regardless of whether the hydrogels were labeled or unlabeled, tissue integration was observed with collagen deposition within the voids of the degrading hydrogels (Fig. 4, Fig. S13 in the Supplemental Material). In vivo toxicity analysis suggested that MnP labeling of polymer was safe and did not impact local tissue responses.
MnP-Labeled Hydrogel Implanted in Rats Appeared Brighter Than its Surroundings on T1-Weighted MRI
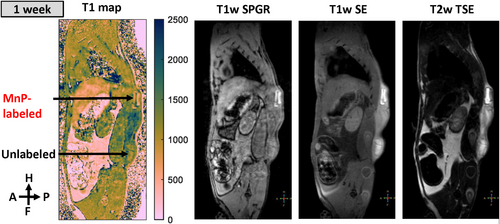
Labeled implants (Fig. S14 in the Supplemental Material) were substantially brighter than surrounding tissue on T1-weighted SPGR images, while unlabeled implants exhibited similar contrast to the surrounding tissue (Fig. 5). Quantitative T1 mapping revealed that T1 of the labeled implants was significantly lower than that of unlabeled implants (41% lower at 1-week postimplantation). The T1 values of MnP-labeled implants were consistent among animals (P = 0.9), independent of implant location (P = 0.3) (Fig. S15 in the Supplemental Material).
Studying the Time Course of Inflammation Using MRI of the Implant Region
On T2-weighted TSE images, the implant region appeared bright at 1 and 3 weeks, which is consistent with accumulation of protein-rich fluid23 (Fig. 6). Thereafter, an overall decrease in T2 signal intensity was observed, which indicated a reduction in protein-rich fluid, decreasing at the highest rate from 1 to 5 weeks. Furthermore, on T2-weighted images at 7 weeks, a small region appeared bright, which was associated with the area between implant fragments (Figs. 6a,b), but the implant fragments themselves were dark.
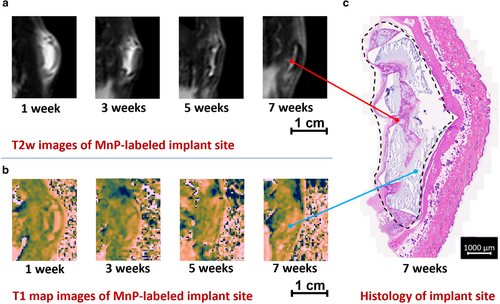
The T1 maps delineated the borders and extent of the MnP-labeled hydrogel, even during the inflammatory period. On a T1 map with an inverted colormap, the MnP-labeled implant appeared bright, whereas edematous fluid appeared dark (Fig. 6b). Unlabeled hydrogel did not permit this distinction, as the hydrogel was also fluid-filled and appeared isointense to edema on T1 map images (Fig. S16 in the Supplemental Material). At week 7, fragments of MnP-labeled implant appeared bright on T1 map images, whereas space between fragments was dark (Fig. 6b). Regardless of the ambiguities seen on T2-weighted images, T1 maps identified implant morphology and contour out to 7 weeks postimplantation.
Implant delineation on T1 maps at 7 weeks corroborated histological assessment (Fig. 6c). In particular, the fragmented morphology of MnP-labeled implants observed on T1 maps was also present on histological sections of the same implant, with correspondence between MRI and histology in regard to implant shape and size. Bright T2 regions corresponded to regions of tissue infiltration within voids of highly degraded hydrogel on histology. This tissue was characterized by numerous blood vessels, immature collagen, and mononuclear cells, which produced a greater T2 signal (Fig. 6c and Fig. S13 in the Supplemental Material).19
In Vivo MRI Tracking of Implant Degradation
The mean T1 value of labeled implants significantly increased by 23% over time from 1 to 7 weeks postimplantation (651 ± 49 msec to 801 ± 72 msec) (Fig. 7a). The gradual increase in mean T1 was attributed to a decrease in the hydrogel's density and to the removal of MnP along with the hydrogel's erosion products. The spatial variance in T1 values throughout the labeled implant, represented by the standard deviation in T1 (Fig. 7c), was lower than that in the unlabeled implant at all timepoints, indicating that the MnP content was homogeneous throughout the implant.

The volume analysis showed that hydrogels followed first-order degradation in volume over the first 5 weeks, followed by a plateauing to 85% reduction in volume after 7 weeks (Fig. 8b). The absolute volume of labeled hydrogels was significantly lower than unlabeled hydrogels over the first 5 weeks but was equal at 7 weeks (Fig. 8a). Furthermore, the volume percentage trended toward a greater reduction for labeled than unlabeled hydrogels at 3 and 5 weeks (P = 0.63 and 0.79, respectively, Fig. 8b).
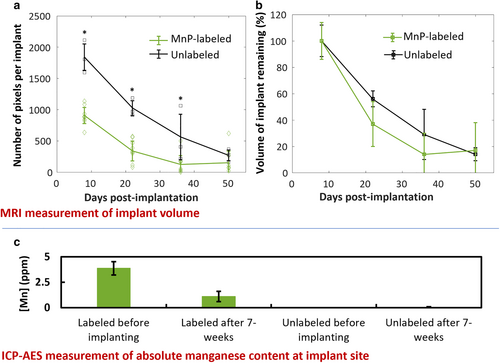
Direct measurement of Mn content by ICP-AES revealed a decrease in MnP in explanted tissues that was proportional to the reduction in implant volume measured by MRI (Fig. 8c). Specifically, the remaining Mn content in explanted tissue at 7 weeks was 29% ± 13%, compared to a remaining volume of 18% ± 19%, which was lower, albeit statistically nonsignificant (P = 0.45). Unlabeled explants had Mn content comparable to that of normal tissue (0.04 ± 0.01 ppm).
Discussion
This study investigated a Mn-based MRI contrast agent for covalently labeling a degradable polyurethane-based biomaterial and assessed in vivo tracking of its resorption noninvasively in a rat model. The addition of the contrast agent to the polymer did not affect the latter's mechanical or physical properties. Due to the covalent nature of binding, <2% of the Mn agent was released over 28 days. A labeling concentration of 4 ppm was shown to afford significant reductions in T1 both in vitro and in vivo. In a 7-week long rat implant study, labeled implants were clearly discriminated from surrounding tissue and edematous fluid, whereas unlabeled implants had ambiguous borders. A degraded morphology could be discerned in labeled implants at 7 weeks, and implant volume assessment on T1-weighted MRI at time of explantation corresponded to the volume measurement made on the explant. Histopathology of the heart, lungs, kidneys, liver, spleen, and thymus revealed no toxicity associated with the Mn agent.
Stable binding between MnP and the polymer is essential to obtain both a sustained signal and an objective assessment of in vivo biodegradation, as noncovalent binding leads to signal loss even in the absence of material degradation and precludes long-term implant monitoring.2, 7 The MnP agent was bound covalently and homogeneously throughout the polymer, and MnP-labeled hydrogel showed a 2-fold reduction in T1. Implant volume could be objectively measured by counting the number of pixels with a T1 below a defined threshold. Erosion of the implant could be assessed by changes in T1 relaxation times. As the hydrogel implant begins degrading, erosion products, along with the bound MnP, leave the implant site, thus giving rise to a gradual increase in T1.19 Thus, an elevation in T1 and concomitant decrease in the T1-weighted signal intensity may indicate lower polymer density. The covalent labeling capacity of the MnP agent could enable precise implant delineation and the ability to measure both hydrogel volume and density.
While conventional T2-weighted imaging does not provide specific identification of unlabeled hydrogels, one can interpret T2-weighted images in conjunction with T1 maps. Specifically, MnP-labeled implants identified on T1 maps can be distinguished from edematous regions on T2-weighted images to understand foreign body reaction. Identification of implant location and contours is best made on T1 maps, as areas of reduced T1 relaxation times are specific to the MnP label. The T1-weighted SPGR images can identify implants, although one must set the flip angle of the acquisition (by setting to the Ernst angle) to maximize signal contrast for a particular T1 value.24 The T2-weighted images could highlight edematous fluid-filled spaces and infiltrated tissue in the voids of disintegrating hydrogels. Co-registering the T1 map and T2-weighted images could distinguish whether implant fragments occupy the same region as edematous fluid. Analysis of the foreign body reaction revealed an acute inflammatory phase up to 3 weeks, marked by edema visible as a high T2-weighted signal.25 After this period of peak inflammation, the T2 signal was reduced, indicating resolution of acute inflammation and resorption of edematous fluid by 5 weeks, which is in agreement with the literature on a minimal foreign body response to non-inflammatory biomaterials.26 By 7 weeks, the implant had degraded and broken into fragments surrounded by newly formed, vascularized tissue, which conferred a bright T2-weighted signal.
Interpreting the changes in inflammation and implant erosion provided insights into the degradation mechanism. The fastest implant volume loss was observed at the highest level of edema from 1 to 3 weeks. Enzymes and reactive oxygen species, which are present in the edematous fluid, are known to increase the degradation rate of polyurethanes.27 This finding suggests that enzymes and reactive oxygen species (ROS) released by immune cells during the acute inflammatory phase accelerated the degradation of the polyurethane hydrogel. In a previous study, a screening tool predicted that the same hydrogel immersed in saline at 37 °C degraded in about 9 months.19 In the present study, the hydrogel degraded much faster when implanted in vivo, as compared to that shown in a previous in vitro study.19 The enzymes, oxidation, and mechanical stress, which in vitro conditions did not replicate, likely contributed to the accelerated degradation rate observed in vivo. While in vitro predictive degradation screens can be helpful, this MRI tracking modality may provide an accurate representation of the biodegradation process of implanted materials.
The safety of any material introduced into the body for an extended interval must be confirmed. In this regard, MnPs and the hydrogel's degradation products are known to be eliminated primarily via the kidney and, to a lesser extent, via the liver.7, 28 The Mn dose in one implant (5 μg/cm3) to achieve adequate detection sensitivity is three orders of magnitude below the dose of a commercial Mn contrast agent (19 mg for a 70 kg person, intravenously administered) and below the tolerable upper intake level of 11 mg/day in humans.29 As for the polymeric vehicle, the materials are derived from a mildly inflammatory platform reported to have outstanding compatibility with multiple cell types and excellent tissue integration in connective and muscle tissues.18, 19 The overall toxicity analysis demonstrated that by the time MnP-labeled implants had degraded by 80%, no systemic toxicity was observed across the local tissues and vital organs.
Translating the methods presented herein is relatively straightforward in a preclinical setting. One would need a chemistry facility to perform synthesis, but the procedure thereafter, including dosing, animal work, and MRI, is commonplace. Clinical translation is a bigger hurdle. Any new compound, such as our MnP agent, must go through rigorous regulatory approvals. If a substantial preclinical demand is demonstrated, however, the path to regulatory acceptance and clinical adoption may be greatly facilitated.
Limitations
The in vivo data showed that MnP-labeled hydrogels were more accurately segmented when compared to their unlabeled counterparts. This higher accuracy might explain the difference in implant volume measurements between labeled vs. unlabeled implants. The latter implants had consistently higher volume measurements due to our inability to define their borders accurately. However, despite better implant delineation with MnP labeling, polymer degradation with time gradually diminished both MnP concentration and T1-weighted signal, thus dampening the definition of the borders and slightly obscuring the observation of polymer fragments. As a result, T1-guided estimates of implant volume made in the presence of substantial degradation may underestimate the true extent of degradation. Small residual material fragments in the long-term explants were observed, but these could not be seen on T1 maps due to minor contrast differences from a low MnP density. This shortcoming accounts for the observation that the remaining implant volume made on MRI was slightly lower than the remaining Mn content measured on ICP-AES.
Another limitation of this study was the low number of animals. Furthermore, even though dorsal subcutaneous implantation is a preferred model in material degradation studies, implantation in specific organs would reveal if there are tissue-related differences in degradation. Finally, while coupling our MnP agent to vinyl polymers was demonstrated in this study, conjugation to other functional groups may also be of interest.
Conclusion
The MnP agent conceived, synthesized, and applied in this study for covalently labeling vinyl polymers demonstrates several unique capabilities in vivo: 1) clear delineation of soft-tissue implant borders, 2) distinction of implant from regions of edema and inflammation, and 3) measurement of implant volume over time, thus enabling direct tracking of implant degradation.


