Evaluation of a PEGylated Fibroblast Growth Factor 21 Variant Using Novel Preclinical Magnetic Resonance Imaging and Magnetic Resonance Elastography in a Mouse Model of Nonalcoholic Steatohepatitis
The first three authors contributed equally to this study.
Abstract
Background
Treatments for nonalcoholic steatohepatitis (NASH) are urgently needed. Hepatic fat fraction and shear stiffness quantified by magnetic resonance imaging (MRI-HFF) and magnetic resonance elastography (MRE-SS), respectively, are biomarkers for hepatic steatosis and fibrosis.
Purpose
This study assessed the longitudinal effects of fibroblast growth factor 21 variant (polyethylene glycol [PEG]-FGF21v) on MRI-HFF and MRE-SS in a NASH mouse model.
Study Type
Preclinical.
Animal Model
This study included a choline-deficient, amino acid-defined, high-fat diet (CDAHFD) model and 6-week-old, male C57BL/6J mice (N = 78).
Field Strength/Sequence
This study was performed using: 3T: gradient-echo two-point Dixon and spin-echo (SE) echo-planar imaging elastography (200 Hz) and 7T: SE two-point Dixon and SE elastography (200 Hz).
Assessment
MRI and MRE were performed before control diet (CD) or CDAHFD (BD), before PEG-FGF21v dosing (baseline), and after PEG-FGF21v treatment (WK4/8). Regions of interest for MRI-HFF and MRE-SS were delineated by J.L. and H.T. (>5 years of experience each). Fibrosis and steatosis were measured histologically after picrosirius red and H&E staining. Alkaline phosphatase, alanine transaminase, bile acids, and triglycerides (TGs) were measured.
Statistical Tests
Two-tailed Dunnett's tests were used for statistical analysis; untreated CDAHFD or baseline was used for comparisons. Imaging and histology/biochemistry data were determined using Spearman correlations. Bayesian posterior distributions for MRE-SS at WK8, posterior means, and 95% credible intervals were presented.
Results
CDAHFD significantly increased baseline MRI-HFF (3T: 21.97% ± 0.29%; 7T: 40.12% ± 0.35%) and MRE-SS (3T: 1.25 ± 0.02; 7T: 1.78 ± 0.06 kPa) vs. CD (3T: 3.45% ± 0.7%; 7T: 12.06% ± 1.4% and 3T: 1.01 ± 0.02; 7T: 0.89 ± 0.06 kPa). At 7T, PEG-FGF21v significantly decreased MRI-HFF (WK4: 28.97% ± 1.22%; WK8: 20.93% ± 1.15%) and MRE-SS (WK4: 1.57 ± 0.04; WK8: 1.36 ± 0.05 kPa) vs. untreated (WK4: 36.36% ± 0.62%; WK8: 30.58% ± 0.81% and WK4: 2.03 ± 0.06; WK8: 2.01 ± 0.04 kPa); 3T trends were similar. WK8 SS posterior mean percent attenuation ratios (RDI) were −68% (−90%, −44%; 3T) and −64% (−78%, −52%; 7T). MRI-HFF was significantly correlated with H&E (3T, r = 0.93; 7T, r = 0.94) and TGs (both, r = 0.92).
Data Conclusions
MRI-HFF and MRE-SS showed PEG-FGF21v effects on hepatic steatosis and fibrosis across 3 and 7T, consistent with histological and biochemical data.
Level of Evidence
1
Technical Efficacy Stage
2
Nonalcoholic fatty liver disease (NAFLD) is the most common type of chronic liver disease, occurring in up to 30% of the US population, and frequently progresses to end-stage liver disease.1 NAFLD is comprised of a spectrum of liver disorders ranging from simple fatty liver to the advanced, progressive form, nonalcoholic steatohepatitis (NASH), with varying levels of fibrosis and cirrhosis.2 NASH has a global incidence of 1.5%–6.5%.1 As the prevalence of obesity and type 2 diabetes continues to increase, NASH prevalence is expected to increase in parallel.3 There is a high unmet need for safe and effective treatments for NASH, as there are no approved drug therapies to treat the disease.
The fibroblast growth factor (FGF) family of metabolic hormones (eg, FGF1, FGF19, and FGF21) are among the novel investigational pharmacotherapies that have been shown to improve lipid metabolism, reduce inflammation, and improve fibrosis in clinical trials of patients with NASH.4 Among these, FGF21 is a non-mitogenic hormone that is a key regulator of lipid and glucose metabolism.5-8 FGF21 may have direct and indirect beneficial effects on NASH and NASH-related fibrosis. Native FGF21 administration in diabetic preclinical models improves glucose and lipid profiles.9 Analogues of FGF21 have been shown to improve insulin sensitivity, lipid profiles, and reduce steatosis and fibrosis in preclinical and clinical studies.10-14 Pegbelfermin, a polyethylene glycol-conjugated (PEGylated) human FGF21 analogue,15 has been shown to improve hepatic steatosis and biomarkers of hepatic injury and fibrosis in clinical trials.16, 17
Histological analysis of liver tissue collected via biopsy is currently the most accurate method of evaluating the steatosis, lobular inflammation, ballooning, and fibrosis characteristic of patients with NASH.18 However, the biopsy procedure is invasive, with risks of patient complications, and is subject to sampling error and interobserver variability due to disease heterogeneity.19 There is an urgent need for noninvasive techniques for diagnosis and monitoring of disease progression and treatment efficacy in NASH. Proton density fat fraction (PDFF) assessed by Dixon methods can now be routinely performed with clinical scanners and has been used in studies to noninvasively evaluate liver fat content20 with excellent accuracy and reproducibility.21-23 Magnetic resonance elastography (MRE), a phase-contrast magnetic resonance imaging (MRI) technique for assessing the mechanical properties of soft tissue, has also emerged as a safe and accurate noninvasive method of diagnosing hepatic fibrosis.24, 25
Longitudinal MRI and MRE data have recently been reported in NASH clinical trials to assess the treatment effects of potential NASH therapies, such as apoptosis signal-regulating kinase 1,26 acetyl-CoA carboxylase,27 farnesoid X receptor,28 FGF21,29 and ezetimibe.20 These studies have shown that MRE is a reliable imaging method for assessing liver stiffness, with good agreement and repeatability at the individual patient level across imager manufacturers, field strengths (1.5 vs. 3T), and pulse sequences (eg, gradient-recalled echo [GRE] vs. spin-echo, echo-planar imaging [SE-EPI]).30
Evidence suggests that liver fibrosis is treatable and reversible with the administration of appropriate antifibrotic treatment.31, 32 There is potential translational value that may be gained by studying MRI hepatic fat fraction (MRI-HFF) and MRE shear stiffness (MRE-SS) paired with traditional histological assessment in a robust animal model of NASH, such as the choline-deficient, amino acid-defined, high-fat diet (CDAHFD) mouse model. The CDAHFD mouse model is a rapidly progressive and robust model of NASH that has been used in the development of effective therapeutics to better understand the disease.12, 33 Thus, the aim of this study was to investigate if a PEGylated FGF21 variant (PEG-FGF21v), administered twice weekly (BIW) for 8 weeks, improves metabolic and fibrotic parameters in the CDAHFD mouse model of NASH and to examine steatosis and fibrosis via novel noninvasive imaging means utilizing MRI-HFF and MRE-SS compared with conventional histological evaluation.
Materials and Methods
Animal Model
Two studies were conducted under the Institutional Animal Care and Use Committee approved Animal Care and Use Protocol procedures at Mayo Clinic (Rochester, MN) and Bristol Myers Squibb (BMS, Lawrenceville, NJ). The investigative procedures regarding diet and treatment groups were conducted in the same manner at both sites, as follows: 6-week-old, male C57BL/6J mice were purchased from Jackson Laboratories (Bar Harbor, ME) and acclimated to either the BMS (single-housed, N = 36) or Mayo Clinic animal facilities (group-housed, 3–4 per cage, N = 42) for 1 week on standard rodent chow (BMS: Teklad, 2018, Madison, WI; Mayo Clinic: Lab Diet 5053 PicoLab® Rodent Diet-20; St. Louis, MO). At 7 weeks of age, mice of normal body weight (~22–24 g) were randomized to receive either a matched control diet (CD) containing standard levels of choline, methionine, and fat (Research Diets, A13012807, New Brunswick, NJ) or a choline-deficient, amino acid-defined, (methionine, 0.1%), high-fat (60% of calories from fat) diet (CDAHFD; Research Diets, A06071302, New Brunswick, NJ).10-12, 33
Study Design
Two studies were performed using a 7T animal MRI scanner (Bruker/Biospin, Billerica, MA) at BMS with 12 mice per treatment group and using a 3T human MR scanner (Signa HDxt, GE Healthcare, Milwaukee, WI) at Mayo Clinic with 14 mice per treatment group. In both studies, the CD (1/3 of the study mice) and CDAHFD (2/3 of the study mice) groups were maintained for 12 weeks. Half of the CDAHFD mice received subcutaneous injections of 0.6 mg/kg PEG-FGF21v BIW beginning 4 weeks after diet initiation, for a total duration of 8 weeks (CDAHFD + PEG-FGF21v). CD mice and the other half of the CDAHFD mice received subcutaneous injections of vehicle BIW for 8 weeks (CD + Vehicle or CDAHFD + Vehicle, respectively; 7T site) or nothing (3T site). PEG-FGF21v was diluted to 0.12 mg/mL with sterile-filtered vehicle, aliquoted, and stored at 4 °C. A fresh aliquot was used for each dose and was maintained in a wet ice bath until the time of injection. Vehicle was 250 mM sucrose and 20 mM Tris at pH 8.3.
MRI-HFF and MRE imaging were performed before introducing either the CD or CDAHFD diets (BD), after 4 weeks on diet and prior to dosing (BL), after 4 weeks of dosing (WK4), and after 8 weeks of dosing (WK8). Mice were weighed on the days that imaging was performed. Mice were sacrificed for necropsy after the WK8 imaging.
At the 7T site, in addition to the longitudinal study groups, three satellite terminal groups (N = 6 mice/group), each imaged and sacrificed at BD, BL, and WK4, were included to provide intermediate pathophysiologic data associated with disease progression with CDAHFD.
MRI and MRE
All mice were fasted for at least 2.5 hours before imaging. Mice were anesthetized and maintained with inhaled 0%–2% isoflurane delivered by 100% oxygen during the imaging. Respiration rate was monitored and isoflurane adjusted to maintain 30–80 breaths per minute. Warm water circulators (7T site) or heated rice bags (3T site) were used to maintain normal mouse body temperature. The mouse respiration rate and body temperature were monitored (SA Instruments Inc., Stony Brook, NY) during MRI/MRE scans at the 7T site.
3T Imaging
MRI/MRE was performed in a supine position on a 3T/60-cm whole-body MRI scanner (Signa HDxt, GE Healthcare, Milwaukee, WI). A custom-made 4-cm inner diameter, 8-channel birdcage receive-only imaging coil was used. The silver needle was inserted vertically through the anterior body wall into the ventral abdomen approximately 2 mm caudal to the xiphoid process and approximately 2 mm right of the ventral midline. The needle handle was then mounted on the pneumatic passive driver (Fig. S3 in the Supplemental Material) to produce shear waves in the liver. Pressure waves generated at 200 Hz by the active pneumatic driver outside the scanner room were delivered to the passive needle driver via a long plastic tube. Wave images were acquired using a flow-compensated, phase-contrast, multislice SE-EPI MRE sequence, with repetition time/echo time (TR/TE) = 400/43.5 msec, four phase offsets, eight slices of 2-mm thickness, and three orthogonal motion-sensitizing directions at multiple excitation frequencies. Two-point GRE-based, Dixon MRI with TR/TE = 140/2.7 msec (water fat in-phase), 140/3.2 msec (water fat opposed-phase), and the same slice geometry settings as MRE was performed to quantify MRI-HFF. Detailed imaging parameters are shown in Table 1.
| MR System | 3T: 60-cm GE Signa HDxt | 7T: 20-cm Bruker Biospec |
|---|---|---|
| MRE sequence | SE-EPI | SE |
| MRE excitation frequency | 200 Hz | 200 Hz |
| MRE TR/TE, msec | 400/43.5 | 400/16 |
| MRE phase offsets | 4 | 4 |
| Number of slices | 8 | 12 |
| Matrix | 96 × 96 | 64 × 64 |
| Slice thickness, mm | 2 | 1 |
| FOV, cm | 8 × 8 | 3.2 × 3.2 |
| Motion sensitivity, μm/radians | 3.99 | 4.98 |
| MRE scan time/frequency, minutes | 2:50 | 11:50 |
| Two-point Dixon MRI sequence | Gradient echo | SE |
| Dixon MRI TR/TE, msec | IP: 140/2.7; OP: 140/3.2 | 2000/8 |
- FOV = field of view; IP = in phase; MRE = magnetic resonance elastography; MRI = magnetic resonance imaging; OP = opposed phase; SE = spin-echo; SE-EPI = SE, echo-planar imaging; TE = echo time; TR = repetition time.
7T Imaging
MRI and MRE were performed on a 7T/20-cm Bruker Biospec system using an 86-mm inner diameter rodent body radiofrequency (RF) coil (Bruker/Biospin) for signal transmitting and a planar surface coil (20-mm diameter loop coil) with a low-noise preamplifier (MT0105) for receiving. Similar to the 3T site, mice were positioned supine for needle insertion, and the planar surface coil was then placed on the abdomen with the needle positioned through the center of the loop coil. The pneumatic passive needle driver was customized and embedded with the mouse cradle to fit within the rodent body coil to generate longitudinal needle vibrations in the mouse liver during MRE scans.
The position of the passive needle driver was adjustable with respect to the needle placement to ensure that the longitudinal needle vibrations were perpendicular to the coronal imaging planes. Wave images were acquired using an SE-MRE sequence with a pair of sinusoidal-shaped motion-encoding gradients (MEGs) on both sides of the 180° refocusing pulse (eg, 5-msec duration and 2.5-msec separation for 200 Hz): TR/TE = 400/16 msec, four phase offsets, and 12 slices of 1-mm thickness. The SE-MRE sequence contained two sets of acquisitions, with and without reversal of the MEGs. The phase-contrast subtraction of the two acquisitions removed the static phase component and doubled the wave amplitude. The TR was set as an integer multiple of the wave period to allow for continuous shear wave motion during the MRE scan. Two-point SE-based Dixon MRI was performed with TR/TE = 2000/8 msec, water and fat in-phase, water and fat opposed-phase with the refocusing RF shifted by 240 μsec (π/2 at 7T), and respiration gating to quantify MRI-HFF.10
Pneumatic Needle Driver
A silver needle (Asahi Medical Instrument Co., Japan) was used in the mouse MRE studies to generate shear waves inside the liver tissue. Longitudinally oriented needle vibrations were introduced into the mouse liver through a pneumatic passive needle driver developed for the mouse liver MRE studies.34, 35 The passive needle driver was excited by an active pneumatic driver (Resoundant Inc., Rochester, MN) located outside of the scanning room. Phantom MRE tests36 were performed to verify the MRE settings on 7T and to compare the MRE-SS measurements generated on both 3 and 7T systems using the identical cylindrical phantoms made by the tissue-mimicking polyvinyl chloride (LureCraft Inc., Orland, IN) mixtures to model the mouse abdomen, with various stiffness representing the valid range of mouse liver SS. The representative shear wave images and elastograms are demonstrated in Figs S1 and S2 in the Supplemental Material.
MRI/MRE Analysis
The 3T MRE data were analyzed using a customized program in MATLAB version 2019a (MathWorks, Inc., Natick, MA). The magnitude of the complex shear modulus (SS reported in units of kilopascals [kPa]) was calculated from the measured MRE shear wave displacement data using a 3D direct inversion of the Helmholtz wave equation using the curl of the measured wave field.34 The 7T MRE data were analyzed using customized MRE-Lab software (Mayo Clinic). SS was calculated using the local frequency estimation (LFE) inversion algorithm. Two-point Dixon MR images were used to define liver regions of interest (ROIs) for MRI-HFF and MRE-SS measurements. Increased fat content in the CDAHFD mouse liver resulted in enhanced contrast in the opposed-phase images, which significantly facilitated the liver tissue segmentation. The liver ROIs were delineated by J.L. (3T site) and H.T. (7T site), both of whom have over 5 years of experience with this type of analysis. The pixel values within liver ROIs for six slices for the 3T data and 10 slices for the 7T data (excluding the first and last slices to avoid edge artifacts) were pooled to calculate a mean SS for the entire volume. Wave amplitude and share wave propagation were reviewed using the dynamic phase-contrast images, shear wave maps, and the LFE certainty estimate maps for quality control. Large vessels, the gall bladder fossa, edges, and the area surrounding the needle were excluded from the liver ROIs.
Necropsy
Mice were sacrificed approximately 72 hours after the final PEG-FGF21v dose, 1 week after the final MRE imaging at the 3T site (Fig. 1, dashed dark gray arrow) and 72 hours after the final PEG-FGF21v dose and on the same day following terminal MRE imaging at the 7T site (Fig. 1, solid dark gray arrow). Mice were anesthetized with isoflurane and then euthanized by cervical dislocation.

Blood samples were collected via cardiac puncture and placed in Sarstedt Microvette tubes coated with K2-ethylenediaminetetraacetic acid (EDTA) (Aktiengssellschaft and Co., Germany) at the 7T site or sodium citrate at the 3T site. The blood samples were then centrifuged at 4 °C at approximately 4000–6000 RPMs for 20 minutes, and plasma was separated into aliquots and stored at −80 °C for later processing. Blood samples were analyzed for glucose, lipid panels, total bile acids, alkaline phosphatase (ALP), alanine transaminase, and aspartate transaminase. The liver of each mouse was isolated and weighed. A piece of the peripheral left lateral lobe was harvested and stored at −80 °C for biochemical analysis of liver triglyceride (TG) content. The medial and left lateral lobes of the liver were collected with a fresh blade, fixed for 24–48 hours at 4 °C in 10% neutral buffered formalin and then stored in 75% ethanol prior to paraffin embedding for histology analysis. Histological slices were stained with picrosirius red (PSR) for quantification of liver fibrosis content (area %) and stained with hematoxylin & eosin (H&E) for quantification of liver steatosis (vacuole area %) using HALO software (version 2.3, Indica Labs, Inc.). Biochemical assays and histology for all samples from both the 3 and 7T studies were completed by the 7T site (Bristol Myers Squibb, Lawrenceville, NJ), although they were analyzed by the same reader (S.B.) at different times based on when each study was concluded.
Statistical Analyses
The primary metric of interest was the attenuation ratio (RDI) of the decrease (D) in true mean response from CDAHFD (μCDAHFD) to PEG-FGF21v (μCDAHFD+PEG-FGF21v), relative to the increase (I) in true mean response from CD (μCD) to CDAHFD (μCDAHFD):
A Bayesian posterior distribution for RDI was constructed from each of the 3 and 7T SS data. Posterior means and the corresponding 95% credible intervals are presented. Weakly informative prior distributions for population means and vague prior distributions for population precisions (1/population variances) were constructed based on the information presented by Yin et al.35 A two-tailed Dunnett's multiple comparison procedure was used to compare each of the CD and CDAHFD + PEG-FGF21v groups with the CDAHFD group at WK8. Statistical significance was defined as P < 0.05.
Dunnett's multiple comparison procedure was similarly performed for SS at other time points and for other endpoints. All values are presented as mean ± SE in the results. The corresponding values of RDI were estimated simply by ratios of the differences of the arithmetic means of the data. Associations between imaging measurements, MRI-HFF and MRE-SS, and histological measurements were determined using Spearman correlation. The main analysis population consisted of all mice with evaluable imaging and histological assessments in the three study groups at WK8 and in the satellite groups at BD, BL, and WK4 (7T). A Bayesian variance components analysis was performed on the WK8 data from the 3T site to evaluate the proportion of total variability due to cages within each of the three treatment groups (Table S1 in the Supplemental Material).
Results
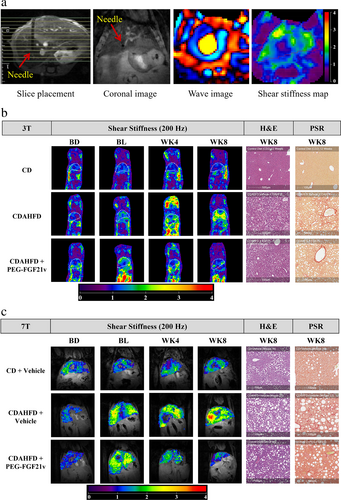
Examples of coronal MRE slice positioning and needle placement in the mouse liver, a wave image, and the SS map are shown in Fig. 2a. Liver MRE-SS maps from each imaging time point and histology (H&E for liver steatosis and PSR for fibrosis) at WK8 from a representative mouse in each group are shown in Fig. 2b (3T) and Fig. 2c (7T); corresponding MRI-HFF maps are shown in Figure S4 in the Supplemental Material.
MRE-SS and MRI-HFF were measured for all study groups for 3T (Fig. 3a,b) and 7T (Fig. 3c,d). SS of the CD mice did not increase over time in either study (approximately 1 kPa). There were elevations of HFF in the CD mice, from 1.11% ± 0.2% (BD) to 5.08% ± 0.2% (WK4) for 3T and from 2.58% ± 1.27% (BD) to 17.41% ± 2.32% (WK8) for 7T. For both 3T and 7T at BL, CDAHFD mice showed significantly elevated SS (3T: 1.25 ± 0.02 kPa; 7T: 1.78 ± 0.06 kPa) compared with that of the CD mice (3T: 1.01 ± 0.02 kPa; 7T: 0.88 ± 0.06 kPa). The SS of the CDAHFD mice continued to increase at WK4 (3T: 1.35 ± 0.04 kPa; 7T: 2.03 ± 0.06 kPa) and WK8 (3T: 1.43 ± 0.04 kPa; 7T: 2.01 ± 0.04 kPa) compared with BL, whereas HFF peaked at BL (3T: 21.97% ± 0.29%; 7T: 40.12% ± 0.35%) and started declining at WK4 (3T: 19.48% ± 0.4%; 7T: 36.36% ± 0.62%) and WK8 (3T: 17.02% ± 0.44%; 7T: 30.58% ± 0.81%).
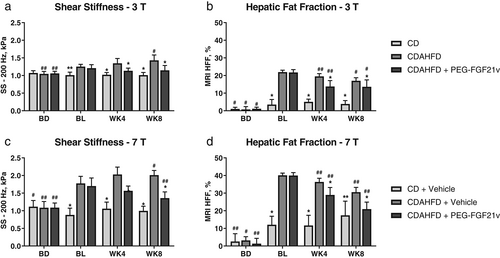
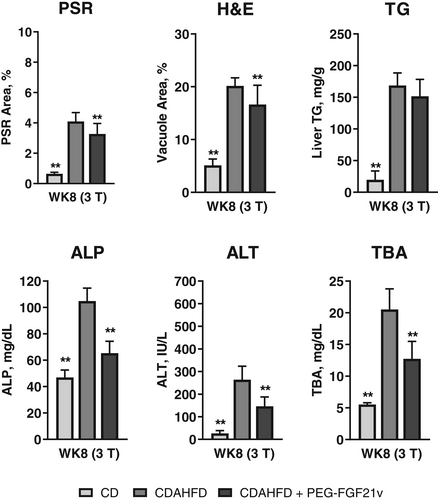
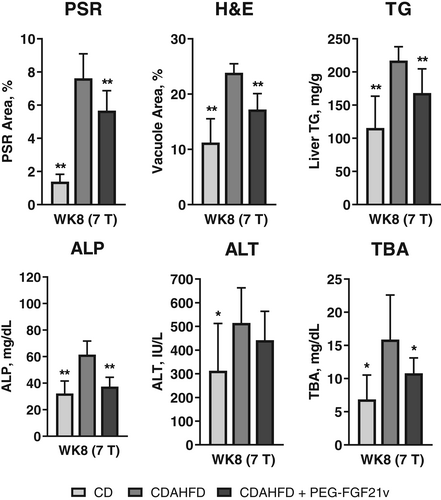
CDAHFD + PEG-FGF21v mice showed significant HFF decreases at WK4 (3T: 13.85% ± 0.88%; 7T: 28.97% ± 1.22%) and WK8 (3T: 13.48% ± 0.4%; 7T: 20.93% ± 1.15%) compared with BL (3T: 21.94% ± 0.38%; 7T: 39.96% ± 0.49%) for both 3 and 7T and a significant decrease of SS at WK8 (1.36 ± 0.05 kPa) compared with BL (1.7 ± 0.07 kPa) for 7T. MRE-SS and MRI-HFF of the CDAHFD + PEG-FGF21v mice decreased significantly at WK4 and WK8 compared with the CDAHFD control mice for both 3 and 7T. CDAHFD + PEG-FGF21v mice, compared with CDAHFD mice, also showed significant reductions in PSR area percentage (3T: 3.27 ± 0.2 vs. 4.1 ± 0.17; 7T: 5.67 ± 0.36 vs. 7.62 ± 0.44), H&E vacuole area percentage (3T: 16.65 ± 1.01 vs. 20.17 ± 0.4; 7T: 17.2 ± 0.91 vs. 23.86 ± 0.49), ALP (3T: 65.38 ± 2.49 vs. 109.53 ± 5.71 mg/dL; 7T: 37.42 ± 2.34 vs. 61.58 ± 3.22 mg/dL), and total bile acids (3T: 12.73 ± 2.8 vs. 20.54 ± 3.2 mg/dL; 7T: 10.8 ± 0.82 vs. 15.89 ± 2.12 mg/dL) at WK8 (Figs 4 and 5) for both 3 and 7T.
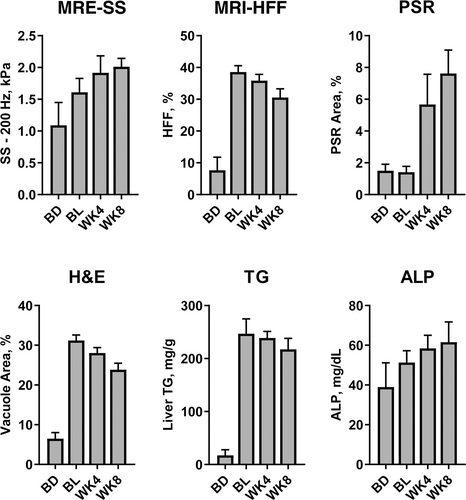
In addition to the study group of CDAHFD control mice sacrificed at WK8, MRI/MRE and necropsy data were also obtained from three satellite groups, each sacrificed at BD, BL, and WK4 (Fig. 6). Compared with BD (1.09 ± 0.05 kPa), SS increased at BL (1.78 ± 0.06 kPa) and continued to increase at WK4 (2.03 ± 0.06 kPa) and WK8 (2.01 ± 0.04 kPa), which was consistent with the increase of ALP. PSR did not show an increase at BL (1.41 ± 0.15) compared with BD (1.5 ± 0.17) until WK4 (5.67 ± 0.78) and continued to increase at WK8 (7.62 ± 0.44). Relationships between PSR-assessed fibrosis and MRE-SS and between H&E-assessed steatosis and MRI-HFF for all study mice from the 7T study are shown in Fig. 7. MRE-SS was significantly correlated with PSR fibrosis area percentage (3T: ρ = 0.73; 7T: ρ = 0.82) at WK8 for the three study groups. MRI-HFF was significantly correlated with steatosis assessed by H&E (3T: ρ = 0.93; 7T: ρ = 0.94) and liver TG (both 3 and 7T: ρ = 0.92) at WK8 for the three study groups and at BD, BL, and WK4 for the satellite mice (7T).

The results from the Bayesian analyses of SS at WK8 for the 3 and 7T systems are shown in Table 2 and Table S1 in the Supplemental Material. There was a similarly sized posterior mean near 1 kPa (3T: 1.01 ± 0.02; 7T: 1.0 ± 0.04 kPa) in the CD groups (Fig. S4 in the Supplemental Material). SS posterior means were increased in the CDAHFD group (3T: 1.43 ± 0.04 kPa; 7T: 2.01 ± 0.04 kPa) compared with the CD group (Fig. S5 in the Supplemental Material). SS posterior means were decreased in the CDAHFD + PEG-FGF21v treatment group (3T: 1.15 ± 0.04 kPa; 7T: 1.36 ± 0.05 kPa) compared with the CDAHFD group.
| RDI, % (95% Credible Interval) | ||||||
|---|---|---|---|---|---|---|
| Field Strength | WK4 SS | WK8 SS | PSR | ALP | ALT | TBA |
| 3T | −66 | −68 (−90, −44) | −24 | −68 | −50 | −52 |
| 7T | −48 | −64 (−78, −52) | −31 | −83 | −36 | −56 |
- RDI: attenuation ratio of the decrease (D) in true mean response from CDAHFD (μCDAHFD) to PEG-FGF21v (μCDAHFD+PEG-FGF21v), relative to the increase (I) in true mean response from CD (μCD) to CDAHFD (μCDAHFD).
- ALP = alkaline phosphatase; ALT = alanine transaminase; CD = control diet; CDAHFD = choline-deficient, amino acid-defined, high-fat diet; PSR = picrosirius red; SS = shear stiffness; TBA = total bile acids; WK4 = 4 weeks on treatment, 8 weeks on diet; WK8 = 8 weeks on treatment, 12 weeks on diet.
- * Only WK8 data are shown for all efficacy endpoints besides SS.
The absolute shifts in positions of both the posterior distributions and the corresponding posterior means were notably larger for the 7T site than the 3T site. However, in a relative sense, similar posterior mean proportional reductions were observed in the elevated SS. Specifically, the posterior mean percent RDI and corresponding 95% credible intervals were −68% (−90%, −44%) and −64% (−78%, −52%) for the 3 and 7T systems, respectively. Treatment efficacy assessed by MRE-SS is shown in Table 2. The results from the 3 and 7T systems were consistent with the histological and biochemical measurements.
Discussion
In this study, 8 weeks of treatment with a PEGylated FGF21 analogue, PEG-FGF21v, significantly reduced MRE-measured SS and MRI-HFF-assessed hepatic steatosis in a CDAHFD mouse model of NASH. The treatment effects of PEG-FGF21v on steatosis were quantified by MRI-HFF and had significant correlations to histological and biochemical assessments of liver steatosis and hepatic TG, respectively. The treatment effects of PEG-FGF21v on fibrosis were quantified by MRE-SS and verified by thorough histological analysis for NASH diagnosis and disease monitoring. With the potential complications and risks associated with liver biopsy, it is important for the field to assess the validity of noninvasive MRI- and MRE-based approaches to monitor NASH and evaluate treatment effects safely and longitudinally across platforms and sites. The findings from these animal studies lend additional support for the use of MRE and MRI techniques in NASH clinical and therapeutic studies in combination with histopathological analyses.
In this CDAHFD mouse model, MRI and MRE provided an assessment of the impact of PEG-FGF21v on NASH progression. Longitudinal preclinical MRI and MRE studies can be informative and translatable to guide the design and conduct of future longitudinal clinical studies. While this model approximates a form of NASH that is diet-induced and develops over a relatively short period of time, it cannot exactly replicate NASH in humans, which may have multiple causes and may develop over a longer period of time. Nevertheless, the combination of noninvasive MR-based measurements of fat fraction and liver stiffness could cause a much-needed shift in focus from an invasive assessment of hepatic fibrosis stage toward a refined and quantitative noninvasive assessment of fibrosis when it coexists with steatosis. Much of this information can be evaluated in animal models only, in which case the measurements can be more precise and coupled with detailed histological examinations. In addition, the PSR/SS data demonstrated that changes in PSR/SS observed in the satellite groups at BL and WK4 deviated from the study groups at WK8, indicating that SS increases that occur at early stages of the mouse model are not primarily associated with the fibrosis content measured by PSR. This preclinical model potentially allows for the development of advanced multiparametric MRE (SS, loss modulus, damping ratio, and volumetric strain) to better characterize the elastography data at different stages of disease development and in future preclinical studies to further understand the varying pathophysiologic statuses of NASH.34
The factors that contributed to the accuracy and variability of measurements in the mouse MRE study may be different from those in a human MRE study. The mouse liver is much smaller; therefore, the demand for imaging signal-to-noise ratio (SNR) and resolution for the mouse liver MRE becomes greater. Also, as the object of interest gets smaller, the shear wave frequency needs to be higher than that for the human liver (i.e., 60 Hz) to create a short enough shear wavelength for stiffness assessment. However, higher frequency shear waves attenuate more rapidly in soft tissues. For both the 3 and 7T systems, 200-Hz shear waves were used as a compromise between the wave SNR, sufficient liver coverage of the shear waves, and motion sensitivity for robust measurement of liver SS. The preclinical 7T MR system provides greater gradient strength to generate MRE images with shorter TE and higher SNR, thus improving the clarity and spatial resolution of the shear wave images and allowing measurement of a broader range of SS with better precision, especially in stiffer tissue.
Currently, the assessment of fibrosis in clinical practice mainly relies on staging by liver biopsy. However, the known limitations of this approach include sampling error due to fibrosis heterogeneity in different liver regions and interobserver variability in fibrosis staging. The reliance on semiquantitative histology analyses may lead to misclassification of fibrosis subgroups and misinterpretation of treatment effects. MRE has been shown to quantitatively assess liver fibrosis with high diagnostic accuracy and technical repeatability.30, 37-39
Because the liver is a uniform and recognizable large organ by MRI, ROI-based quantifications of MRE-SS and MRI-HFF are less dependent on the accuracy of liver tissue delineation and the reader. In this same mouse model, MRI-HFF measured at 7T in mice of the same age has been highly reproducible.10, 11 Additionally, an automated method to calculate liver stiffness could further eliminate the interobserver differences.40 With further validation, MRE has the potential to replace liver biopsy to provide noninvasive, objective, reliable, and accurate clinical diagnosis and treatment monitoring.
Limitations
The treatment efficacy of PEG-FGF21v was reproducible across the clinical (3T) and preclinical (7T) imaging platforms, as similar proportional reductions of elevated SS were detected in both systems. Given that the dynamic range of SS for the 3T system was smaller compared with the 7T system, the lower SS values at the higher end (stiffer tissue) for the 3T-based findings may be due to the limited resolution and SNR at 3T and/or potential distortion caused by the SE-EPI sequence. For a given shear wave frequency (eg, 200 Hz), a longer wavelength and fewer waves pass through a stiffer object, which results in an underestimation of SS in a small and/or stiffer region in the mouse liver. Using higher frequency shear waves can improve the depiction of these smaller and stiffer regions, but high-frequency shear waves attenuate exponentially with increasing distance from the needle, which restricts the useful area of shear wave visualization and the quality of the MRE-SS measurement in the liver. SE MRE at 7T with stronger gradient hardware has advantages over the 3T clinical scanner by providing improved spatial resolution and greater SNR for better wave depiction that would allow for higher frequency shear waves to be visualized throughout the mouse liver. However, as tissue mechanical properties are frequency-dependent, this study was designed to use the same mechanical frequency for MRE at both sites, which required the study to use the highest vibration frequency that was practical for the 3T site.
It was noted that MRI-HFF measurements were lower at the 3T site compared with that of the 7T site. First, there were intersite variations in the histology and biochemistry measurements. Assuming that MRI-HFF is proportional to H&E vacuole area or TG, the lower H&E or TG values would verify that the MRI-HFF should be lower at the 3T site. Although mouse age and diet were the same at both sites and the samples were analyzed at the same laboratory, there were intersite variations in housing the mice (group housing at 3T vs. single housing at 7T). Second, there were several differences in the scanner and sequence setups. The SE-based Dixon technique and the use of a 7T small-bore scanner allows for much smaller in-phase and out-of-phase time of echos than can be achieved using a GRE-based Dixon technique, particularly on a less powerful 3T clinical scanner. Because of the T2* effects in the GRE-based two-point Dixon technique, there was more signal dropout in the fat data than that of the SE-based two-point Dixon method. Two- or multipoint Dixon-based water–fat separation methods are limited in their ability to quantify fat as a result of T2* decay, T1-related bias, and the lack of accurate separation of fat, which has multiple spectral peaks, especially at lower fields, leading to inaccurate quantification of fat signals and fat fraction at 3T.21 The MRI-HFF is not equivalent to the MRI-PDFF. MRI methods that employ independent T2* corrections for water and fat, together with spectral modeling, should be considered to enable more accurate quantification of liver fat with the 3T scanner.21 Nonetheless, MRI-HFF measured at both the 3 and 7T sites were highly correlated with the H&E vacuole areas and TG measurements, although MRI-HFF examines the entire liver, while the histology and TG utilizes cross sections and very small portions from two lobes. The treatment efficacy of PEG-FGF21v, as assessed by the relative changes of MRI-HFF, was reproducible across the 3 and 7T imaging platforms.
In general, the pattern and percent changes for the measurements between the two sites were in line with each other. Differences in the absolute values of the biochemical assays were assessed and were found to fall within the normal variation seen for this model and could be due to the slight differences in the model (housing and handling of different vivarium staff and scientists) and sample collections (sodium citrate at 3T vs. EDTA at 7T) between the two sites. The two sites used the same needle oscillator for MRE scans. The acupuncture needles were inserted with a fixed depth, and the needle trajectory was checked using the anatomical MRI to ensure avoidance of major blood vessels, gall bladder fossa, and ribs. No injuries caused by the needle were indicated in the histological samples collected from the mice in the study. In addition, the plasma chemistries and histology examinations supported the liver imaging results in this study. Histology and biochemical assays (TG, PSR, ALP, and so on) of the study group of CDAHFD control mice (four repeated MREs, vehicle administrations) at WK8 followed the time course trend of the three satellite groups (single MRE, no vehicle administration), each sacrificed at BD, BL, and WK4. The cross-sectional MRI-HFF and MRE-SS of the satellite groups are consistent with the longitudinal MRI/MRE measurements of the study group at BD, BL, and WK4. These data suggest that repeated vehicle administration and the needle oscillator did not cause notable adverse effects during the longitudinal study.
Conclusion
Preclinical MRI and MRE methods were implemented at two imaging sites (with a 3T clinical scanner and a 7T preclinical scanner) to assess hepatic steatosis and fibrosis in a diet-induced NASH mouse model. Measurements of MRI-HFF and MRE-SS showed that PEG-FGF21v treatment reduced liver steatosis and stiffness, observations that were confirmed histologically.
The 3T magnet bridges the human and mouse liver MRI/MRE. Replicating the FGF21 treatment effects on 7T allows future mouse MRI/MRE studies to be conducted on the preclinical scanner. These data support the forward- and back-translation of MRI and MRE as noninvasive imaging biomarkers for longitudinal efficacy assessments in preclinical and clinical NASH studies and support further studies evaluating FGF21 analogues, as well as other ameliorating modalities, for the treatment of NASH.
Acknowledgments
The mouse cradle used to support the MRE passive needle driver was designed and crafted by Daniel Batalla (Bristol Myers Squibb) and Bob Ruediger (consultant for Bristol Myers Squibb). The MRE pulse programming on the 7T Bruker MRI system was provided by Mark Mattingly and Saaussan Madi who were employees of Bruker Biospin at the time of the study.
The authors thank Roger Grimm, Huimin Liu, MD, Harold Malone, and Phillip J. Rossman for their contributions to the study and Amanda Martin, PhD, of Medical Expressions, Inc., Chicago, IL, who provided editorial support with funding from Bristol Myers Squibb.


