Myocardial Deformation in the Pediatric Age Group: Normal Values for Strain and Strain Rate Using 2D Magnetic Resonance Feature Tracking
The first two authors contributed equally to the study.
Abstract
Background
Myocardial deformation can be assessed from routine cardiac magnetic resonance (MR) images using two-dimensional feature tracking (2D-FT). Although reference values are essential for implementation of strain imaging in clinical practice, data for the healthy pediatric age group are limited.
Purpose
To provide pediatric MR reference values for strain and strain rate for all four heart chambers.
Study Type
Retrospective.
Subjects
One hundred and fifty-seven healthy children from two institutions (102 male, age 4.7–18 years).
Field Strength/Sequence
1.5 T; balanced steady-state free precession sequence.
Assessment
Left ventricular (LV) global and regional longitudinal, circumferential, and radial strain and strain rate as well as right ventricular (RV) and atrial global and regional longitudinal strain and strain rate were measured in two-, three-, and four-chamber views and the short axis stack. The relationships between strain parameters and age, height, weight, and gender were investigated. Age- and height-specific centile curves and tables were created for LV strain and strain rate. For all other global strain parameters, the mean was calculated as a reference.
Statistical Tests
Lambda-mu-sigma (LMS)-method of Cole and Green, univariable, and multivariable linear regression models. A P value <0.05 was considered to be statistically significant.
Results
Age, height and weight had a significant influence on LV global strain values. These parameters also showed an influence on RV strain but only in boys (girls P = 0.12) and none of the variables had a significant influence on atrial strain (P = 0.19–0.49). Gender differences were only found for RV strain values.
Data Conclusion
Pediatric potential reference values for myocardial deformation parameters of both ventricles and atria are provided. The values may serve as a reference in future studies and clinical practice.
Level of Evidence
3
Technical Efficacy
Stage 5
Magnetic resonance imaging (MRI) is an important imaging modality in the diagnostics and clinical management of congenital and acquired heart disease in pediatric patients. MR is the modality of choice and the reference standard for the assessment of left and right ventricular (LV, RV) function, volumes, and mass.1
In addition to the routinely established ventricular function parameters, strain and strain rate are further parameters that are increasingly assessed by MRI. Compared to other functional parameters such as ejection fraction, strain is used to assess contractile function in different planes (longitudinal, circumferential, and radial) as well as regional and global myocardial contractility.2 Furthermore, global strain values appear to be more sensitive to contractile dysfunction than ejection fraction and can be impaired when ejection fraction is still preserved.3-5
Two-dimensional MR feature tracking (2D-FT) has emerged as a new practicable and accessible approach to measure strain. It has the advantage that it can easily be applied to routinely acquired MR cine images.1 Several studies have shown the diagnostic and prognostic value of 2D-FT in various cardiac conditions, including those in pediatric patients.5-10 However, the availability of 2D-FT normal values is limited, especially for the pediatric age group. While several studies have provided reference values for strain and strain rate in children and adolescents, these have several limitations: most importantly the relatively small number of children included and the limited number of views assessed (eg, four-chamber view or three- and four-chamber views only).11, 12
Thus, the aim of this study was to create centile curves and tables for global strain and strain rate values in children and adolescents and to assess the influence of demographic and anthropometric parameters on ventricular and atrial strain by using 2D-FT. Additionally, regional strain and strain rate values are described.
Materials and Methods
Study Population
A general research consent was available for all participants, parents, or legal guardians, as appropriate.
The study was performed in accordance with the declaration of Helsinki and was approved by the local ethics committee.
2D-FT measurements were conducted in 157 healthy children and adolescents (mean age 13.8 years, range 4.7–18 years, 35% female, and 65% male; Fig. 1). MRI datasets were acquired between 2010 and 2020 for clinical purposes independent of this study.
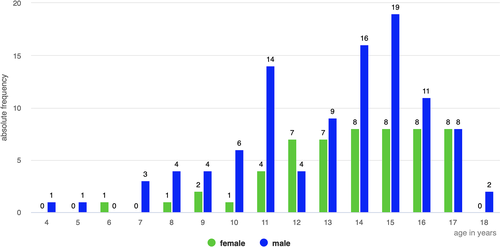
Indications for the MRI scans were: 1) nondiagnostic echocardiographic scan, 2) uncertainty about the cardiac anatomy and myocardial structure on echocardiography, 3) syncope, or 4) chest pain with low pre-scan probability of being cardiac in origin. MRI and clinical findings as well as clinical follow-up did not show any evidence for cardiovascular pathology.
Exclusion criteria were congenital and acquired heart disease, arterial hypertension, and medication for arterial hypertension as well as all other illnesses that required medical treatment. Age at examination, body height (cm), body weight (kg), and heart frequency (bpm) were recorded. Body surface area (BSA in m2) was calculated using the Mosteller formula.13 All MRI examinations were performed without sedation.
Magnetic Resonance Imaging
MRI scans were performed on 1.5 T scanners (MAGNETOM Aera, Siemens Healthcare GmbH, Erlangen, Germany) with 147 children scanned at one site and 10 two-, three-, and four-chamber cine images as well as a short axis cine stack were acquired during breath-holds using balanced steady-state free precession sequences. Sequence details were as follows: retrospective electrocardiogram gating, repetition time (TR)/time to echo (TE) = 1.17/30.6 msec, flip angle 73 degrees, number of cardiac phases 25, field of view 250-420 mm (according to patient size), matrix size 192 mm x 144 mm, slice thickness 5-8 mm, slice gap 2 mm and temporal resolution 30 msec.
Two-Dimensional Feature Tracking
2D-FT measurements were carried out using MEDIS SUITE Software (Medis Medical Imaging Systems, Leiden, The Netherlands).
- Global and regional LV endocardial and myocardial longitudinal and circumferential strain and strain rate (LS, CS, LSR, CSR).
- Global and regional LV radial strain and strain rate (RS, RSR).
- Global and regional RV endocardial LS and LSR.
- Global and regional left and right atrial (LA, RA) endocardial LS and LSR.
Global and regional RV LS and RV LSR as well as global RA LS and RA LSR were measured from the four-chamber view. Global and regional LA LS and LA LSR were assessed in both the two- and four-chamber views.
Endocardial and LV epicardial contours were drawn manually in end-systole (I.N., 1–2 years of experience). Tissue patterns along these contours were then tracked automatically throughout the cardiac cycle and were manually adjusted in end-diastole. Tracking quality was visually assessed and if necessary corrected in end-diastole and/or end-systole. Segments that visually showed insufficient tracking quality were excluded from further analysis. The left ventricle was divided into segments according to the American Heart Association 17-segment model for regional strain and strain rate measurements.14 For regional measurement, the RV was divided into two segments (free wall and septum) and the atria were divided into left and right atrial wall as well as the atrial roof. Trabeculations and papillary muscles as well as the junctions of the pulmonary veins for the LA and the caval veins for the RA were excluded from the analysis. To obtain global values, the peak strain and strain rate values of the respective segments were averaged.
Examples of 2D-FT measurements and the corresponding curves are shown in Figs. 2 and 3.

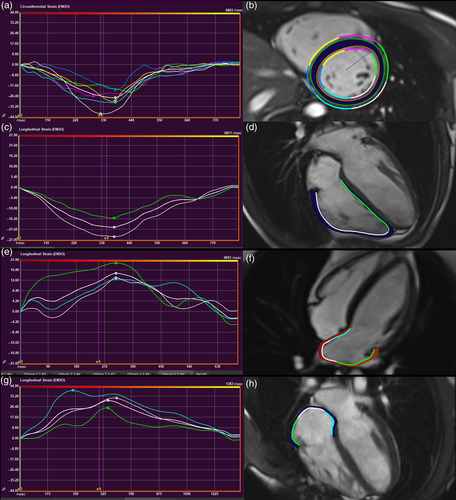
Absolute values were used when referring to an increase or decrease of strain as recommended by Lang et al.15
Reproducibility
For the evaluation of the intraobserver variability, measurements of 30 randomly chosen children were repeated at least 2 weeks after the first measurements. Furthermore, 30 measurements were repeated by a second observer (I.V., 15 years of experience) for interobserver variability.
Statistical Analysis
Medcalc Statistical Software (version 19.8, MedCalc Software, Ostend, Belgium) as well as the software R (version 4.0.3, R Core Team16) were used for statistical analysis. All tests were performed two-sided and P = 0.05 was used for the significance level. For comparison of regional values of the left ventricle, the paired sample t-test was applied. Reproducibility was assessed using the intraclass correlation coefficient (ICC). ICC values below 0.5 were described as poor, values between 0.5 and 0.75 were considered as moderate, values between 0.75 and 0.9 were considered as good, and values above 0.9 were described as excellent.
Centile graphs and tables for strain and strain rate measurements were generated according to the lambda-mu-sigma (LMS) method of Cole and Green.17 An extended version of this method is implemented in the R package GAMLSS18 which was used for the analysis.
The association between demographic parameters and global strain measurements was analyzed for each influence variable separately and in a multiple fashion with linear regression models with and without interactions. The fit of the linear model was assessed with influence factor vs. outcome plots, residual vs. fitted plots, q-q plots, scale-location plots, and residual vs. leverage plots. Influence variables were sex, BSA, age, body height, and body weight. Model selection was performed by backward selection and a P-value threshold of 0.05.
Results
A detailed overview of parameters is given in Table 1.
| Study Population (N = 157) | Male (N = 102) | Female (N = 55) | ||||
|---|---|---|---|---|---|---|
| Mean | SD | Mean | SD | Mean | SD | |
| Age (years) | 13.8 | 2.8 | 13.5 | 3.0 | 14.2 | 2.5 |
| Height (cm) | 161.9 | 16.3 | 163.1 | 18.3 | 159.6 | 11.3 |
| Weight (kg) | 55.1 | 15.5 | 55.7 | 16.2 | 53.9 | 14.0 |
| BMI (kg/m2) | 20.7 | 4.1 | 20.5 | 3.8 | 21.0 | 4.6 |
| BSA (m2) | 1.6 | 0.3 | 1.6 | 0.3 | 1.5 | 0.2 |
| HR (bpm) | 74.9 | 13.2 | 73.9 | 14.2 | 76.8 | 11.1 |
| LVEDV (mL) | 137.0 | 39.5 | 144.8 | 43.4 | 122.4 | 25.3 |
| LVESV (mL) | 58.5 | 19.9 | 61.7 | 22.5 | 52.6 | 11.8 |
| LVEDMM (g) | 80.2 | 25.8 | 84.8 | 27.9 | 71.4 | 18.5 |
| RVEDV (mL) | 141.9 | 43.7 | 150.7 | 48.0 | 125.4 | 27.8 |
| RVESV (mL) | 64.1 | 23.0 | 68.5 | 25.7 | 55.8 | 13.3 |
| RVEDMM (g) | 29.0 | 8.8 | 30.5 | 9.4 | 26.3 | 6.7 |
- Data are shown as mean and SD.
- BMI = body mass index; BSA = body surface area; HR = heart rate; LVEDV = left ventricular end-diastolic volume; LVEDMM = left ventricular end-diastolic muscle mass; LVESV = left ventricular end-systolic volume; RVEDV = right ventricular end-diastolic volume; RVEDMM = right ventricular end-diastolic muscle mass; RVESV = right ventricular end-systolic volume.
Strain measurements could be conducted in over 96% of all datasets.
Linear Regression Analysis
Detailed results of the multiple linear regression models are shown in Table 2.
| Influence Variable | Regression Coefficient | Standard Error | P Value |
|---|---|---|---|
| LV Endo GLS | |||
| Gender (reference male) | 0.55 | 0.60 | 0.36 |
| BSA | 3.44 | 0.94 | 0.00035 |
| Body height | 0.061 | 0.017 | 0.00037 |
| Body weight | 0.063 | 0.018 | 0.0005 |
| Age | 0.34 | 0.098 | 0.00068 |
| LV Myo GLS | |||
| Gender (reference male) | 0.11 | 0.50 | 0.83 |
| BSA | 3.10 | 0.78 | 0.00012 |
| Body height | 0.054 | 0.014 | 0.00019 |
| Body weight | 0.057 | 0.015 | 0.00019 |
| Age | 0.28 | 0.083 | 0.00098 |
| LV Endo GCS | |||
| Gender (reference male) | −0.52 | 0.84 | 0.54 |
| BSA | 2.97 | 1.35 | 0.029 |
| Body height | 0.051 | 0.024 | 0.036 |
| Body weight | 0.053 | 0.026 | 0.039 |
| Age | 0.44 | 0.14 | 0.0019 |
| LV Myo GCS | |||
| Gender (reference male) | −0.43 | 0.57 | 0.46 |
| BSA | 2.45 | 0.92 | 0.0083 |
| Body height | 0.031 | 0.017 | 0.069 |
| Body weight | 0.048 | 0.017 | 0.0063 |
| Age | 0.27 | 0.095 | 0.0051 |
| LV GRS | |||
| Gender (reference male) | 0.61 | 2.28 | 0.79 |
| BSA | −5.09 | 3.70 | 0.17 |
| Body height | −0.085 | 0.067 | 0.20 |
| Body weight | −0.093 | 0.070 | 0.19 |
| Age | −0.91 | 0.38 | 0.018 |
| RV Endo GLS | |||
| Gender (reference male) | −1.59 | 0.72 | 0.028 |
| BSA | 3.47 | 1.16 | 0.0033 |
| Body height | 0.058 | 0.021 | 0.0066 |
| Body weight | 0.062 | 0.022 | 0.0059 |
| Age | 0.28 | 0.12 | 0.021 |
| LA 4C Endo GLS | |||
| Gender (reference male) | −1.01 | 1.45 | 0.49 |
| BSA | −2.14 | 2.36 | 0.37 |
| Body height | −0.056 | 0.042 | 0.19 |
| Body weight | −0.033 | 0.045 | 0.47 |
| Age | −0.21 | 0.25 | 0.40 |
| LA 2C Endo GLS | |||
| Gender (reference male) | −2.52 | 1.92 | 0.19 |
| BSA | −1.10 | 3.25 | 0.74 |
| Body height | −0.036 | 0.058 | 0.54 |
| Body weight | 0.0016 | 0.061 | 0.98 |
| Age | −0.27 | 0.33 | 0.41 |
| RA Endo GLS | |||
| Gender (reference male) | 1.60 | 1.37 | 0.25 |
| BSA | 1.43 | 2.25 | 0.53 |
| Body height | 0.023 | 0.040 | 0.58 |
| Body weight | 0.026 | 0.043 | 0.54 |
| Age | 0.42 | 0.23 | 0.071 |
- Influence variables that remained significant in the multivariate linear model are shown in bold.
- LA 4C Endo GLS = left atrial endocardial global longitudinal strain derived from four-chamber views; LA 2C Endo GLS = left atrial endocardial global longitudinal strain derived from two-chamber views; LV Endo GCS = left ventricular endocardial global circumferential strain; LV Endo GLS = left ventricular endocardial global longitudinal strain; LV Myo GCS = left ventricular myocardial global circumferential strain; LV Myo GLS = left ventricular myocardial global longitudinal strain; LV GRS = left ventricular global radial strain; RA Endo GLS = right atrial endocardial global longitudinal strain; RV Endo GLS = right ventricular endocardial global longitudinal strain; BSA = body surface area.
In univariable linear analysis, age, body weight, and BSA had a significant influence on global LV endocardial and myocardial LS and CS. While body height had a significant influence on LV endocardial and myocardial LS and endocardial CS, the influence on myocardial circumferential strain did not reach significance (P = 0.069).
In the multiple regression analysis, only body height remained in the final model for global LV endocardial LS after backwards selection. For global LV myocardial LS, the highest association was found for body weight, but there was only a small difference between body weight and body height. For global LV endocardial CS, global LV myocardial CS and global LV RS only age remained in the multiple regression model. Gender showed no significant association (global LV endocardial LS: P = 0.36; global LV myocardial LS: P = 0.83; global LV endocardial CS: P = 0.54; global LV myocardial CS: P = 0.47; global LV RS 0.79).
For the RV, gender and BSA as well as an interaction of sex and BSA were significantly associated with RV endocardial LS. Therefore, multiple regression was stratified by gender, after which only BSA remained in the final model for boys (regression coefficient 5.25, standard error 124), although BSA was not significantly associated with RV endocardial LS in girls (regression coefficient 3.91, standard error 2.50, P = 0.12).
In contrast to the ventricles, none of the influence factors showed a significant influence for all atrial strain parameters (LA Endo GLS derived from four-chamber views: P = 0.49; LA Endo GLS derived from two-chamber views: P = 0.19; RA Endo GLS derived from four-chamber views: P = 0.25).
Centile Curves and Tables
Following the results from the regression analysis and to provide homogenous results, percentile curves and tables for LV global endocardial and myocardial LS and LSR are shown with respect to body height (Fig. 4, Tables S1–S4 in the Supplemental Material) whereas centile curves and tables for LV global endocardial and myocardial CS, CSR, RS, and RSR are shown with respect to age (Fig. 5, Tables S5–S10 in the Supplemental Material).
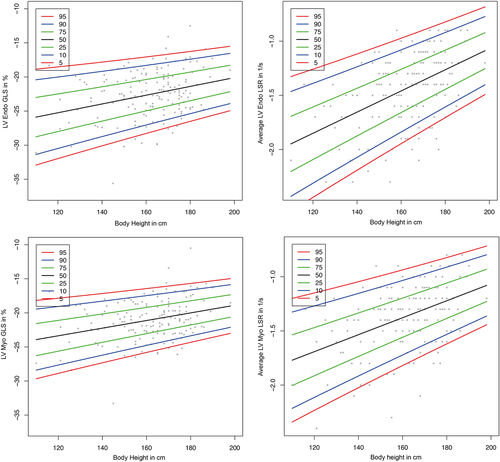
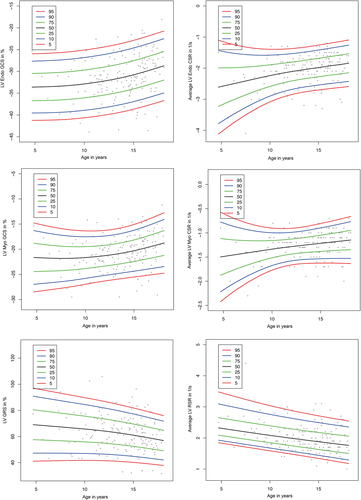
For all remaining strain parameters, the mean was calculated as a reference (Table S11 in the Supplemental Material).
As the number of children below the age of 10 years was relatively small, we created additional centile curves and tables for children from age 10 years onwards.
Regional Differences in Strain
Results for regional strain values are summarized in Tables S12–S14 in the Supplemental Material.
Midventricular circumferential (endocardial and myocardial) strain values were significantly lower than the respective basal values (endocardial: −29.1 ± 4.2 vs. −33.8 ± 3.8; myocardial: −19.6 ± 3.1 vs. −23.7 ± 3.0), and apical values were significantly higher than basal and midventricular values (endocardial: apical −39.8 ± 9.6 vs. basal −33.8 ± 3.8 and apical −39.8 ± 9.6 vs. midventricular −29.1 ± 4.2; myocardial: apical −25.7 ± 6.2 vs. basal −23.7 ± 3.0 and apical −25.7 ± 6.2 vs. midventricular −19.6 ± 3.1).
In contrast, radial strain was significantly higher in both the midventricular plane (47.8 ± 12.5 vs. 44.4 ± 11.7) and apical plane (58.3 ± 19.3 vs. 44.4 ± 11.7) than in the basal plane.
Longitudinal strain values were significantly higher in the midventricular plane than in the basal and apical plane (endocardial: midventricular −29.7 ± 4.0 vs. basal −24.7 ± 4.1 and midventricular −29.7 ± 4.0 vs. apical −23.6 ± 5.4; myocardial: midventricular −28.3 ± 4.4 vs. basal −25.1 ± 3.8 and midventricular −28.3 ± 4.4 vs. apical −20.0 ± 4.6).
Comparable trends were observed for corresponding peak strain rates.
Reproducibility
Tables of ICC values are shown in Tables S15–S19 in the Supplemental Material.
Intraclass correlation for interobserver reproducibility was good to excellent for LV global endocardial and myocardial LS and CS, and RA global endocardial LS with values ranging between 0.77 and 0.93. Moderate intraclass correlation was documented for LV global RS, RV global endocardial LS, and four-chamber as well as two-chamber LA global endocardial LS (0.64–0.74).
Intraclass correlation for intraobserver variability for global strain values was good to excellent (0.78–0.94) for most variables. Moderate ICCs were only found for four-chamber LA global endocardial LS and LSR as well as RA global endocardial LS (0.53–0.63).
Interobserver and intraobserver variability was also assessed for regional strain values and was found to be moderate to excellent for most LV and RV segments. However, segmental LR RS values showed poor intraobserver and interobserver variability for several segments from base to apex (Tables S16 and S17 in the Supplemental Material). Furthermore, poor intraobserver variability was observed for LV myocardial circumferential strain in segment 8.
Discussion
In this study, the impact of anthropometric and demographic parameters on ventricular and atrial strain parameters was assessed in a large group of children and adolescents and a description of regional strain values was provided.
Feasibility of Strain Measurements
The high feasibility of strain measurements shown in this study indicates one of the advantages of 2D-FT compared to speckle tracking echocardiography, where previous studies have reported a lower feasibility for echocardiography strain measurements when compared to MRI.19, 20 This can be explained by the ability of MRI to obtain high spatial resolution images of all ventricular and atrial views, when compared to echocardiography which is often affected by either poor acoustic windows or the inability to visualize all segments with the same spatial resolution.19, 20
Influence of Anthropometric and Demographic Parameters
In contrast to RV strain measurements, LV and atrial strain measurements did not differ significantly between boys and girls. This is consistent with previous findings from other pediatric studies,11, 12 while for adult populations significant gender differences have been detected.21, 22 Andre et al provided possible explanations including the influence of androgens and estrogens as a source of gender discrepancies in cardiac deformation as well as larger myocardial mass in men when compared to women.11
In the present study, anthropometric parameters (height, weight, and BSA) showed a significant association with at least some of the outcome variables. As a result of their impact on strain in backwards multivariable regression analysis, reference values are presented as centiles with height as an independent variable for LV global endocardial and myocardial LS and the corresponding strain rates as well as with age as the independent variable for LV global endocardial and myocardial CS and global RS. We found a linear relationship between both LS and LSR and height. CS showed a very subtle exponential curve with the rising part seen from puberty. The same but opposite trend was seen for RS. Andre et al identified a strong parabolic relationship between strain measurements and both BSA and age.11 This seems to be associated with very low values of all strains in a small subgroup of infants with low BSA. Large variability in neonates and infants has been shown in a meta-analysis assessing LV strain in children with 2D speckle tracking echocardiography which has been explained by histological and physiological changes early in life.23 Shang et al detected no age-dependency of longitudinal strain values.12 However, only longitudinal strain was assessed and different to our study was measured from horizontal long axis views only whereas we used two-, three-, and four-chamber views to measure longitudinal strain values.
Previous echocardiographic studies are also inconsistent,23, 24 with a dependency of strain with BSA25 or age26 being reported. Different equipment vendors, LV end-diastolic dimensions, and age were found to be responsible for the variations in normal published echocardiographic ranges.23
Since there was no significant association between influence factors and global strain, no centile graphs were created for RV and atrial strain values. Instead, reference ranges for global and regional strain values are given. It is also worse to mention that RA and RV strain were less reproducible.
The reason why BSA showed a significant influence on RV strain in boys but not in girls remains unclear. Since there seems to be no physiological explanation, it might be possible that the different findings may result from different sample sizes of boys and girls.
Application of Reference Values
Global strain parameters were measured as the peak end-systolic strain, which is generally close but not always completely identical to the absolute peak of the global strain curve, which is provided in some other studies.11, 27
The general lack of standardization in strain imaging as well as vendor-specific differences has been detected previously as a source of variation.27-29 It is important to keep this in mind when comparing our results to values derived by different workflows or software from different vendors. For long-term follow-up and repeated measurements, the focus should be on individual development, applying the same workflow and vendor. Vendor-independent software for analyzing myocardial deformation has been proposed as ideal solution for strain measurement by some authors.23 Beside variations between different analysis software types, the temporal and spatial resolution of MRI images must be considered when comparing strain measurements.
Regional Differences in Cardiac Deformation
Regional assessment of strain demonstrated higher apical values for the circumferential and radial strain. Andre et al and Augustine et al, however, found a significant decrease from base to apex in children and adults.11, 21 A reason for the observed differences might be the difficulty in defining the apical endocardial border due to the interference of trabeculations. In addition, poor to moderate interobserver variability was found for LV RS values showing that regional RS values should be used with caution. Three-dimensional FT (3D-FT) might provide more reliable regional strain values as it has been shown a better interobserver and intraobserver variability compared to 2D-FT in a recent study.30
Limitations
Study group heterogeneities such as a relatively small number of younger children (only 17 under 10 years of age) and a smaller number of female participants compared to male participants might have influenced the results. Therefore, additional analyses for all children from 10 years onwards were performed and are shown in Figs. S1 and S2 in the Supplemental Material. Moreover, the included children were not normal volunteers but were children who underwent MRI for clinical reasons. However, MRI as well as clinical findings and follow-up did not reveal any cardiovascular pathology.
Another limitation of the study is that different software packages might use different algorithms for the strain assessment and therefore discrepancies cannot be excluded.
Finally, general limitations of strain measurements by 2D-FT have to be considered including out-of-plane movement, lower reproducibility for regional strain values as well as lower spatial and temporal resolution when compared to echocardiography. 3D-FT has shown a better reproducibility for deformation measurements and should be considered for future studies.30
Conclusion
In this study, potential pediatric reference values for myocardial deformation parameters of both ventricles and atria were created. The values may serve as a reference in future studies and have the potential to help to detect pathological developments in clinical practice.
Acknowledgment
The authors thank Mrs. Traudel Hansen for her help with patient management.
Open access funding enabled and organized by Projekt DEAL.


