Orthotopic Versus Allotopic Implantation: Comparison of Radiological and Pathological Characteristics
YeYu Cai and TaiLi Chen contributed equally to this work.
Abstract
Background
In experimental animal models, implantation location might influence the heterogeneity and overall development of the tumor, leading to an interpretation bias.
Purpose
To investigate the effects of implantation location in experimental tumor model using magnetic resonance imaging (MRI) and pathological findings.
Study Type
Prospective.
Subjects
Forty-five breast cancer-bearing mice underwent orthotopic (N = 15) and heterotopic (intrahepatic [N = 15] and subcutaneous [N = 15]) implantation.
Field Strength/Sequence
Sequences including: T1-weighted turbo spin echo sequence, T2-weighted blade sequence, diffusion-weighted imaging, pre- and post-contrast T1 mapping, multi-echo T2 mapping at 3.0 T.
Assessment
MRI was performed at 7, 14, and 21 days after implantation. Native T1, post-contrast T1, T2, and apparent diffusion coefficient (ADC) of tumors, the tumor volume and necrosis volume within tumor were obtained. Lymphocyte cells from H&E staining, Ki67-positive, and CD31-positive cells from immunohistochemistry were determined.
Statistical Tests
One-way analysis of variance and Spearman's rank correlation were performed. P value <0.05 was considered statistically significant.
Results
The tumor volume (intrahepatic vs. orthotopic vs. subcutaneous: 587.50 ± 77.62 mm3 vs. 814.00 ± 43.85 mm3 vs. 956.13 ± 119.22 mm3), necrosis volume within tumor (89.10 ± 26.60 mm3 vs. 292.41 ± 57.92 mm3 vs. 179.91 ± 31.73 mm3, respectively), ADC at day 21 (543.41 ± 42.28 vs. 542.92 ± 99.67 vs. 369.83 ± 42.90, respectively), and post-contrast T1 at all timepoints (day 7: 442.00 ± 11.52 vs. 435.00 ± 22.90 vs. 394.33 ± 29.95; day 14: 459.00 ± 26.11 vs. 436.83 ± 26.01 vs. 377.00 ± 27.83; day 21: 463.50 ± 23.49 vs. 458.00 ± 34.28 vs. 375.00 ± 30.55) were significantly different between three groups. Necrosis volumes of subcutaneous and intrahepatic tumors were significantly lower than those of orthotopic tumors. The CD31-positive rate in the intrahepatic implantation was significantly higher than in orthotopic and subcutaneous groups. Necrosis volume (r = −0.71), ADC (r = −0.85), and post-contrast T1 (r = −0.75) were strongly correlated with vascular invasion index.
Data Conclusion
Orthotopic and heterotopic tumors have their unique growth kinetics, necrosis volume, and vascular invasion. Non-invasive MR quantitative parameters, including ADC and post-contrast T1, may reflect vascular invasion in mice.
Level of Evidence
1
Technical Efficacy
Stage 3
Tumor heterogeneity is thought to play an important role in tumor growth and treatment.1 Although cancer formation is a clonal process, not all malignant cells within a tumor exhibit the same characteristics.2 Inter-tumor heterogeneity refers to the difference found between tumors in different individuals.3 This is the focus of many cancer studies, including those on alterations in cancer driver genes and those on differences in patient response to therapy.4, 5 Compared with inter-tumor heterogeneity, studies on intra-tumor heterogeneity have focused not only on identifying genetic differences between tumor cells,6 but also on features of the tissue micro-environment such as metabolism,7 immunity,8, 9 and hypoxia.10
In laboratory studies, the animal model of transplanted tumors, which are formed by continuous passage of tumor cells to an animal from either the same or heterogeneous animal species, is the most used in vivo method.11, 12 Conventional xenograft models represent the complexity of genetic and epigenetic abnormalities and are used to reduce inter-tumor heterogeneity by grafting the human tumor micro-environment.13 Syngeneic tumor models are immunocompetent models with relatively uniform growth, and are commonly utilized to evaluate intra-tumor heterogeneity.14 However, tumor location, which is important for determining the heterogeneity of tumor growth,15 has rarely been studied. Different locations within the body have specific histocytes, extracellular matrix compartments, or vasculature.16 These extrinsic factors, which affect the outgrowth of tumors, comprise the tumor micro-environment. Consequently, they could reinforce the heterogeneity of tumors and have a profound effect on overall tumor development. Another consideration is that there are two widely used types of transplanted tumor models (the orthotopic model and the heterotopic model). Each model has its own advantages. The subcutaneous model, as a representative of the heterotopic model, is easy to implant and subsequently palpable,17 but the orthotopic model provides a tumor micro-environment that leads to the development of the distinct biological properties of tumor cells.18 Therefore, the selection of implantation location might influence the heterogeneity of the tumor, leading to an interpretation bias.
In cancer research, magnetic resonance imaging (MRI) has been used extensively to determine the size, location, vascular invasion, and tumor heterogeneity.19 This technique is well-tolerated by humans and laboratory animals and it has been shown that repeated study does not influence animal welfare or tumor growth.20
Thus, the aim of this study was to investigate the effects of orthotopic and heterotopic (intrahepatic and subcutaneous) implantation in mouse models with highly vascularized and syngeneic 4T1 breast cancer using MRI.
Materials and Methods
Animal Experiments and Tumor Extraction
All animal experiments were performed in accordance with the guidelines of the Animal Care Committee. Maximum effort was maintained in minimizing animal distress. In total, 45 female BALB/c mice (aged 8–10 weeks) were purchased from the Laboratory Animal Center. They were housed under temperature-controlled conditions (20–26 °C) with a regular daylight cycle. The laboratory mice were provided ad libitum access to purified water and were fed a standard diet.
4T1 murine breast cancer cells (RPMI 1640 medium) were obtained from the Cell Bank of the Chinese Academy of Sciences (Shanghai, China). Orthotopic tumor inoculation was performed by injecting 100 μL 4T1 cells (approximately 2 × 10⁶ cells) into the right mammary fat pad of the mice. Tumor sizes were assessed daily using a Vernier caliper, and the volume was calculated using the following formula: 0.5 × length × (width2). Afterwards, tumor tissues were obtained from 15 4T1-bearing donor mice. After achieving a tumor size of approximately 500 mm2, the mice were euthanized, and the tumor was removed from the surrounding tissue. Next, the collected tumors were cleaned to remove necrotic tissue. Fish-like tumor tissues were soaked in a phosphate-buffered solution on ice and cut into small pieces (0.5–1.0 mm in diameter). Finally, the tumor tissue fragments were drawn into a 1-mL syringe.
Orthotopic and Heterotopic Tissue Implantation
All surgical procedures were performed while maintaining aseptic technique and keeping all instruments under sterile conditions. Forty-five mice were randomly divided into three groups: orthotopic, subcutaneous, and intrahepatic. All mice were prepared and disinfected for surgery after anesthetizing them with 50 mg/kg of pentobarbital sodium solution (Sigma, Shanghai, China) via intraperitoneal injection. Initially, the mice in the intrahepatic group were placed in the supine position on a heating pad. After confirming that adequate anesthesia was reached, the abdomens of the mice were opened by making a 1-cm right subcostal skin incision. The tumor fragments (0.1 mL) were subsequently injected into the parenchyma using a 16-G needle head while gently pressing the implantation location with a cotton swab. Finally, the liver was placed back into the abdominal cavity, and the skin was closed using absorbable sutures. The mice in the orthotopic and subcutaneous groups were administered orthotopic and subcutaneous injections with 0.1 mL of tumor fragments using a 16-G needle head into their right mammary fat pad and right flank. The time between the removal of the sample from the donors and tissue implantation did not exceed 30 min for each single mouse among all three groups.
MRI Protocol
Images were obtained using a 3.0-T MRI scanner (MAGNETOM Skyra, Siemens, Erlangen, Germany) with a custom-built animal coil (Zhongzhi Medical Technologies, Suzhou, China) at 7, 14, and 21 days after implantation. Before imaging, all mice were anesthetized with 50 mg/kg pentobarbital sodium solution via intraperitoneal injection. During imaging, unconscious movements were monitored by periodic visual inspection via real-time circuit television.
The following MRI sequences were performed: 1) transverse T1-weighted turbo spin echo (TSE) sequence (repetition time [TR]/echo time [TE] = 3.3/1.7 msec, flip angle [FA] = 150°, slice thickness = 0.7 mm, field of view [FOV] = 90 mm × 90 mm, matrix = 448 × 448), acquisition time = 05:18; 2) transverse T2-weighted multi-shot motion-corrected radial TSE sequence (BLADE) (TR/TE = 5360.0/135 msec, FA = 160°, slice thickness = 0.7 mm, FOV = 100 mm × 100 mm, matrix = 384 × 384), acquisition time = 03:02; 3) diffusion-weighted imaging (DWI) using a multi-shot echo planar imaging sequence (TR/TE = 585.0/12.6 msec, slice thickness = 2 mm, FOV = 120 mm × 120 mm, matrix = 224 × 224, FA = 150°, b-values = 0 seconds/mm2, 600 seconds/mm2, and 800 seconds/mm2), acquisition time = 05:23; 4) T1 mapping using a modified Look-Locker sequence (TR/TE = 15.0/3.9 msec, FA = 6° and 15°, slice thickness = 0.8 mm), acquisition time = 03:55; and 5) multi-echo T2 mapping (TR = 1950 msec; TE = 11.1 msec, 22.2 msec, 33.3 msec, 44.4 msec, and 55.5 msec; FA = 180°, slice thickness = 1 mm), acquisition time = 06:30. For contrast-enhanced imaging, T1 mapping images were obtained immediately after the retro-orbital injection of 0.1 mL solution with 0.02 mL Magnevist (Bayer, Leverkusen, Germany) and 0.08 mL normal saline.
Imaging Analysis
All data were imported into a Syngo workstation (Siemens Medical Solutions, Erlangen, Germany) for measurement and analysis. From the images of routine T1-weighted and T2-weighted sequences in our study, we found the clear appearance of the tumor. Regions of interest (ROIs) were manually placed within the solid tumor region to measure the quantitative parameters from MR sequences. Two radiologists with over 10 years of experience (YHL, CM) and one radiologist with over 15 years of experience (QLS) performed the analysis. Both radiologists were blinded to the histopathological results. Quantitative MR parameters including apparent diffusion coefficient (ADC) values (×10−6, mm2/second) from the DWI sequence, T1 values (msec) from the T1 mapping with and without contrast, and T2 values (msec) from the T2 mapping. The tumor volume (mm3) and inner necrotic volume (mm3) were determined at each time point by manually delineating the hyperintense tumor area on each two-dimensional slice in T2-weighted images and contrast-enhanced T1-weighted images. The volumes were estimated by adding the individual voxel volumes inside the corresponding regions while using smaller, more sharply defined voxels to decrease the partial volume effect on the boundaries of the surface. Special care was taken to avoid non-homogeneity within the ROI.
Histology and Immunohistochemistry
Mice were euthanized after the last MRI scan was performed by administering 150 mg/kg of pentobarbital sodium solution. Hematoxylin and eosin (H&E) staining was performed to assess lymphocyte infiltration and immunohistochemistry (CD31 and Ki67) staining was conducted to examine microvessel density and proliferation of tumor growth. The tumors were fixed in a 4% phosphate-buffered formaldehyde solution for 24 hours, embedded in paraffin, and sliced. Four-millimeter sections were then deparaffinized in xylene and rehydrated in graded alcohols. Both H&E staining and immunohistochemistry (CD31 [GB12064, Servicebio, Wuhan, China] and Ki67 [GB111499, Servicebio, Wuhan, China]) staining were performed according to the standard protocols indicated by the manufacturers' instructions. The percentages of inflammation (lymphocyte cells (%) in H&E staining), cell proliferation (Ki67-positive cells (%) in immunohistochemistry), and vascular invasion (CD31-positive cells (%) in immunohistochemistry) per sample in three different fields were determined using a light microscopy system (DP72, Olympus Corporation, Tokyo, Japan) and ImageJ software (open source, NIH Image, USA).
Statistical Analysis
Statistical analyses were performed using SPSS (Version 22.0, SPSS Inc., Chicago, IL, USA). One-way analysis of variance (ANOVA) was used to analyze the differences between the orthotopic, subcutaneous, and intrahepatic groups. Correlation analysis was performed using Spearman's rank correlation coefficient (r). A P value <0.05 was considered statistically significant.
Results
Establishment of the Tumor Model and MRI Examination in Mice
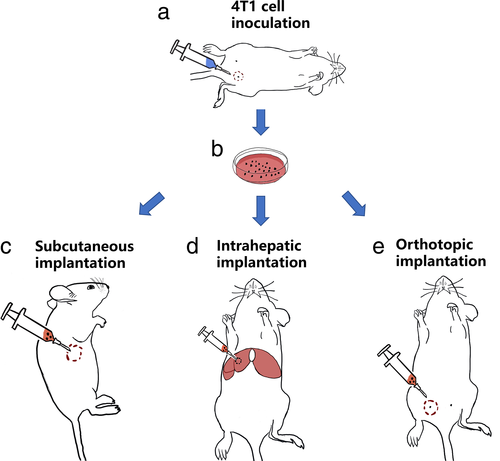
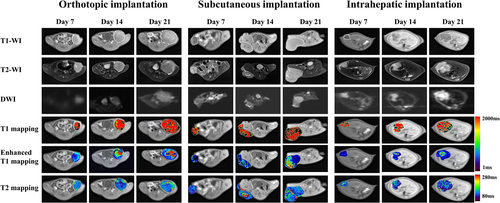
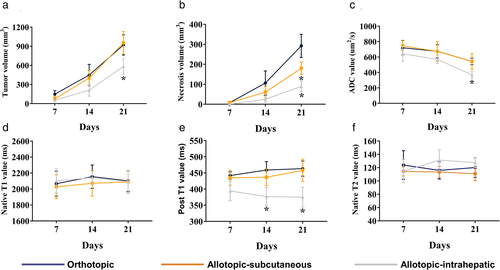
Orthotopic, subcutaneous, and intrahepatic tumor models were successfully established in all the mice (Fig. 1). Figures 2 and 3 showed the images and quantitative parameters of tumors between three groups. Various degrees of hyperintensity were seen on DWI in the intrahepatic implanted tumor, brighter than those in the orthotopic and subcutaneous implanted tumors which were quantified by ADC values (hepatic vs. orthotopic vs. subcutaneous: 369.83 ± 42.90 × 10⁻⁶, mm2/second vs. 543.41 ± 42.28 × 10⁻⁶, mm2/second vs. 542.92 ± 99.67 × 10⁻⁶, mm2/second, seen in Table 1). Tumor volume and necrosis volume increased slowly during the first 7 days post-implantation and then accelerated and reached their highest levels on day 21 in all groups (Fig. 3a,b). The intrahepatic implantation group had significantly lower tumor volume at day 21 than the other two groups (intrahepatic vs. orthotopic vs. subcutaneous: 587.50 ± 77.62 mm3 vs. 814.00 ± 43.85 mm3 vs. 956.13 ± 119.22 mm3). Additionally, on day 21, necrosis volumes of the subcutaneous and intrahepatic implantation groups were significantly lower than those of the orthotopic implantation group (intrahepatic vs. orthotopic vs. subcutaneous: 89.11 ± 26.60 mm3 vs. 292.41 ± 57.92 mm3 vs. 179.91 ± 31.73 mm3). ADC values (Fig. 3c) of the intrahepatic implantation group significantly decreased over time and at day 21 were significantly lower than those of the other two groups (shown in Table 1). Post-contrast T1 values (Fig. 3d) of the intrahepatic implantation group were also significantly lower than those of the other two groups on days 14 and 21 (Table 1). However, no significant differences were observed in native T1 (P = 0.694, P = 0.523, P = 0.834, from day 7 to day 21) and T2 values (P = 0.417, P = 0.058, P = 0.059, from day 7 to day 21) among the three groups (Fig. 3e,f, Table 1).
| MR Parameter | Day 7 | Day 14 | Day 21 | |||||||||
|---|---|---|---|---|---|---|---|---|---|---|---|---|
| Orthotopic | Subcutaneous | Intrahepatic | P Value | Orthotopic | Subcutaneous | Intrahepatic | P Value | Orthotopic | Subcutaneous | Intrahepatic | P Value | |
| Pre-T1 (msec) | 2067.05 ± 155.74 | 2027.52 ± 148.90 | 2103.07 ± 149.27 | 0.694 | 2154.65 ± 145.87 | 2071.19 ± 160.95 | 2141.90 ± 81.03 | 0.523 | 2101.76 ± 131.36 | 2088.65 ± 135.69 | 2089.33 ± 142.44 | 0.834 |
| Post-T1 (msec) | 442.00 ± 11.52 | 435.00 ± 22.90 | 394.33 ± 29.95 | 0.005* | 459.00 ± 26.11 | 436.83 ± 26.01 | 377.00 ± 27.83 | <0.001** | 463.50 ± 23.49 | 458.00 ± 34.28 | 375.00 ± 30.55 | <0.001** |
| T2 (msec) | 123.94 ± 21.47 | 114.25 ± 6.67 | 114.67 ± 17.36 | 0.417 | 115.81 ± 12.95 | 113.45 ± 8.41 | 131.33 ± 15.85 | 0.058 | 120.20 ± 14.74 | 110.72 ± 10.20 | 127.67 ± 7.53 | 0.059 |
| ADC (×10−6, mm2/second) | 720.38 ± 94.80 | 746.00 ± 64.89 | 642.50 ± 96.80 | 0.133 | 674.52 ± 86.82 | 673.08 ± 128.18 | 570.38 ± 54.35 | 0.126 | 543.41 ± 42.28 | 542.92 ± 99.67 | 369.83 ± 42.90 | 0.003* |
- ADC = apparent diffusion coefficient.
- * P < 0.05;
- ** P < 0.001.
Histological and Immunohistochemical Evaluation
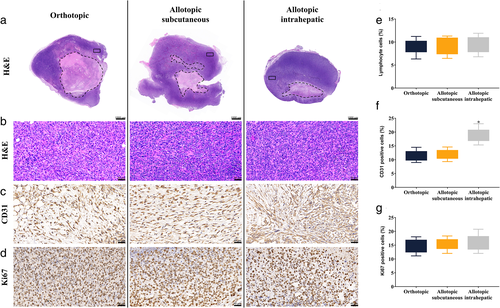
Histological analysis revealed heterogeneity in the tumor micro-environment (Fig. 4). Macroscopic H&E staining showed uneven cell density and irregular necrosis. Although focused microscopy of H&E staining (×400) revealed the presence of lymphocyte infiltration, no significant differences were observed in the number of lymphocytes among the three groups (P = 0.885). Immunohistochemical analysis of CD31 showed a dark brown stain in the cell membrane, indicating the level of vascular invasion. The positivity rate of CD31 in the intrahepatic implantation group was significantly higher than that in the remaining groups (P < 0.001). Ki67 staining, a marker of cell proliferation, showed that the nuclei were stained dark brown. The percentage of Ki67 positive cells in the orthotopic implantation group was not significantly different from that in the allotopic-implantation group (P = 0.462).
Correlations Between MR Parameters and Vascular Invasion Index
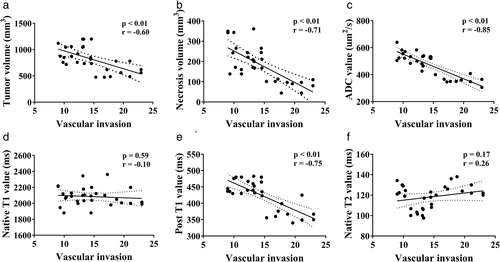
The results of the correlation analysis (Fig. 5) between the MR parameters and vascular invasion index are shown in Fig. 5. Necrosis volume, ADC value, and post-contrast T1 value were strongly correlated with vascular invasion index (r = −0.71, −0.85, and −0.75 respectively). Tumor volume was moderately correlated with vascular invasion index (r = −0.6). However, native T1 and T2 values did not correlate with the vascular invasion index (r = −0.1, P = 0.593 and r = 0.26, P = 0.173 respectively).
Discussion
Tumor growth is a complex process that is characterized by many different aspects including implantation location. In this study, we investigated tumor location by using different surgical approaches to create orthotopic and heterotopic tumor models. MRI was subsequently used to investigate the heterogeneity of tumors at different implantation locations.
Compared with conventional cell suspensions that use tissue glue and tend to cause irregular tumor shapes and artificial remote metastasis, solid tumor implantation reduces inter-tumor heterogeneity because the tumor tissue preserves the micro-environment of the tumor during the transplantation process.21, 22 In our study, we not only finished the implantation protocol within 10 min by using a 16-G needle, which was quicker than the 30 min surgery time mentioned in the previous study,23 but also ensured a high success rate of implantation (100%).
In our study, the model tumors had similar characteristics between groups with a primarily homogeneous appearance. Moreover, the levels of proliferation and lymphocyte infiltration in the models were indistinguishable. This finding is contrary to that of previous studies performing cell suspension implantation, which suggested that the orthotopic model had a more suitable environment than the heterotopic model in which the tumor cells proliferate or migrate.24, 25 This could be due to the differences between the implants. However, our results showed that tumors from different implantation locations showed heterogeneity in tumor necrosis as well as in inflammatory and vascular invasion status in vivo. Surprisingly, orthotopic tumors had faster growth rates and larger volumes than heterotopic tumors in Fig. 3a. This inconsistency may be attributed to limitations in terms of growing space for intrahepatic tumors. Conversely, the vascular invasion in intrahepatic tumors was much higher than that in orthotopic tumors. This result supports the hypothesis that specific histocytes or vasculature in implantable locations could reinforce tumor heterogeneity. Since vascular endothelia can provide important information about the progression and prognosis of tumor,26 there is a need for future investigations with more in-depth evaluation of the potential differences of orthotopic and heterotopic tumors in pre-clinical studies of contrast agents27 and of drugs against common cancer types.28
Non-invasive imaging studies are continuously being developed and are becoming more widely used. They have the important advantage of reducing animal usage as the imaging can be used to perform longitudinal monitoring in individual animals. In our study, we used a 3.0-T clinical MRI scanner with routine and functional sequences, which could be reliably applied for in vivo non-invasive characterization of tumors. Using this imaging data, the solid region and necrosis area within the tumor can be calculated to assess intra-tumor heterogeneity. Our study not only quantified the morphological characteristics of the tumor, but also correlated MRI results to immunohistochemical markers. Native T1 and T2 values of the tumor solid region do not correlate with the vascular invasion index. A possible explanation for T1 value might be that there were no obvious changes of intratumor ingredients including fat, air, and moving blood. Similarly, the differences of T2 value were not significant due to the stable intratumor composition including fat, fluids, and moving blood. However, there was a strong correlation between the post T1 value and intratumor vascular invasion, which suggested that the MRI could play an important role in assessing the level of intratumor vascular invasion. These relationships may partly be explained by the fact that the higher level of vascular invasion, the more filling the contrast agent during the arterial enhancement phase. ADC and post-contrast T1 values were strongly correlated with the vascular invasion index. These results are in accordance with those of recent studies that have indicated that non-invasive imaging findings could potentially be more accurate than some biological information, including the level of tissues, cells, or molecules.29-31
Limitations
Firstly, a single cell line was used in this study. However, it seems feasible to use other cell lines in similar studies to avoid selection bias. Secondly, metastasis might be more common in orthotopically implanted tumors because of their high fidelity to the actual implantation environment. Owing to the limited image resolution offered by MRI, micro-metastases have yet to be studied further. Finally, respiratory monitoring techniques are difficult to apply to mice, and respiratory movement during abdominal imaging may have decreased our image quality. However, we applied medical tapes to restrict these movements and obtain satisfactory results.
Conclusion
Our results show that orthotopic and heterotopic implantation presents unique micro-environments that influence growth kinetics, necrosis volume, and vascular invasion. MR quantitative parameters, including ADC and post-contrast T1 values, may noninvasively reflect vascular invasion indices in mice.
Acknowledgments
The authors acknowledge and thank Yongheng Luo (YHL), Cong Ma (CM), and Quanliang Shang (QLS) for reviewed and assessed MR images in the study. This study was supported by the National Natural Science Foundation of China (81601471; 81571784) and Provincial Natural Science Foundation of Hunan (2019JJ40434).
Conflict of Interest
All authors declare that they have no conflicts of interest.


