Muscle fiber structure in an aging long-lived seabird, the black-legged kittiwake (Rissa tridactyla)
Abstract
Many long-lived animals do not appear to show classic signs of aging, perhaps because they show negligible senescence until dying from “catastrophic” mortality. Muscle senescence is seldom examined in wild animals, yet decline in muscle function is one of the first signs of aging in many lab animals and humans. Seabirds are an excellent study system for physiological implications of aging because they are long-lived animals that actively forage and reproduce in the wild. Here, we examined linkages between pectoralis muscle fiber structure and age in black-legged kittiwakes (Rissa tridactyla). Pectoralis muscle is the largest organ complex in birds, and responsible for flight and shivering. We obtained and fixed biopsies from wild black-legged kittiwakes of known age. We then measured muscle fiber diameter, myonuclear domain and capillaries per fiber area among birds of differing ages. All muscle parameters were independent of age. Number of nuclei per mm of fiber showed a positive correlation with muscle fiber cross-sectional area, and myonuclear domain increased with muscle fiber diameter. Thus, as muscle fibers increased in size, they may not have recruited satellite cells, increasing the protein turnover load per nuclei. We conclude that senescence in a long-lived bird with an active lifestyle, does not entail mammalian-like changes in muscle structure.
1 INTRODUCTION
Aging is defined as the progressive deterioration of an organism's fitness over time, and is a quantifiable physiological phenomenon that impacts all vertebrates (Cohen, 2017). Whereas a number of evolutionary theories have been proposed to explain organismal aging (Jin, 2010), the underlying physiological mechanisms remain elusive across animal taxa, although it is likely that whole-animal and cellular-level metabolic changes contribute to senescence (Campisi & di Fagagna, 2007; Cohen, 2017; Williams, Miller, Harper, & Wiersma, 2010).
In birds, there is growing awareness that actuarial senescence (increasing mortality rates with age) is universal (b; Holmes & Martin, 2009; Ricklefs, 2008; Ricklefs, 2010a). Evidence for reproductive senescence (reduced reproductive success with age) is more equivocal, with some studies showing evidence for reproductive senescence (Elliott et al., 2014) and other studies of closely related species finding no effect (Coulson & Fairweather, 2001; Heidinger, Nisbet, & Ketterson, 2006, 2008; Holmes, 2003). One underlying cause of both actuarial and reproductive senescence could be an altered musculoskeletal system leading to altered foraging behavior. Very old birds may be unable to travel as far due to reduced muscle performance. Alternatively, very old birds may have low foraging efficiency, require more time foraging, and travel farther (Lecomte et al. 2010; but see Elliott et al., 2015; Froy, Phillips, Wood, Nussey, & Lewis, 2013), compared with younger birds. The hypothesis that altered foraging behavior with age is due to deterioration in the musculoskeletal system is supported by altered muscle ultrastructure with age in mammals (Hindle, Horning, Mellish, & Lawler, 2009; Hindle, Lawler, Campbell, & Horning, 2009). The avian pectoralis muscle may change in structure and function at the cellular level as seabirds age as well (Gonzalez-Solis, Croxall, Oro, & Ruiz, 2007; Lundgren & Kiessling, 1988).
Muscle fiber diameter is a specific physiological aspect of muscles that is closely tied to metabolism. Muscle fiber diameter in birds, across fiber types, usually falls in the range of 10–100 μm (Kinsey, Locke, & Dillaman, 2011), a limitation that prevents fibers from becoming too large, which may induce diffusion constraints of aerobic metabolism, as O2 diffuses from the blood to the mitochondria and ATP diffuses from mitochondria to cellular ATPases (Kinsey et al., 2011). Conversely, large fiber diameters are metabolically cheaper to maintain, thus there may also be a selective pressure for larger muscle fibers (Jimenez, Dillaman, & Kinsey, 2013). These two constraints on muscle fiber diameter are described by the “optimal fiber hypothesis,” the concept that muscle fibers will have a diameter that minimizes metabolic cost while also allowing for efficient diffusion of O2 and ATP (Johnston, Abercromby, & Andersen, 2006). Bird muscle has been shown to grow hypertrophically, that is, existing muscle fibers can increase in diameter in response to exercise, increases in work load and other factors including migration (Dietz, Piersma, Hedenström, & Brugge, 2007; Evans, Davidson, Uttley, & Evans, 1992; Gaunt, Hikida, Jehl Jr, & Fenbert, 1990; Marsh, 1984; Piersma & Lindström, 1997).
Because muscle is a postmitotic tissue, to grow hypertrophically, new nuclei must be drawn into the fiber itself from a population of stem-like cells, termed satellite cells, which can be found in the basement membrane of each muscle fiber, and which are limited in number throughout the lifespan of an animal (Jimenez & Kinsey, 2012). Myonuclear domain (MND) is defined as the amount of cytoplasm within a muscle fiber that each nucleus is responsible for servicing (Qaisar & Larsson, 2014). MND is an important physiological trait in aging muscle because muscle atrophy is accompanied with a loss of nuclei in the muscle fiber (Deschenes, 2004). The number of capillaries per fiber area (CFA) is also a key trait to measure in aging muscle as capillaries provide oxygen and nutrients to power muscles. Capillary density usually follows the aerobic potential around the muscle fiber, meaning that slow oxidative fibers have higher densities of capillaries compared with fast glycolytic (anaerobic) ones (Torrella et al., 1998). However, it should be noted to that others (Bosutti et al., 2015) have determined that capillary density more closely matched fiber size than aerobic potential of the fiber.
Here, we examined linkages between muscle fiber structure and age in black-legged kittiwakes (Rissa tridactyla) to better understand physiological aging in a long-lived seabird. Specifically, we analyzed the pectoralis major muscle in kittiwakes, a muscle which seems to be composed of fast-twitch oxidative-glycolytic fibers, similar to other seabirds (Caldow & Furness, 1993). The pectoralis muscle is responsible for the down stroke in wing beats during flight, and aids in maintaining outstretched gliding (Torrella et al., 1998). We looked at age-related changes in muscle fiber cross-sectional area (FCSA), fiber diameter, MND and CFA. We predicted that fiber diameter, MND and CFA would decline with age. Many studies on humans and rats show that muscle fiber diameter, MND and CFA decrease with age (Frontera et al., 2000; Hepple, Ross, & Rempfer, 2004; Lexell, Taylor, & Sjostrom, 1988; Tomanek, 1970; Young, Stokes, & Crowe, 1985); thus, we expected to see a similar decrease in these parameters as kittiwakes aged. However, seabirds are long-lived despite their higher metabolic rates, thus, it could be that to extend their longevity skeletal morphology remains unchanged even after senescence. If this is accurate across ageing birds, it may provide new avenues to unravel the underlying mechanisms of preventing age-related changes to occur. This information may be valuable in human muscle wasting disease and weakness.
2 MATERIALS AND METHODS
2.1 Field site
Black-legged kittiwakes, Rissa tridactyla (Linnaeus, 1758), were captured at an abandoned U.S. Air Force radar tower in Middleton Island (59° 26′ N, 146° 20′ W), Alaska (Gill & Hatch, 2002; Hatch, 2013). The tower has become a research site, as each of the walls has been replaced with a series of windows with one-way glass to closely observe wild kittiwakes. Birds were caught with a hook after replacing their eggs with ceramic eggs temporarily to prevent crushing of eggs. Roughly 70 pairs of kittiwakes have been supplemented annually with food throughout the breeding season since 1995 (Gill & Hatch, 2002). As the window-sites that are supplemented have been consistent, and kittiwakes are site-faithful, most “fed” kittiwakes have been fed throughout their adult lives. All birds nesting on the tower are banded annually, and chicks are banded before they fledge. Consequently, about 30% of adults are of known age, with the remaining individuals recruiting from off the monitored area of the tower and therefore of unknown age. We selected incubating individuals (20–30 days into incubation) grouped into three categories: young (7–9), middle-aged (10–14), and old (15+ years). Given that reproductive success peaks between age 9 and 14 in our study population (Elliott et al., 2014), with lower reproductive success before and after, we believe our sample was likely representative of natural aging trends in this species. Moreover, mortality rates are nearly double for ages 15+ compared to ages 10–14 (KHE, unpubl. data). Sex was determined for each individual using courtship and mating behaviors. We also recorded body mass and structural size such as head-bill length, which is the most accurate and repeatable measure of structural size among those investigated by Jodice, Lanctot, Gill, Roby, and Hatch (2000). As no other estimate of body condition (i.e., mass corrected for size) predicts lipid mass better than body mass (Golet & Irons, 1999; Jacobs et al., 2012), we included body mass in analyses. We also included structural size in models to account for overall body size.
2.2 Biopsies
We obtained muscle biopsies from a total of 27 black-legged kittiwakes, 16 males and 11 females. This included samples from 4 young birds, 9 middle-aged birds, and 14 old birds.
We obtained muscle biopsies by placing the individual kittiwake in a sock with a hole over the left pectoralis muscle so that it remained still. We covered the head with a cloth to reduce stress. One person performed the biopsy, while the other continuously monitored the individual. To find the thickest area of the pectoralis, we located the feather tract on the left breast. We cleaned the skin with Hibiclens and injected 0.05 mL of Lidocaine HCl 2% subcutaneously, up to 2 mm deep, in three or four spots using a 1 mL tuberculin syringe with a 26½ G needle, followed by 0.10 mL ketoprofen injected in the same way. After a 2 min delay to allow for local anesthesia, we first used a scalpel to make a paramedian incision through the skin just large enough to insert the 6 mm biopsy punch. With forceps, we lifted the fat and cut it off, then gently used a biopsy punch to obtain the sample. The biopsy plug was pulled up with forceps and cut, then inserted into a vial containing 4% paraformaldehyde and stored at room temperature. We used a cruciate stitch on the biopsy area, adding more stitches if needed, and applied tissue adhesive (Vetbond, 3 M). Once the incision was closed and tissue adhesive was dry, we released the individual. All individuals were seen again after release. Birds were sampled 2 months after spring migration, and 2 months before fall migration to control for muscle size changes associated with migratory phenotypes. Biopsies were approved under McGill Animal Use Protocol 2016–7,814 and under permits from the US Fish & Wildlife Service (MB01629B) and the Alaska Department of Fish & Game (17–162).
2.3 Muscle sectioning and staining
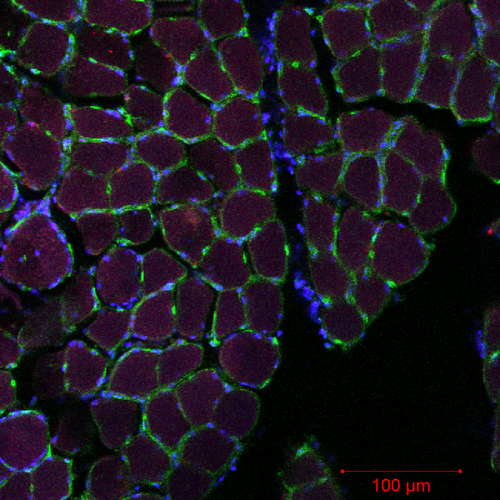
After fixing pectoralis muscle in 4% paraformaldehyde for 2 months, we placed muscle sections in 30% sucrose overnight to cryoprotect samples. Tissues were mounted in optimal cutting-temperature (OCT) compound (Scigen Scientific) and allowed to equilibrate to −20 °C in a Microm HM 505 N cryostat before sectioning. The biopsy was divided in two pieces: one oriented in cross-section (for fiber diameter and FCSA measurements), and the other oriented longitudinally (to measure longitudinal nuclei size for MND determination). Sections were cut at 30 μm, picked up on plus slides (Fisher scientific), air-dried at room temperature, and, then, stained with a 250 mg/mL solution of wheat germ agglutinin (WGA) with Alexa Fluor 488 (Molecular probes, Inc.), DAPI (Molecular probes, Inc.), and Griffonia simplicifolia lectin (GSL) 694 (Molecular probes, Inc.) for 30 mins, then rinsed in avian ringer's for 60 min. WGA can nonspecifically bind to the background of the tissue so longer rinsing times are necessary. WGA is a lectin that binds to glycoproteins on the basement membrane of the fiber sarcolemma and effectively outlines the fiber periphery to allow measurements of fiber size (Nyack, Locke, Valencia, Dillaman, & Kinsey, 2007; Wright, 1984). DAPI binds to nuclei and GSL binds to capillaries. Stained slides were examined with a Zeiss 710 laser filter confocal microscope. Polygons were traced along the fiber periphery using Image J, version 1.5 (Rasband, 1997–2018) to determine fiber diameter and FCSA (Jimenez et al., 2013; Nyack et al., 2007). We collected one section, cut another two slices (60 μm) and collected the next section. Each stain was analyzed using each stain's individual channel. To manually count capillaries and myonuclei, we used split images of each of our stains, so that we could identify capillaries and myonuclei independently of the other two stains. Forty-five fibers were randomly chosen and measured for averages for each individual (Figure 1). The 45 fibers were counted across three randomly chosen sections on each slide (~15 fibers per section). If there were oblique sections, we did not use that section to quantify any of our parameters. We did not count any fibers that showed any degree of muscle fascicle separation or freeze fracture.
2.4 Nuclear domain determination


2.5 Capillaries per fiber area
FCSA and CFA were analyzed using Image J. Capillary counts were measured by manual count of the number of capillaries touching the fiber. CFA was obtained by dividing the capillary counts by muscle FCSA of each individual fiber (Ross, Overton, Houmard, & Kinsey, 2017).
2.6 Statistical analysis
We ran stepwise regressions in R version 1.0.143 (R Core Team, 2017) with the MASS package version 7.3–48 (Venables & Ripley, 2002) to evaluate explanatory variables (mass, structural size, sex, fed or unfed, age) within our muscle parameter data set. We then conducted a principal components analysis (PCA) to examine for relationships within muscle parameters themselves. We used the MASS function stepAIC to determine which of the remaining muscle parameters best explained each muscle parameter. Results were considered significant if p < .05. Raw data obtained in this study are provided in Supporting Information.
3 RESULTS
3.1 Relationships between muscle parameters age, and sex
Structural body condition (i.e., head-bill length), body mass and supplemental feeding showed no statistically significant relationships with muscle fiber diameter or muscle FCSA, implying that fiber diameter and muscle FCSA are maintained across the available variation in these parameters. Thus, we used age and sex to determine relationships of muscle structure.
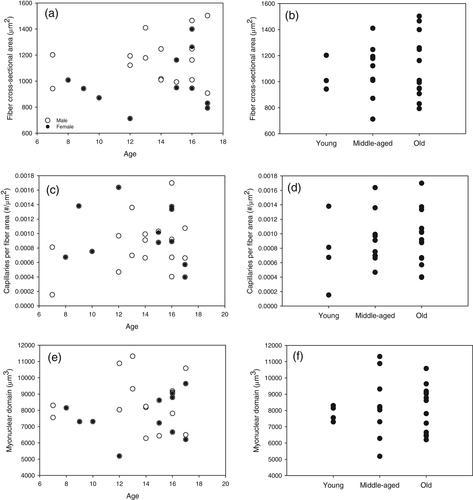
Fiber diameter was best modeled by sex alone (r2 = .18, p = .04). Muscle FCSA area was best modeled by sex alone (r2 = .24, p = .02; Figure 2). MND was not significantly related to any variable (global model: r2 = .05, p = .12).
3.2 Relationships among muscle parameters
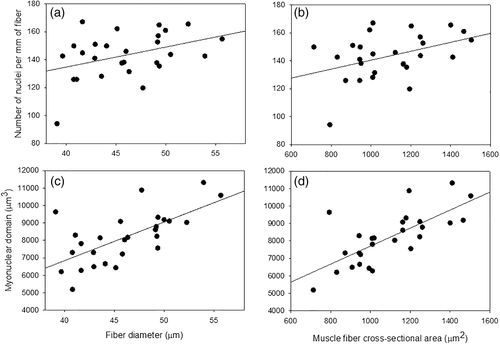
Fiber diameter and FCSA were closely correlated (t25 = 12.8, p < .0001, r2 = .87), as they measure similar properties. FCSA and number of nuclei per fiber and MND were coregulated (r2 = .83, p < .0001; r2 = .96, p < .0001, respectively; Figure 3). Additionally, MND was best modeled by FCSA, and CFA (r2 = .50, p = .0006). The values for different muscle parameters in other bird species across the literature are shown in Table 1.
| Species | Cross-sectional area (um2) | Total capillaries per fiber area (#/um2) | Number of nuclei per fiber | Typical body mass (g) |
|---|---|---|---|---|
| Kittiwake (pectoralis) | 1,090 ± 210 | 0.0009 ± 0.0004 | 143 ± 160 | 419 ± 43 |
| Yellow-legged gull (Larus cachinnans), Torrella, Fouces, Palomeque, and Viscor (1998) | 1,600 ± 80 | 0.0031 ± 0.0003 | – | 1,062 ± 63 |
| Mallard (Anas platyrhynchos), Torrella et al. (1998) | 1,140 ± 130 | 0.0033 ± 0.0002 | – | 1,009 ± 82 |
| Common coot (Fulica atra), Torrella et al. (1998) | 1,380 ± 110 | 0.0036 ± 0.0002 | – | 794 ± 53 |
Tufted duck (Aythya fuligula) Turner and Butler (1988) |
1,141 ± 123 | 0.0042 | – | 638 ± 26 |
Chicken (Gallus domesticus) Belichenko, Korostishevskaya, Maximov, & Shoshenko, 2004 |
3,316 | 0.0002 | – | 910 |
Andean coot (Fulica Americana peruviana) Leon-Velarde et al. (1993) |
1,055 | 0.0045 | – | 450.8 |
Sand Martin (Riparia riparia) Lundgren and Kiessling (1988) |
863 | 0.006 | – | 12.7 |
Sedge warbler (Acrocephalus schoenobaenus) Lundgren and Kiessling (1988) |
892 | 0.006 | – | 11.8 |
Reed Warber (Acrocephalus scirpaceus) Lundgren and Kiessling (1988) |
673 | 0.008 | – | 12.3 |
Willow warbler (Phylloscopus trochilus) Lundgren and Kiessling (1988) |
717 | 0.007 | – | 10.7 |
Robin (Erithacus rubecula) Lundgren and Kiessling (1988) |
1,003 | 0.005 | – | 17.3 |
Blackbird (Turdus merula) Lundgren and Kiessling (1988) |
1,075 | 0.005 | – | 103.2 |
Reed bunting (Emberiza schoeniclus) Lundgren and Kiessling (1988) |
1,118 | 0.005 | – | 18.4 |
Marsh tit (Parus palustris) Lundgren and Kiessling (1988) |
1,115 | 0.004 | – | 11.2 |
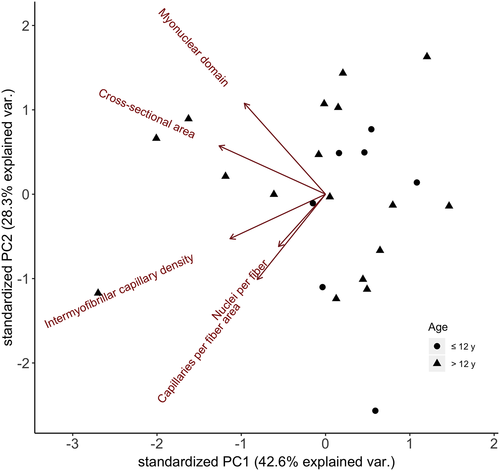
A principal components analysis (Figure 4) demonstrated that the first component explained 43% of the variance, the second component explained 28% of the variance, the third component explained 22% of the variance, and the remaining components combined explained less than 7% of the variance (Table 2). The first component loaded on all muscle parameters implying that some individuals had high levels of all parameters while other individuals had low levels of all parameters. The second component loaded positively on MND and negatively on CFA and nuclei per fiber, demonstrating that individuals with large MND tended to have low CFA and nuclei per fiber (Table 2).
| PC1 | PC2 | PC3 | PC4 | PC5 | |
|---|---|---|---|---|---|
| Proportion of variance explained | 0.45 | 0.27 | 0.22 | 0.06 | 0.00 |
| Loading (cross-sectional area) | 0.57 | 0.34 | 0.33 | 0.00 | 0.67 |
| Loading (total capillaries per fiber area density) | 0.39 | −0.56 | −0.33 | 0.66 | 0.00 |
| Loading (intermyofibrillar capillaries per fiber area density) | 0.52 | −0.28 | −0.37 | −0.72 | 0.00 |
| Loading (number of nuclei per fiber) | 0.29 | −0.35 | 0.77 | 0.00 | −0.45 |
| Loading (myonuclear domain) | 0.43 | 0.62 | −0.21 | 0.21 | −0.59 |
- Note: Confocal microscopy image (20x magnification) of black-legged kittiwake pectoralis muscle cross-sectioned and stained with Wheat Germ Agglutinin (WGA, Alexa Fluor 488), to highlight the sarcolemmal membrane (green), DAPI to mark the nuclei (blue), and Griffonia simplicifolia lectin (GSL, red), which labels capillaries.
4 DISCUSSION
Here, we examined age-related changes in muscle fiber diameter, MND and FCA in a long-lived seabird, the black-legged kittiwake. We found that skeletal muscle did not show signs of atrophy with age, and CFA and MND do not change as black-legged kittiwakes age. No muscle parameter was strongly associated with age. However, males had larger FCSA than females. We also found relationships between the number of nuclei per fiber, MND, fiber diameter and FCSA. Data collected from the available literature on muscle histology points to the fact that the measurements included in the present study are rare in the literature, especially those related to MND in wild species of birds (Table 1). FCSA and CFA, when plotted against typical body masses of each species, demonstrate positive and negative scaling, respectively (Supporting Information Figure S1).
We found positive relationships between the number of nuclei per fiber, MND, fiber diameter and FCSA. Previous studies have examined the relationship between number of nuclei per fiber and muscle fiber size and have found that during hypertrophy, nuclei are added to muscle fibers (Rosenblatt & Parry, 1992; Rosenblatt, Yong, & Parry, 1994), likely implying that more nuclei are needed to maintain the amount of cytoplasm each nuclei is servicing as muscle fiber increases. On the other hand, muscle atrophy has been found to be coupled with a decrease in number of nuclei per fiber, likely because an excess of nuclei in a smaller fiber would be metabolically redundant, since protein turnover would need to decrease (Hikida, Van Nostram, & Murray, 1997). Muscle fiber cytoplasm is a highly organized space comprised of the metabolic and contractile machinery of these cells. Thus, regulation of muscle fiber diameter and/or FCSA could be viewed as a balance between synthesis and degradation of cytoplasmic constituents (Hughes & Schiaffino, 1999). In chickens, postnatal development in muscle fibers includes an increase in fiber size with a concomitant increase in number of nuclei to maintain constant nuclear-to-cytoplasmic-ratios (Hughes & Schiaffino, 1999). Satellite cells proliferate into existing fibers to maintain this ratio. After postnatal development, satellite cells in birds have been shown to proliferate following stretching (Winchester & Gonyea, 1992). However, in our data, number of nuclei did not increase proportionally to fiber size as evidenced by the fact that MND increased significantly with fiber diameter. This finding is consistent with an increase in the MND of white muscle of fishes as a result of an increase in muscle fiber hypertrophic growth (Jimenez & Kinsey, 2012).
A positive relationship between fiber diameter/FCSA and MND would be potentially disadvantageous as it has fiber diameter increases, there is not a proportional increase in number of nuclei per fiber to accommodate increasing diffusion distances. This relationship implies functionally that as muscle increases in diameter, it may not be recruiting satellite cells or there may not be any satellite cells left to recruit in older birds, thus, increasing the protein turnover load per nuclei (Kinsey et al., 2011). Others highlighted that variations in MND size were ascribed only to physiological or pathological conditions (Hughes & Schiaffino, 1999). In contrast, there have been cases studied where MND increased. In the mammalian literature, a decrease in innervation appears to be causative for sarcopenia, and concomitant decreases in MND (Hughes & Schiaffino, 1999). However, black-legged kittiwakes continue to forage actively throughout their lives, implying no innervation decreases due to continued performance. Studies have shown conflicting results when examining variation in number of myonuclei in age for humans, mice and birds—some authors have shown no changes in number of myonuclei, whereas others have shown increases in the number of myonuclei with age (Van der Meer, Jaspers, & Degens, 2011).
The concept of symmorphosis posits that physiological adaptations are not wasteful; thus, in the case of muscle parameters, supply must meet demand. This is the case, when it comes to muscle FCSA and CFA, the more aerobic the fiber, the higher the surrounding capillary density must be to supply enough O2 and to decrease diffusion distances between O2 supply and mitochondria within the muscle fiber (Torrella et al., 1998; Torrella, Fouces, Palomeque, & Viscor, 1996). We found no significant relationship between CFA and age. Thus, activities such as foraging or escaping predators, where muscles are critically relied upon, are not impaired by increasing FCSA. Others have found that in three different species of birds, yellow-legged gull (Larus michahellis), mallard (Anas platyrhynchos) and coot (Fulica americana), CFA in aerobic and anaerobic fibers closely match energetics and locomotory patterns exhibited by each species (Torrella et al., 1998); these findings and CFA are similar to ours (Table 1). Furthermore, in seven species of wild and domestic birds, there was no correlation between CFA and FCSA, suggesting that increases in FCSA are not dependent on changes in capillarity to offset O2 diffusion limitations (Snyder, 1990).
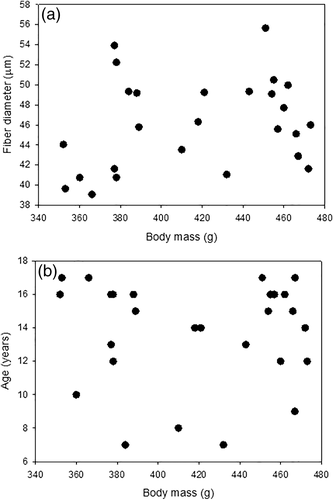
We did not find strong evidence of a relationship between muscle fiber diameter and age, or fiber diameter and body mass (Figure 5), although we observed a marginal increase in muscle FCSA with age. Thus, the direction of the relationship was contrary to our prediction. In humans, normal muscle aging patterns show a decrease in muscle fiber diameters with age through sarcopenia (Frontera et al., 2000; Lexell et al., 1988; Young et al., 1985), although it is unclear whether age-related decreases in muscle fiber diameter is a general trend in most animals or just the pattern observed in humans and mammals (Frontera et al., 2000, Lexell et al., 1988, Young et al., 1985). Age-related reduction in muscle mass does not occur until after the age of 70 years old in humans, and similarly is only detectable in old rats (Van der Meer et al., 2011). We included birds up to 17 years old, whereas the oldest known individual in our population is 24. Thus, while, we believe that our age range was large enough to be able to detect an effect should one be present, it may be that atrophy does not occur until very late in life for this species. A potential mechanistic and metabolic advantage to increasing muscle fiber size with age, potentially through hypertrophy as fiber diameter does not change with body mass (Figure 5), is that muscle fiber diameter is associated with whole-animal metabolism, so that larger fibers are metabolically advantageous for animals, since there is a lower surface area-to-volume cost associated with maintaining the membrane potential (Frontera et al., 2000; Jimenez et al., 2013; Kinsey et al., 2011; Lexell et al., 1988; Young et al., 1985). Although resting metabolic rate declines with age in our study population, daily energy expenditure does not, perhaps describing one potential mechanism for the lack of statistical significant change in muscle fiber diameter (Elliott, 2014; see also Elliott et al., 2015, Moe, Angelier, Bech, & Chastel, 2007). Thus, muscle tissue may alter its ultrastructure to match whole-animal metabolic demands. Given the decreases in resting metabolic rate with age and that body mass does not change with age in kittiwakes (Figure 5), the trend for increasing fiber diameters would point to metabolic savings (Jimenez et al., 2013). However, constant metabolic rate with age implies no changes to the size of muscle fibers. It should be noted here that the seemingly hypertrophic muscle growth we detected in aging kittiwakes may imply that some population of muscle fibers in the kittiwake pectoralis muscle are atrophying and being tagged for degradation with increasing age, and remaining fibers are increasing in size to maintain muscle function (Priester, Morton, Kinsey, Watanabe, & Dillaman, 2011).
Although positive foraging conditions improve overall body condition in kittiwakes, primarily via its impact on lean mass (Golet & Irons, 1999; Jacobs et al., 2011, 2012; Schultner, Kitaysky, Welcker, & Hatch, 2013), we found no impact of supplemental feeding on muscle parameters. Thus, although unfed birds have reduced body mass at our study site (Schultner et al., 2013), and presumably reduced muscle mass (Golet & Irons, 1999; Jacobs et al., 2011, 2012), cellular-level muscle parameters, such as diameter and CFA, remain unchanged. We conclude that such parameters are important for flight and that kittiwakes are unable to alter those parameters even when conditions worsen.
Our data suggest that the nature of muscle fiber structure and how it changes with age may be complex and could vary from species to species. Muscle fiber ultrastructure has been thoroughly researched in humans and it is known to decrease with age. However, black-legged kittiwakes did not exhibit this decrease (Frontera et al., 2000; Lexell et al., 1988; Young et al., 1985). Sex and diffusion distances within muscle were apparently more important than age. Fibers with larger MND may have lower CFA because some of these fibers may begin to be diffusion-limited for metabolic products, such as O2. Similarly, that relationship may limit protein turnover, potentially decreasing the production of contractile proteins. This may suggest a new potential mechanism of how long-lived birds age. While it is possible that we were simply unable to detect a trend due to the absence of very old kittiwakes, we believe that is unlikely as mortality increases sharply beyond age 12 (Elliott 2013). Half of our sample size was older than 12, as we targeted old birds to compare with younger ones, and so we would expect that if altered muscle structure is associated with age-related mortality, we would be able to detect an association between age and muscle structure in these senescent (i.e., showing an increase in mortality) individuals.
ACKNOWLEDGMENTS
We are grateful to Drs. Jason Meyers and Wan-chun Liu for allowing us to use their cryostats. Dr. Z M. Benowitz-Fredericks trained KL and SW on biopsy procedures, and helped supervise their collection. L. M. Lacey, S. Collins, and A. Mouillier helped in the field. The field work was funded by NSERC (Discovery Grant and Canada Research Chair in Arctic Ecology).


