Feasibility study on the use of attenuated total reflectance mid-infrared spectroscopy for the analysis of malt quality parameters in wort
Abstract
The feasibility of using attenuated total reflectance in combination with mid-infrared (MIR) spectroscopy for the analysis of malt quality parameters in wort, such as free α-amino acid (FAN), apparent attenuation limit (AAL), soluble protein (SP) and viscosity (VIS), was evaluated. The coefficients of determination in cross-validation  and the standard error of cross-validation were 0.81 and 10.3 mg L−1 for FAN, 0.80 and 1.49% for AAL, 0.78 and 0.18% for SP and 0.69 and 0.13 cP for VIS. Good calibration and validation statistics were obtained for AAL. However, for nitrogenous compounds the MIR predictions can only be used as approximate estimates of the true concentrations, for example to rank samples (low, medium, high) in the context of a breeding programme. Copyright © 2014 The Institute of Brewing & Distilling
Introduction
Several methods (spectrophotometric, enzymatic, non-enzymatic, chromatographic and electrophoretic) have been developed for the determination of compositional parameters in wort samples. However, when a large number of samples are analysed, rapid, reliable, automatic, accurate and precise analytical methods that require only a low input of chemical reagents and few or no sample preparation steps are ideal. In addition, the simultaneous measurement of several parameters from the same sample is of great interest as this would provide immediate information about the characteristics of that sample.
Numerous reports have illustrated and reported applications of Fourier-transformed mid-infrared (FT-MIR) spectroscopy using transmission cells to quantify sugars and other compositional parameters in several fruit juices, olive oil, milk, beer and wine samples 1-8. The main advantage of the transmission cell is that it provides very accurate and reproducible spectroscopic measurements. However, this sampling technique has several drawbacks, such as the need for filling and cleaning of the cell, variation of sample path length owing to window wear and turbidity of the sample, among other factors 1-8. These issues are critical when high-throughput analyses are required (e.g. breeding and selection). Tenhunen and co-workers 9 compared near-infrared and MIR spectroscopy to measure sugars and compounds containing nitrogen in wort samples. The authors stated that the MIR method gave slightly better results for most compounds compared with near-infrared, despite the problems in sample preparation 9. The same authors concluded that the application of MIR spectroscopy for the routine analysis of worts would be cumbersome and would require expensive custom-built units for sample handling and custom-built transmission cells 9.
The development of sampling accessories such as attenuated total reflectance (ATR) cells, has led to major improvements in routine analysis of liquid samples using MIR spectroscopy by simplifying sample handling and avoiding measurement problems often found using transmission cells 10, 11. The ATR sample presentation relies on a sample absorbing the incoming infrared radiation by internal reflection from the surface of a high-refractive index transparent medium 10, 11. The ATR absorption mechanism is due to two phenomena: a rapid change in sample refractive index across an infrared absorption peak, and the molar absorption coefficient attributed to the vibrational mode 10, 11. The change in refractive index can cause severe peak distortions in the MIR spectrum, particularly if the incident angle is near the critical angle, but such distortions are usually small at the higher angles near 45° used in most ATR accessories 10, 11. The combination of MIR spectroscopy with multivariate data methods such as partial least squares regression can allow the development of calibrations that can measure several analytical parameters simultaneously 12.
The aim of this study is to evaluate the feasibility of using ATR combined with MIR spectroscopy for the analysis of compositional parameters in wort such as free α-amino acid (FAN), apparent attenuation limit (AAL), soluble protein (SP) and viscosity (VIS).
Materials and methods
Samples and reference data
Wort samples (n = 160) sourced from commercial malting barley varieties Navigator, Admiral, Commander, Flagship, Schooner and experimental breeding crosses were used. Barley samples were obtained from harvests at two locations in South Australia (Charlick and Roseworthy) during the 2012–2013 growing season. Wort was obtained after micromalting the samples following the small-scale European Brewing Convention (EBC) malt extract method employed as routine at the Barley Quality Laboratory, University of Adelaide 13. Free amino nitrogen, AAL, SP and VIS were measured in the wort samples using standard EBC reference methods of analysis 14.
ATR-MIR instrument
Samples were scanned using a platinum diamond ATR single reflection module cell mounted in a Bruker Alpha instrument (Bruker Optics GmbH, Ettlingen, Germany). The MIR spectra were obtained using OPUS software version 6.5 provided by the instrument manufacturer (Bruker Optics GmbH, Ettlingen, Germany). The spectrum of each sample was obtained by taking the average of 64 scans at a resolution of 4 cm−1 and acquired between 4000 and 375 cm−1, with a scanner velocity of 7.5 kHz and a background of 64 scans. Air was used as reference background. Milli-Q water was used to clean the ATR cell to avoid carryover between samples and dried using disposable laboratory wipes.
Data analysis
Spectra were exported from the OPUS software in GRAMS format (*.spc) into The Unscrambler X software (CAMO ASA, Oslo, Norway) for chemometric analysis. Multivariate regression (calibration) models between chemical compositional values and MIR spectra were developed using partial least squares (PLS1) regression with full cross-validation 15. The optimum number of terms in the PLS1 calibration models was indicated by the lowest number of factors that gave the minimum value of the prediction residual error sum of squares in cross-validation in order to avoid over-fitting in the models 15. The ATR-MIR spectral data was processed using the second-derivative Savitzky–Golay (second derivative, 40 smoothing points and second polynomial order) in order to remove and correct for baseline effects 16. The second derivative is a measure of the change in the slope of the curve, ignoring the offset, and is very effective in removing both baseline offset and slope from a spectrum 16. Statistics calculated for the calibrations included the coefficient of determination in cross-validation  , the standard error of cross-validation (SECV), bias and slope. The prediction accuracy of the models was tested by randomly splitting the data set into training (calibration) (n = 110) and validation (n = 50) sets. In addition the residual predictive deviation (RPD = SD/SECV, where SD is standard deviation) was also calculated 17.
Results and discussion
The ATR-MIR spectrum of the wort samples is shown in Fig. 1. The MIR spectrum is dominated by intense peaks around 3300 cm−1 (water) and 1636 cm−1 (water and nitrogen) and between 1500 and 900 cm−1 (fingerprint region) 18. The observed peaks might also be related to the CH-OH and alkyl frequencies for sugars (e.g. glucose and fructose) between 1000 and 1600 cm−1, while most of the spectroscopic variation was observed between 900 and 1600 cm−1 mainly related to different biochemical and chemical compounds present in wort (e.g. sugars, nitrogen, lipids) 18. Bands between 1500 and 1200 cm−1 are assigned to deformations of –CH2 and deformations of C–C–H and H–C–O, respectively, where peaks between 1200 and 950 cm−1 are explained by stretching modes of C–C and C–O 18.
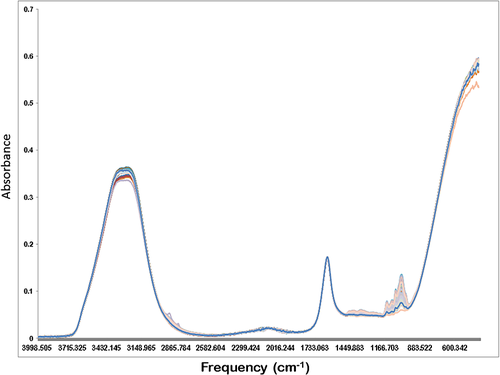
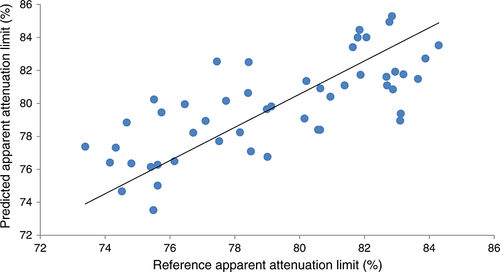
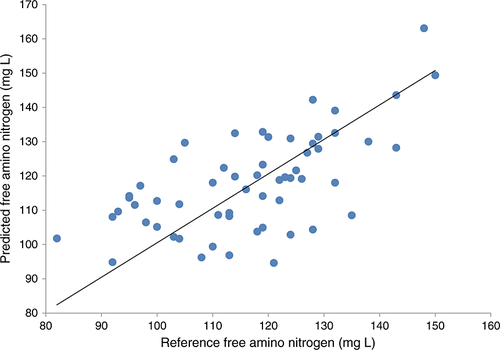
Table 1 shows the descriptive statistics (mean, SD and range) for both the calibration and validation sets. The chemical composition of the wort samples showed a wide range of composition owing to the different samples analysed. The variability in chemical composition was considered suitable to develop calibration models based on MIR. Statistics for the PLS1 calibrations developed using the wort samples analysed are shown in Table 2. The  and SECV were 0.81 and 10.3 mg L−1 for FAN, 0.80 and 1.49% for AAL, 0.78 and 0.18% for SP and 0.69 and 0.13 cP for VIS. The RPD values obtained for the parameter analysed were ≤2, indicating that these calibrations can only be used for qualitative determination of these parameters in the wort samples analysed (low, medium and high). It is well known that, if the SECV is large compared with the range of composition (as SD), a relatively small RPD value results, and the PLS calibration model is not considered robust 7, 11, 17. The higher the value of the RPD, the greater the probability of the model predicting the analyte accurately in samples outside the calibration set 7, 11, 17. An RPD value >3 is considered fair and recommended for screening purposes, while a RPD value >5 is considered good for quality control. Lower RPD values can result from a narrow range of the reference values (small SD) or from a large error in the prediction (SECV) compared with the variability of the reference values 7, 11, 17. However, for the purpose of qualitative interpretations using calibration models, RPD values <1.5 are considered insufficient for most applications, whereas RPD values ≥2 are considered acceptable 7, 11, 17. In this study the RPD values obtained for AAL (RPD = 2) and FAN (RPD = 1.9) were considered adequate for monitoring these analytes in wort samples. However, the calibration can still be useful for quality control purposes in the brewery, since the specified values for nitrogenous compounds usually cover a rather broad range of values 7, 11, 17. This finding explains the fact that calibration and validation of the method depend very strongly on the composition of the sample set and on the quality of the reference analysis. It might not be possible to obtain a single calibration for all of the analysed samples and in some cases individual calibrations for specific samples are required, in particular when this application will be used to analyse samples derived from breeding crosses. Figures 2 and 3 show the actual (reference) vs predicted values (cross-validation) for AAL and FAN in the set of wort samples analysed. Table 3 shows the validation statistics for the prediction of FAN, AAL, SP and VIS using ATR-MIR spectroscopy. The coefficients of correlation and the root mean square of the standard error of prediction were 0.78 and 13.7 mg L−1 for FAN, 0.76 and 2.75% for AAL, 0.30 and 0.50% for SP and 0.53 and 0.21 cP for VIS.
| Mean | SD | Range | |
|---|---|---|---|
| Calibration (n = 110) | |||
| AAL (%) | 79.2 | 3.4 | 72–84 |
| FAN (mg L−1) | 116.4 | 19.9 | 101–158 |
| SP (%) | 3.88 | 0.32 | 3.2–4.7 |
| VIS (cP) | 1.8 | 0.21 | 1.5–2.5 |
| Validation (n = 50) | |||
| AAL (%) | 79.1 | 3.2 | 73.9–84.3 |
| FAN (mg L−1) | 117.7 | 16.2 | 82–154 |
| SP (%) | 3.8 | 0.30 | 3.2–4.3 |
| VIS (cP) | 1.8 | 0.20 | 1.5–2.5 |
- SD, standard deviation; AAL, apparent attenuation limit; FAN, free amino nitrogen; SP, soluble protein; VIS, viscosity; n, number of samples.
 |
SECV | Bias | Slope | RPD | PLS terms | |
|---|---|---|---|---|---|---|
| AAL (%) | 0.80 | 1.49 | −0.04 | 0.74 | 2.0 | 7 |
| FAN (mg L−1) | 0.81 | 10.3 | −0.31 | 0.61 | 1.9 | 5 |
| SP (%) | 0.78 | 0.18 | 0.012 | 0.68 | 1.5 | 3 |
| VIS (cP) | 0.69 | 0.13 | 0.0012 | 0.54 | 1.6 | 11 |
-
 , Coefficient of determination in cross-validation; SECV, standard error of cross-validation; PLS, partial least squares; RPD = SD/SECV.
| R | RMSEP | Slope | |
|---|---|---|---|
| AAL (%) | 0.76 | 2.75 | 0.88 |
| FAN (mg L−1) | 0.78 | 13.7 | 0.57 |
| SP (%) | 0.30 | 0.50 | 0.40 |
| VIS (cP) | 0.53 | 0.21 | 0.80 |
- R, Coefficient of correlation; RMSEP, root mean square of the standard error of prediction.
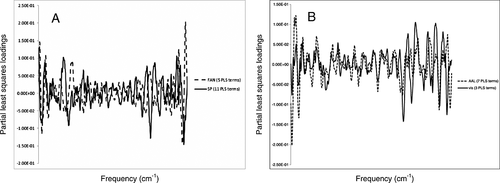
Loadings are used to determine which variables (wavenumbers) are important for describing the variation in the dataset. They can also be used to determine the inherent dimensionality of the data set as well as to identify unusual variables 19. In this study, loadings were used to identify the most important wavenumbers that describe the main variation for each of the optimal PLS1 calibration models developed (Fig. 4). Strong, sharp and well-defined peaks in the fingerprint region used to develop the calibration models were observed. The loadings derived from the calibrations were different for each of the parameters developed, indicating that the MIR spectra contain the information required to develop a specific calibration. Absorption values around 1060 cm−1 are related to sugars, as reported by other authors 18, 20. Loadings for FAN and SP showed absorption bands around 1650 and 1589 cm−1 related to N–H bending and N = O stretching and around 1570–1450 and 1300–1370 cm−1 related to N–H stretching associated with compounds containing nitrogen 18, 19. The highest loadings for AAL and VIS were observed in the region between 900 and 1600 cm−1, mainly related to sugar concentration (e.g. glucose) and water 18, 21.
The practical implications of this study showed that ATR-MIR spectroscopy has valuable benefits for the analysis of wort samples sourced from breeding or quality control programmes. Examination of the calibration loadings might provide insights into aspects of wort biochemistry and composition that are related to characteristics of interest sought by breeders or maltsters. This technique might also provide a rapid tool to monitor the different steps during malting or the fermentation process. These methods also offer the possibility to develop relationships between spectra and reference methods in order to measure several parameters, simultaneously reducing the time of analysis and requiring minimal sample preparation.
For nitrogenous compounds the MIR predictions can be used as approximate estimates of the true concentrations. The accuracy of the MIR measurements can be improved by including more wort samples in the calibration set, by improving the signal-to noise ratio of the instruments and by temperature stabilization of the sample. Finally, reference methods should be as accurate as possible in order to develop such calibrations. Further work will be carried out in order to test the predictive ability of the models developed as well as to evaluate the reference method used on the accuracy of the MIR calibrations for FAN.
Acknowledgements
The authors thank technical staff of the Barley Quality Laboratory and Barley Breeding Program, University of Adelaide. This project is supported by Australia's grain growers through their investment body the Grain Research and Development Corporation, with matching funds from the Australian government.


