Development of an ubiquitin-proteasome system signature for predicting prognosis and providing therapeutic guidance for patients with triple-negative breast cancer
Xiaoqing Chen, Chongyang Ren and Zhisheng Zhou, equal Contribution.
Abstract
Background
Triple-negative breast cancer (TNBC) is a pathological subtype with a high mortality, and the development of inhibitors in the ubiquitin–proteasome system (UPS) component could be a novel therapeutic tool.
Methods
Triple-negative breast cancer data were obtained from The Cancer Genome Atlas (TCGA), and subtype analysis was performed by consistent clustering analysis to identify molecular subtypes of TNBC according to UPS characteristics. Differential analysis, COX and least absolute shrinkage and selection operator (LASSO) COX regression analyses were performed to select genes associated with overall survival in TNBC. The final prognostic model (UPS score) was determined using the LASSO COX model. The model performance was assessed using receiver operating characteristic (ROC) curves and survival curves. In addition, the results of the UPS score on analyzing the abundance of immune cell infiltration and immunotherapy were explored. Finally, we developed a nomogram for TNBC survival prediction.
Results
Two UPS subtypes (UPSMS1 and UPSMS2) showing significant survival differences were classified. COX regression analysis on differentially expressed genes in UPSMS1 and UPSMS2 filtered five genes that affected overall survival. Based on the regression coefficients and expression data of the five genes, we built a prognostic assessment system (UPS score). The UPS score showed consistent prognostic and therapeutic guidance values. Finally, the ROC curve of the nomogram and UPS score showed the highest predictive efficacy compared with traditional clinical prognostic indicators.
Conclusion
The UPS score represented a promising prognostic tool to predict overall survival and immune status and guide personalized treatment selection in TNBC patients, and this study may provide a more practical alternative for clinical monitoring and management of TNBC.
1 INTRODUCTION
Breast cancer is a frequent cause of female cancer death, with approximately 13% of females worldwide suffering from breast cancer.1 Early diagnosis could allow 70% of early-stage patients to be properly treated.2 One particular pathological stage of breast cancer, triple-negative breast cancer (TNBC), has a poor prognosis owing to its tumor heterogeneity and the inability to access an effective target.1, 2 Accurate prognosis remains an important challenge in TNBC treatment. Currently, surgery is the mainstream treatment for early-stage TNBC patients, and chemotherapy is the primary choice for recurrent and metastatic TNBC patients, but fewer than 30% of patients survive more than 3 years.3, 4 Current understanding of TNBC biology has led to the development of novel targeted drugs, including PARP inhibitors, antibody–drug conjugates and immune checkpoint inhibitors, which are revolutionizing the therapeutic landscape and providing new opportunities for patients with early-stage TNBC and those with advanced disease.4 Immunotherapy has also been shown to be able to improve overall survival and response to TNBC. The US Food and Drug Administration (FDA) and the European Commission have approved atezolizumab and nab-paclitaxel in PD-L1-positive metastatic TNBC, establishing the first immunotherapy approval for breast cancer.5 According to the results of TNBC clinical trials, the benefits of single conventional anticancer therapy or immunotherapy could be hindered by tumor heterogeneity, tumor evolution and drug resistance. The most important aspects are the low response rate to the current immune checkpoint blockade (ICB) scheme and the lack of valid indicators to predict the effectiveness of immunotherapy.6 Establishing a promising prediction model is therefore essential to the improvement of therapeutic effect of TNBC patients.
The ubiquitin–proteasome system (UPS) is an essential cell homeostatic mechanism for regulating protein homeostasis in the cell body, abnormal mutations and aberrant expression of components in the UPS to affect cancer genesis.7 In response to this mechanism, researchers proposed cancer therapies to target specific pivotal genes in the UPS, and this has been confirmed to be feasible in several studies. For example, bortezomib was approved by the FDA in 2005 as a second-line therapy for multiple myeloma8, 9 and carfilzomib was approved by the FDA in 2012 as a novel therapy for multiple myeloma.10 According to available studies, UPS positively influences TNBC occurrences and chemoresistance. Yang et al. found that the deubiquitinating enzyme STAMBP is a definitive factor for TNBC occurrence.11 The histone deacetylase inhibitor TMU-35435 enhances the cytotoxicity of etoposide by inhibiting the DNA repair pathway.12 However, systematic studies of UPS in TNBC are still lacking, and discovery of UPS-related targets in TNBC may be a promising direction to improve survival.
Previous studies focused on the mechanism of UPS in TNBC, and there is an absence of studies focusing on the role of UPS-related genes in the prognosis of TNBC. In this study, we screened breast cancer data from the TCGA database, identified different UPS-specific molecular subtypes in TNBC and constructed a prognostic tool to predict its prognosis by consistent clustering analysis of the expression matrix of TNBC samples.
2 MATERIALS AND METHODS
2.1 Data collection and pre-processing of patients with TNBC
The RNA-Seq data, somatic mutation data in maf format and clinical factors data of BRCA items in TCGA database (https://portal.gdc.cancer.gov/) were retrieved. Based on the breast cancer (BRCA) expression matrix information, only ER-, PR-, and Her-2-TNBC samples were retained. The TNBC samples with missing survival information were removed, and the filtered samples, containing 114 TNBC samples and 113 normal breast samples, were recorded as TCGA-TNBC. The Gene Expression Omnibus (GEO) database (https://www.ncbi.nlm.nih.gov/gds) was searched for “triple-negative breast cancer” and a study cohort of 238 TNBC samples was investigated (registration number GSE103091). The expression matrix of 107 TNBC samples in the GSE103091 cohort was mapped to genes in the Sangerbox platform13 based on the annotation file of the GPL570 platform, and the mean value of multiple probes was considered as the expression data of the genes. In addition, we obtained 797 UPS-related genes (UPSRGs) from the study of Wang et al.14
2.2 Differential analysis and identification of molecular subtypes
In the TCGA-TNBC cohort, TNBA-related genes in TNBC samples _vs_ normal breast samples were identified utilizing the limma R code package15 under |log2FC| > 1.2 and false discovery rate (FDR) < 0.05 as the screening criteria, while normal breast samples were considered as controls. Subsequently, univariate COX regression analysis was performed on UPSRGs in combination with survival factors in TNBC samples using the coxph function of the “survival” package16 to identify prognostic factors in UPSRGs. Venn diagrams17 were developed to identify TNBA-related prognostic UPSRGs, and consistency matrices were developed based on 114 TNBC samples utilizing the ConsensusClusterPlus18 code package to obtain UPS-related molecular subtypes.
2.3 Differential analysis and functional annotation analysis
Differentially expressed genes (DEGs) in UPS molecular subtypes were targeted by FDR < 0.05 and |log2FC| > 1 using the limma code package. Gene Ontology (GO) and Kyoto Encyclopedia of Genes and Genomes (KEGG) searches were conducted on DEGs in the DAVID database (https://david.ncifcrf.gov/). A value of p < 0.05 for GO terms and KEGG pathways was considered as statistically significant.
2.4 Development of a UPS prognosis signature
2.5 Survival analysis and ROC analysis
Survival analysis was used to investigate the prognostic variation of patients with distinct UPS molecular subtypes and UPS score groups. For patients in the UPS score groups, the UPS score of the samples in the TCGA-TNBC cohort was analyzed, the high- and low-UPS score groups were distinguished according to their median values, and survival curves were developed to assess the differences in patient prognosis between the two groups. ROC curves20 were then developed to assess the area under the curve (AUC) values of the UPS score for the prediction of 1, 3 and 5 year survival. In addition, we further confirmed the predictive value of the UPS score in the GSE103091 cohort.
2.6 Immuno-infiltration analysis
Differences in the immune microenvironment in different UPS molecular subtypes and UPS score groups were reflected by the differences between the levels of immune cell infiltration in tumor microenvironment (TME) using MCP-Count,21 ESTIMATE,22 TIMER23 and single-sample gene set enrichment analysis (ssGSEA).24 For the UPS groups, we also calculated the differences between somatic tumor mutation burden (TMB) and angiogenesis score. In addition, the differences in oncogenic pathway activity in the UPS groups were analyzed using the PROGENy algorithm (Pathway RespOnsive GENes).25
2.7 Gene set enrichment analysis
To investigate the pathway differences between molecular subtypes and UPS groups, the HALLMARK gene set was accessed from the Molecular Signatures Database (https://www.gsea-msigdb.org/gsea/msigdb) and gene set enrichment analysis was performed.
2.8 Chemotherapy drug sensitivity analysis
The pRRophetic code package26 was employed to calculate the half-maximal inhibitory concentration (IC50) of patients in TCGA-TNBC for WH-4-023, TGX221, XMD8-85, pyrimethamine, NSC-87877 and QS11 so as to assess the response of the UPS groups to different chemotherapeutic agents.
2.9 Prediction of response to immunotherapy
To analyze the impact of the UPS score on immunotherapy sensitivity, we searched the GEO database using the keyword “anti-PD-L1/anti-CLTA1” and included a melanoma immunotherapy cohort (registry number GSE91061). Patients were categorized into stable disease (SD), complete response (CR), partial response (PR) and progressive disease (PD), and the ratios between SD/PD and CR/PR in the UPS score groups were measured.
2.10 Genomic landscape analysis
For somatic mutation data in maf format of tumor samples in TCGA-TNBC, statistical analysis was performed using the maftools code package27 to count the differences between gene mutation frequencies in UPS score groups. Co-occurring or exclusiveness between gene mutations was computed using the somaticInteractions function, and the statistical significance of the occurrence of co-occurring or exclusiveness was analyzed using Fisher’s test. Finally, the mafComapre function was utilized to compare differentially mutated genes in the UPS score groups and to produce forest plots.
2.11 Nomogram assessment
The information for Age, T. Stage, N. Stage, M. Stage, Stage and UPS score of TNBC samples was integrated and univariate and multivariate COX regression analyses were performed to determine the significant independent prognostic indicators of TNBC and plot a nomogram. For the nomogram prediction accuracy, a calibration curve was used to compare the fitness between predicted survival and actual values. The clinical benefit of the nomogram and UPS score was assessed by the Decision curve.
3 RESULTS
3.1 UPS molecular subtypes
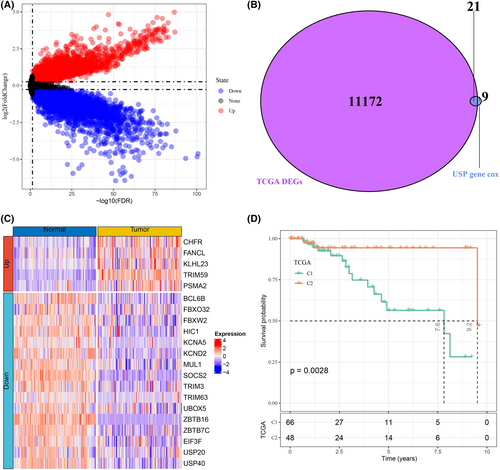
A total of 11,193 DEGs were identified by differential analysis of tumor samples and normal samples in TCGA-TNBC, and their distribution is shown in Figure 1A. Meanwhile, univariate COX regression analysis was performed to obtain 30 prognosis-related UPSRGs. Based on the Venn diagram results, we obtained 21 overlapping UPSRGs (Figure 1B). Heatmaps were drawn to demonstrate the expression levels of 21 UPSRGs in tumor tissues and normal tissues, and it could be observed that five genes were upregulated in tumor tissues and expression of 16 genes was downregulated in tumor tissues (Figure 1C). Subsequently, consistency clustering analysis was performed on 114 TNBC samples according to the expression matrix of 21 genes. It was evidently observed that the sample grouping consistency was optimal when K = 2 (Figure S1). Hence, the TNBC samples could be subdivided into two molecular subtypes of UPS characteristics (UPSMS1 and UPSMS2). We observed remarkable prognostic variation between the two subtypes; specifically, patients in UPSMS2 had better prognosis (Figure 1D).
3.2 TME distinction between the UPS molecular subtypes
Cellular homeostasis is dependent on its in vivo proteostasis mechanism, and furthermore, the UPS mechanism is essential for cellular homeostasis.28, 29 Studies also confirmed that the UPS mechanism is essential in protein homeostasis during immune system activation, avoiding cell death owing to the dysregulation of protein homeostasis of immune cells.30 Therefore, we evaluated the differences in immune cell infiltration in UPSMS1 and UPSMS2. MCP-Count and TIMER results showed higher immune scores in UPSMS1 patients (Figure S2A–B), especially neutrophils and dendritic cells. We also found that espression of most immune checkpoint genes was higher in the UPSMS1 group (Figure S2C). In addition, a higher TIDE score was observed in the UPSMS1 group compared with UPSMS2, suggesting that patients in the UPSMS2 group could potentially benefit from taking immunotherapy (Figure S2D). Finally, the EMT signaling pathway, angiogenesis pathway and TGF-β signaling pathway were found to be remarkably activated in the UPSMS1 subtype (FDR < 0.05), which indirectly explains the poor prognosis of UPSMS1.
3.3 Identification and functional analysis of differentially expressed genes between the UPS molecular subtypes
With UPSMS2 as a control group, differential analysis identified 246 DEGs (239 upregulated DEGs and seven downregulated DEGs) in UPSMS1. Furthermore, functional enrichment analysis was performed on 246 DEGs. The GO enrichment analysis showed that these DEGs were significantly enriched in 17 GO terms (FDR < 0.05); cell adhesion (GO 0007155), collagen fibril organization (GO 0030199) and extracellular matrix organization (GO 0030198) were the most significant enrichment biological processes for these DEGs (Figure S3A). The cellular components significantly enriched for these DEGs included extracellular space (GO 0005615), extracellular region (GO 0005576), extracellular matrix (GO 0031012), basement membrane (GO 0005604), endoplasmic reticulum lumen (GO 0005788), collagen trimer (GO 0005581) and cell surface (GO 0009986) (Figure 3B). The GO molecular functions of DEGs that were significantly enriched were extracellular matrix structural constituent (GO 0005201), integrin binding (GO 0005178), extracellular matrix structural constituent conferring tensile strength (GO 0030020), collagen binding (GO 0005518), heparin binding (GO 0008201), calcium ion binding (GO 0005509) and protease binding (GO 0002020) (Figure 3C). The KEGG results showed that the DEGs were mainly enriched in ECM–receptor interactions (hsa04512), focal adhesion (hsa04510), protein digestion and absorption (hsa04974), the PI3K-Akt signaling pathway (hsa04151), human papillomavirus infection (hsa05165), proteoglycans in cancer (hsa05205), malaria (hsa05144), small cell lung cancer (hsa05222), the TGF-beta signaling pathway (hsa04350) and platelet activation (hsa04611) (Figure S3D). These results showed the distinctions in protein homeostasis, protein binding and cancer-related pathways between UPSMS1 and UPSMS2.
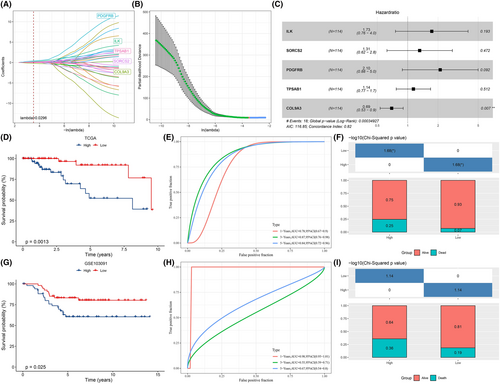
3.4 Construction of a UPS score
After identifying the DEGs between UPSMS1 and UPSMS2, 246 DEGs were finally included for analysis. Univariate COX regression analysis was conducted to screen overall survival-related UPS-related DEGs. Thirty-two DEGs were identified to be able to influence TNBC survival, and then LASSO COX regression analysis was conducted to further screen related DEGs for TNBC prognosis. Finally, five TNBC prognosis-related DEGs (ILK, SORCS2, PDGFRB, TPSAB1 and COL9A3) were obtained (Figure 2A,B). According to the forest plot, ILK, SORCS2, PDGFRB and TPSAB1 were considered as risk factors and COL9A3 as a protective factor (Figure 2C). Thus, we developed the UPS score for predicting the prognosis of TNBC (UPS score = 0.55 × ILK + 0.274 × SORCS2 + 0.743 × PDGFRB+0.131 × TPSAB1–0.365 × COL9A3) and the regression coefficients of each gene in the model were determined by LASSO COX regression analysis. According to the median UPS score, patients in TCGA-TNBC were grouped into high UPS score group (N = 57) and low UPS score groups (N = 57). We observed that patients with a high UPS score showed a pessimistic prognosis and more death cases, and that the AUC values of the UPS score predicting 1, 3 and 5 year survival in TNBC were over 0.7 (0.78, 0.87, 0.84) (Figure 2D–F). This result was also verified in GSE103091; noticeably, the UPS score predicted AUC values were 0.98, 0.55 and 0.67 for 1, 3 and 5 year survival, respectively (Figure 2G–I).
3.5 The UPS score for assessing immune landscape and chemotherapy sensitivity
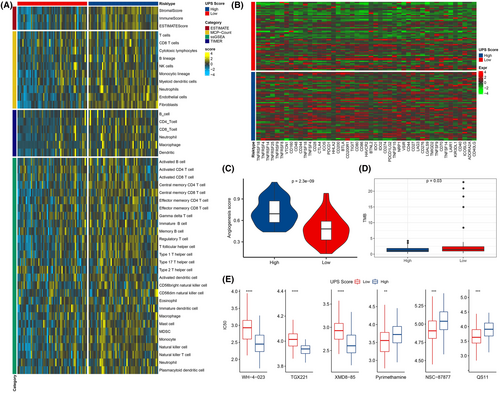
According to the prognostic evaluation value of UPS score, we systematically compared the immune landscape of patients between different UPS score groups using ESTIMATE, TIMER, MCP-Count and ssGSEA methods. Figure 3A demonstrated the immune scores of all the samples in the two UPS score groups. It could be observed that the immune cell infiltration scores in the high UPS score group were higher compared with the low UPS score group. The EPIC package was then adopted to calculate the fraction of immune cells in TNBC and pan-cancer tissues, and the Spearman correlation test was used to analyze their correlation with biomarkers in the prognostic model. ILK, SORCS2, PDGFRB and TPSAB1 all showed significant positive correlation with CD4 T cells in TNBC. SORCS2, PDGFRB and TPSAB1 were significantly positively related to cancer related fibroblasts (CAFs) and endothelial activity, and COL9A3 was significantly negatively correlated with macrophages (Figure S4A). Moreover, ILK in many of the 32 types of cancer tissues showed a significant positive correlation with macrophage and endothelial. PDGFRB in 32 tumor types were all significantly positively related to CAFs. TPSAB1 showed a significant positive relationship to B cells in 29 types of cancer tissue (Figure S4B). Similarly, the expression levels of immune checkpoint genes (PDCD1, CD274 and CLTA4) and angiogenesis score were higher in the high UPS score group, indicating that the immune infiltrating cell function in the TME with high UPS score was potentially suppressed and the tumor cells were prone to metastasis (Figure 3B,C, Figure S5A). We also found a higher TMB in the low UPS score group (Figure 3D). Finally, to investigate potential association between the UPS score and chemotherapeutic drug sensitivity, we compared the IC50 differences of WH-4-023, TGX221, XMD8-85, pyrimethamine, NSC-87,877 and QS11 in the UPS score groups after treatment. The results indicated that the IC50 values of these six drugs in the high and low UPS score groupings were markedly different. Among them, pyrimethamine, NSC-87877 and QS11 showed higher values of IC50 in the high UPS score group, while WH-4-023, TGX221 and XMD8-85 in the low UPS score group had higher values of IC50. These results indicated that patients with a high UPS score were more susceptible to developing resistance to pyrimethamine, NSC-87877 and QS11, while those with a low UPS score were more susceptible to developing resistance to WH-4-023, TGX221 and XMD8-85 (Figure 3E, Figure S5B). Specifically, the UPS score could identify patients with different TME activity and different prognosis, and the association between the UPS score and chemotherapeutic agents further demonstrated its significant prognostic prediction performance.
3.6 The UPS score for predicting immunotherapy
To further assess the ability of the UPS score in indicating a response between immunotherapies, we used a dataset (GSE91061) of melanomas patients treated with ICB (anti-CTLA4, ant-PD1). The prognostic potential of the UPS score in melanoma was validated, and we noted that the UPS score predicted 0.5, 1 and 2 year survival in melanoma patients with AUC values of 0.76, 0.73 and 0.69, respectively (Figure S6A). The survival analysis showed that patients in the high UPS score group developed a worse prognosis compared with the low UPS score group (Figure S6B). This indicated that in other cancers, the UPS score also had a favorable prognostic predictive performance. Next, we analyzed the response of patients to ICB treatment in GSE91061, and it could be found that the proportion of patients with SD/PD was remarkably higher in the high UPS score group (Figure S6C). Compared with CR/PR patients, the UPS score was higher in SD/PD patients (Figure S6D). In summary, the UPS score showed excellent prognostic performance in both TNBC and melanoma, moreover, the UPS score could be used as an assessment tool for assessing the effectiveness of ICB treatment.
3.7 The UPS score caused differences in cancer-associated pathway activity
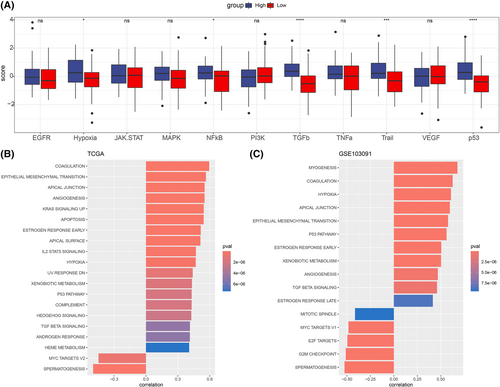
Cancer-related pathways could promote cancer immune escape and tumor invasion.31, 32 We then compared the ssGSEA scores of 10 cancer-related pathways in the UPS score groups and calculated the correlation between them and the UPS score. It was found that there were differences in the ssGSEA scores of hypoxia, NFkB, TGFb, Trail and p53 pathways in the UPS score groups, with the high UPS score group showing higher ssGSEA scores (Figure 4A, Figure S5C). In the TCGA-TNBC and GSE103091 cohorts, the UPS score was markedly positively correlated with most pathways, and conversely, the UPS score was markedly negatively correlated with the MYC TARGETS V2 pathway (Figure 4B,C).
3.8 The molecular landscape affected by the UPS score
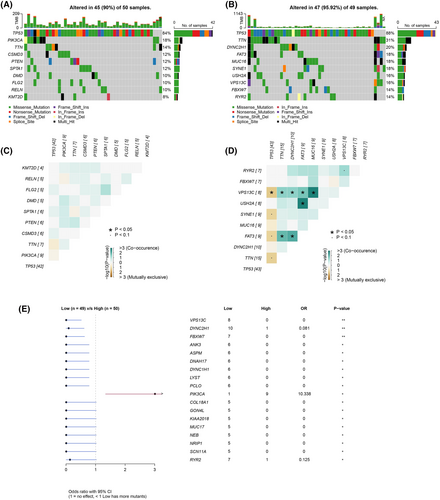
We further explored the mutation status of genes in UPS score groups to further investigate the molecular landscape in the two groups. We found that the top 10 genes (TP53, TTN, DYNC2H1, FAT3, MUC16, SYNE1, USH2A, VPS13C, FBXW7 and RYR2) with high-frequency mutations were consistent in the high and low UPS score groups, and the most frequent mutation types were Missense_Mutation and Nonsense_Mutation. Notably, the mutation frequency of these genes was higher in the low UPS score group compared with the high UPS score group (Figure 5A,B). Next, we analyzed the co-occurrence and exclusiveness between the 10 genes. The results showed that the co-occurrence probability was greater in the low UPS score group. It was observed that VPS13C, USH2A and FAT3 could cause co-occurrence or exclusiveness of multiple genes (Figure 5C,D). Finally, we plotted forest plots of the differences of mutated genes in the two groups (Figure 5E) and found that more samples had mutations in the low UPS score group.
3.9 Clinical significance of the UPS score
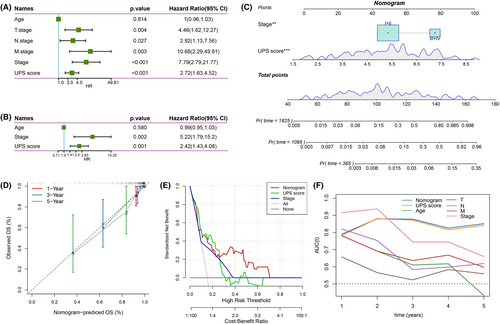
Figure 6A shows that T. Stage, N. Stage, M. Stage, Stage and UPS score markedly influenced the prognosis of TNBC patients. Subsequently, clinical information such as T. Stage, N. Stage, M. Stage and Stage was integrated and further multivariate COX regression analysis was performed with the UPS score. The results demonstrated that Stage and UPS score were independent prognostic factors for TNBC (Figure 6B). Based on UPS score and Stage, we constructed a nomogram (Figure 6C), and the actual survival rate of TNBC patients and the predicted survival rate curves fitted the calibration curve well, indicating that the nomogram possessed a strong predictive performance (Figure 6D). In addition, we plotted the decision curve to assess the predicted benefit of the nomogram and UPS score, and we clearly observed that both showed more obvious greater than the extreme curve (Figure 6E). Finally, after integrating T. Stage, N. Stage, M. Stage, Stage, Age, UPS score and nomogram, the ROC curves were plotted to assess the survival predictive power, and we observed that the UPS score and nomogram prediction AUC for 2–5 year survival were all above 0.8, and the Stage prediction AUC for 1 and 2 year survival was relatively high, but the AUC for long-term survival was relatively low; moreover, the AUCs of Age, T. Stage, N. Stage and M. Stage in predicting the long-term survival of TNBC were also far worse than the UPS score and nomogram (Figure 6F). Overall, the UPS score and nomogram could serve as novel prognostic tools when combined with traditional prognostic indicators for an accurate prognosis of TNBC.
4 DISCUSSION
Triple-negative breast cancer is a pathological subtype with the poorest prognosis in breast cancer. Although evidence revealed tumor heterogeneity and TME heterogeneity in TNBC, chemotherapy continues to be the primary choice for TNBC patients with TNBC, with a median survival time of only 24–36 months3 for those who relapsed or developed metastases.4 With the approval of bortezomib by the FDA for the treatment of multiple myeloma and mantle cell lymphoma, UPS-derived inhibitors represent promising options for cancer treatment.33 The results of this study are presented to identify two molecular subtypes of UPS based on UPS-related genes and TNBC-related genes and to develop a UPS score to predict the TNBC prognosis and provide guidelines for individualized and precise treatment.
Recent studies pointed out that consensus clustering algorithms were feasible to classify molecular subtypes based on the expression profile matrices of large samples of patients.34 In this study, two molecular subtypes of the UPS signature, UPSMS1 and UPSMS2, were identified by consensus clustering. We revealed that UPSMS1 and UPSMS2 exhibited different survival rates, TME differences and cancer activity. The EMT signaling pathway, angiogenesis pathway and TGF-β signaling pathway were remarkably activated in the UPSMS1 subtype. A high cancer pathway activity resulted in poor prognosis of UPSMS1. It was confirmed that the EMT signaling pathway and TGF-β signaling pathway positively affected epirubicin resistance in TNBC.35 We hypothesized that the conversion of UPSMS1 to UPSMS2 might be a pathway to overcoming epirubicin resistance.
Anti-tumor therapies have evolved from the early days of surgery alone, through the use of chemoradiotherapy (or not), to the current stage of tumor immunotherapy.36 Tumor immunotherapy has undoubtedly brought some patients back from the brink of death. However, immune escape remains a major obstacle to immunotherapy. To the best of our knowledge, ICBs developed to target immune checkpoint genes have shown promise in some patients.37 The use of nanomaterials can be combined with anti-tumor drugs to kill tumors, and can also be designed to boost the body’s own immunity to achieve the effect of multiple treatments.38, 39 The results of this study show that the UPS score could predict different degrees of immune microenvironment, suggesting the possibility of precision immunotherapy.
Our study developed a prognosis prediction tool with five UPS-related genes (ILK, SORCS2, PDGFRB, TPSAB1 and COL9A3), and the UPS score was able to predict the prognosis of TNBC. Our results revealed that ILK, SORCS2, PDGFRB and TPSAB1 were the risk factors and COL9A3 was a protective factor. Downregulation of ILK expression inhibited TAM to promote EMT progression in TNBC cells, and ILK was a potential pharmacological target in TNBC.40 Eribulin had the ability to reverse EMT by reducing the amount of ILK released by small extracellular vesicles, thereby promoting anticancer efficacy.41 The functions of SORCS2 in TNBC remain unclear, but in another pathological staging of breast cancer, SORCS2 was found to be associated with high migratory activity in basal-like breast cancer.42 PDGFRB was reported to be highly expressed in tumor cells of invasive TNBC and also in TME, which has been considered as a reliable biomarker of a subgroup of mesenchymal TNBCs with an invasive and stem-like phenotype. Camorani et al. demonstrated that PDGFRB enhanced the tumor suppressive and tumor inactivating power of anti-PD-L1 drugs.43, 44 Wang et al. showed that upregulation of TPSAB1 expression positively regulated the activity of TNBC activated CD4 memory T cells and activated mast cells and neutrophil infiltration in TME, which were therefore seen as the biomarkers for TNBC prognosis.45 A search by Lv et al. also indicated that COL9A3 was a protective factor in TNBC development.46 Based on previous evidence that the five genes in the UPS score were primarily associated with metastasis or drug resistance in TNBC, the UPS score may have the capacity to show the prognostic significance of TNBC survival.
Our study also explored the association between the UPS score and treatment resistance as well as TMB. It was confirmed in the pan-cancer study that a high TMB was associated with better general survival of cancer patients.47 This was further confirmed in the present study, as the samples in the low UPS score group had higher TMB and patients with low UPS score had a better prognosis. According to our results, the UPS score was predictive of ICB treatment response. For the existing clinical trials of TNBC immunotherapy, although the IMpassion 130 trial suggested that atezolizumab in combination with paclitaxel increased progression-free survival (PFS) in patients with TNBC, the probability of adverse events of neutropenia, febrile neutropenia and hypertension was increased by 6.5% and the probability of serious adverse events was increased by 4.5%.48-50 Our findings suggest that the UPS score is a potential tool for immunotherapy response in TNBC. In addition, patients with different UPS scores had different chemotherapy resistances, because we found that patients with a high UPS score were more likely to develop resistance to pyrimethamine, NSC-87877 and QS11, while patients with a low UPS score were more likely to develop resistance to WH-4-023, TGX221 and XMD8-85. We also developed a nomogram and UPS score, both of which showed excellent clinical significance. The UPS score is expected to provide a theoretical basis for TNBC chemotherapy and immunotherapy selection in clinical trials, which could accelerate the development of personalized cancer treatment options.
The current study also had some limitations. Firstly, the statistics were derived from existing cancer databases and the number of samples analyzed was insufficient. Therefore, further clinical validation of the UPS score in multiple centers with more sample data is needed. Secondly, the analysis of the USP involved in this study can be further discussed in future study.
Overall, this study analyzed the existing TNBC tumor database using UPS as the research medium and developed a new UPS scoring tool, providing a basis for further elucidating how UPS-mediated cancer progresses. This study also revealed the significance of the UPS score in the clinical guidance of TNBC treatment, providing fresh insights into individualized treatment, immunotherapy benefit and chemotherapy selection.
5 CONCLUSION
The present study developed a new classification method for UPS-mediated TNBC and classified two subtypes (UPSMS1 and UPSMS2), which can be used to better interpret the effect of UPS on the heterogeneity of TNBC. A novel prognostic tool for TNBC was also developed to facilitate the prognostic stratification, individualized treatment, immunotherapy and chemotherapy of TNBC.
AUTHOR CONTRIBUTIONS
All authors contributed to this present work: Xiaoqing Chen and Chongyang Ren designed the study. Zhisheng Zhou and Jiewen Chen acquired the data. Xulong Fan and Xiangzhi Li drafted the manuscript. Jintao Chen and Jing Zhu revised the manuscript. All authors read and approved the manuscript.
ACKNOWLEDGEMENTS
None.
CONFLICT OF INTEREST STATEMENT
The authors report there are no competing interests to declare.
Open Research
DATA AVAILABILITY STATEMENT
The datasets generated and/or analyzed during the current study are available in the [GSE103091] repository (https://www.ncbi.nlm.nih.gov/geo/query/acc.cgi?acc=GSE103091) and in the [GSE91061] repository (https://www.ncbi.nlm.nih.gov/geo/query/acc.cgi?acc=GSE91061).


