Bridging the health gap: Measuring the unmet social needs of patients within a dental school clinic
Abstract
Objectives
As safety-net clinics, dental school clinics are uniquely positioned to evaluate the unmet social need. There is evidence that patients treated in a safety-net type clinic, such as dental schools, report experiencing one or more of the determinants of health. However, there is limited evidence describing screening for Social Determinants of Health (SDOH) in dental clinics. The purpose of this study is to gain knowledge of the types of social determinants of health that exist in a dental school clinic and how it is reflected in the geographic region of the school.
Methods
This cross-sectional prospective study used a 20-item questionnaire assessed unmet social needs in a predoctoral clinic. The questionnaire contained multiple choice and binary yes/no questions, organized under SDOH domains: housing, food, transportation, utilities, childcare, employment, education, finances, and personal safety. Socioeconomic and demographic information was captured. The questionnaire was administered via iPad using Qualtrics XM. The data were descriptively and quantitatively analyzed at a significance level of p ≤ 0.05.
Results
There were 175 respondents with a 93.6% response rate, males (49.7%), females (49.1%), and 1.1% nonbinary. Overall, 135 (77.1%) respondents reported having at least one unmet social need. The greatest number of unmet needs was in the domains of employment and finances, with 44% and 41.7% respectively. Respondents who were unable to work stated they often or sometimes worried about running out of food before getting money to buy more, (p = 0.0002), and or the food didn't last before there was money to get more (p = 0.00007). A comparison of annual incomes of respondents earning less than $40K with those earning $40K or more, demonstrated statistically significant differences in unmet social needs for housing (p < 0.0001), food (p = 0.0003, p < 0.0001), utilities (p = 0.0484), employment (p = 0.0016), education (p < 0.0001), and finances (p < 0.0001).
Conclusion
Screening patients in the dental clinic was an efficient way to uncover the level of unmet social needs. Annual household income was a predominant driver of unmet social needs: with the greatest number of unmet needs existing in the domains of employment and finances. The results suggest that screening for social determinants of health dental school clinics could be incorporated into routine patient data collection.
1 INTRODUCTION
Both the World Health Organization and Centers for Disease Control define Social Determinants of Health (SDOH) as “the nonmedical factors that influence health outcomes. They are the wider set of forces and systems shaping the conditions of daily life. These forces and systems include economic policies and systems, development agendas, social norms, social policies, racism, climate change, and political systems.”1, 2 When healthcare providers screen and monitor nonmedical factors, such as SDOH, it can result in positive impacts on health outcomes and the overall health of patients.3, 4 This was demonstrated by one study using a screening tool within Academic Health Centers to evaluate 13,273 patients across four sites and three disciplines.3 The study identified 1939 patients with previously undetected needs (27% had food insecurity, 12% had housing insecurity, 12% had utility, and 1% had safety needs). Patients (n = 944) deemed with high-risk unmet needs, and consented, received a closed-loop referral to collaborating community service providers.
The importance of oral health and its contribution to overall health has been a large component of national dialogues on healthcare since the seminal 2000 Surgeon General's Report by David Satcher, and it continues to be a focus of other surgeon general for the past 20 years.5-7 Initiatives like the Healthy People project, sponsored by the U.S. Department of Health and Human Services, seeks to improve the health and wellbeing of the nation by setting 10-year healthcare outcome targets, such as Healthy People 2010, 2020, and 2030.8 These initiatives include oral health targets, and the current Healthy People 2030 goals include addressing social determinants of health. With the existing number of dental schools in the country, there is an opportunity to provide outcomes that contribute to the improvement of the nation's population health by promoting the collection of nonmedical health indicators such as social determinants of health.
Dental safety net clinics are a vital component of the health system reducing dental access to care issues, and have an estimated capacity of approximately eight million people annually.9 The safety net is represented by dental clinics within academic dental institutions, hospitals and federally qualified health centers, and is supported by reimbursement programs such as Medicaid and Children's Health Insurance Program.10 Predoctoral students at United States Dental Schools annually provide approximately 2.3 million dental visits at campus and extramural clinical sites.11 Dental school safety net clinics are uniquely positioned to measure the depth of unmet social needs as a significant amount of care is provided to vulnerable or underserved populations who may be uninsured, under-insured or otherwise reside in health professional shortage areas. Additionally, there is evidence that patients treated in a safety net type clinic, such as dental schools, report experiencing one or more of the determinants of health.12, 13
Compared with other health professional programs dental schools have a unique opportunity as an educational program with clinical enterprise that extends into underserved communities with student rotations to extramural clinical sites.14-17 While SDOH learning is woven throughout dental curricula, there is limited evidence of expansion into patient care environments.18-20 To the best of our knowledge there are no studies within dental school clinics describing the unmet needs, or social determinants of patients treated in their clinics. Therefore, the purpose of this study is to gain a general knowledge of the types of social determinants of health that exist in a dental school clinic.
2 METHODS
This cross-sectional prospective study was deemed exempt by the Institutional Review Board (IRB) at the University of Minnesota (STUDY00016439). The University of Minnesota School of Dentistry Social Determinants of Health (UMNSOD SDOH) survey, a 20-item questionnaire, was developed by modifying the American Academy of Family Physicians Social Needs Screening Tool to incorporate socioeconomic and demographic queries (See Appendix 1). Survey participants were invited to enroll during a new patient appointment in the School of Dentistry Initial Faculty Consultation clinic. No personally identifiable data such as name, patient account number, date of birth, and/or social security number were recorded; however with IRB approval, zip code data were obtained. Consenting participants were enrolled between August 1, 2022 and October 31, 2022, with a study enrollment target of 100 to 150 respondents. Only English-speaking patients who were 18 years and older at the time of survey were eligible to participate.
The UMNSOD SDOH survey was placed into QualtricsXM (Provo, UT), a secure platform to administer it and consent to participants using an iPad (Apple). One investigator (AC) was present during survey administration to introduce patients to the study, invite participation and answer any clarifying questions. The questionnaire contained a combination of multiple choice and binary yes/no questions, organized under SDOH domains: housing, food, transportation, utilities, childcare, employment, education, finances, and personal safety.
2.1 Data collection and analysis
The UMNSOD SDOH survey assesses the social needs of the dental patient, as well as gathering socioeconomic data and social needs within the following 10 blocks: demographics (gender, age range, race/ethnicity, annual household income range, zip code), housing, food, childcare, transportation, utilities, employment, education, finance and personal safety. The raw data were extracted from Qualtrics and placed into a Microsoft Excel spreadsheet for analysis. Each participant response with the SDOH domains resulted in either a positive or negative screen for an unmet social need (SON), that is, presence or absence of unmet SON. The Social Needs Value (SNV) is the number of unique positive screens of unmet SON, such that a higher SNV correlates to a higher level of unmet social need and is an estimate of overall burden of an individual. The SNV can also be measured at the zip code and county level to determine an estimate of burden within a geographic area.
The data were descriptively and quantitatively analyzed. Statistical analysis was performed using SAS software, version 9.4 (SAS Institute, Inc.; Cary, NC). The independent variables were gender, age range, race/ethnicity, annual household income range, and zip code. The dependent variables were each of the SDOH domains. Statistical analysis was performed using the means of the independent variables at a significance level of p ≤ 0.05.
The participant's zip code-based data were used to develop a qualitative analysis of geographic distribution of unmet social needs within the dental school's catchment area. Geospatial vector data (shapefiles) encoding Minnesota boundaries (state and county), the Tribal Government in Minnesota, and ZIP Code Tabulation Areas (5-digit [ZCTA5], Minnesota, 2010) were downloaded from the Minnesota Geospatial Commons, a state government repository of Minnesota's geospatial resources. The Minnesota Geospatial Commons shapefiles and the zip code linked SNV Excel sheet were imported into ArcGIS (Arc Geographic Information System) Online. Each respondent was represented as a point on the state map and associated with the area matching their associated zip code response.
3 RESULTS
There were 175 participants who consented and completed surveys, and there was a 93.6% response rate of all invited to participate. There was relatively equal representation of gender with males (49.7%) and females (49.1%), and 1.1% identifying as non-binary or third gender. There was a relatively equal distribution of participants across all stages of life with a slightly higher percentage (20.6%) within the 60–69 years of age group (See Table 1). Respondents self-identified their ethnicity as Hispanic/Latino (9.1%) and the racial breakdown was American Indian/Alaska Native (2.9%), Asian (3.4%), Black/African American (25.1%), Native Hawaiian/Pacific Islander (0%), Caucasian (58.3%), and two or more races (9.1%). The self-reported annual income of respondents ranged from less than $15,000 to more than $75,000, with 62.2% earning $40,000 or less annually and 23.4% earning $15,000 or less annually. Table 1 displays a comprehensive listing of all socioeconomic and demographic data.
| Participant characteristics | Frequency (n) | Percentage (%) |
|---|---|---|
| Gender | ||
| Male | 87 | 49.7% |
| Female | 86 | 49.1% |
| Nonbinary/third gender | 2 | 1.1% |
| Age (years) | ||
| 18–24 | 25 | 14.3% |
| 25–29 | 17 | 9.7% |
| 30–39 | 30 | 17.1% |
| 40–49 | 24 | 13.7% |
| 50–59 | 23 | 13.1% |
| 60–69 | 36 | 20.6% |
| 70+ | 20 | 11.4% |
| Ethnicity | ||
| Hispanic or Latino | 16 | 9.1% |
| Non-Hispanic or Latino | 157 | 89.7% |
| Race | ||
| American Indian/Alaskan Native | 5 | 2.9% |
| Asian | 6 | 3.4% |
| Black/African American | 44 | 25.1% |
| Native Hawaiian/Pacific Islander | 0 | 0.0% |
| White | 102 | 58.3% |
| Two or more | 16 | 9.1% |
| Annual household income | ||
| <$15,000 | 41 | 23.4% |
| $15,000 to $25,000 | 34 | 19.4% |
| $25,000 to $40,000 | 34 | 19.4% |
| $40,000 to $50,000 | 21 | 12.0% |
| $50,000 to $75,000 | 21 | 12.0% |
| >$75,000 | 24 | 13.7% |
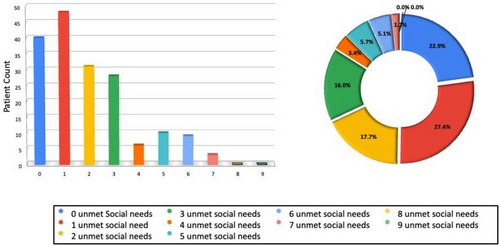
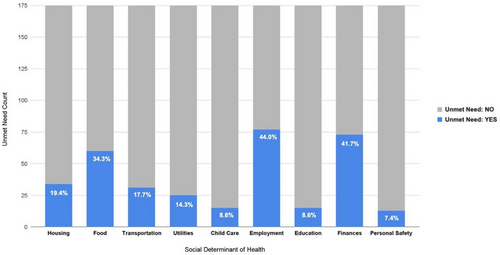
Across the nine SDOH domains, there were a cumulative 332 total reports of unmet need by the 175 respondents. Overall, 135 (77.1%) of the respondents reported having at least one unmet social need. There were 27.4% of respondents reported one unmet need, 17.7% reported two unmet needs, and 16% reported three unmet needs, while respondents with four to seven unmet needs ranged from 1.7% to 5.7% and other groups reported zero unmet needs (See Figure 1). The greatest number of unmet needs was in the domains of employment and finances, with 44% and 41.7% respectively (See Figure 2). The respondents who reported an unmet employment need were subdivided into four categories: those who were unemployed (15.6%), those unable to work (35.1%), those retired (39.0%), and those who were students (10.4%). A comparison of annual household incomes of respondents earning less than $40K with those earning $40K or more, demonstrated statistically significant differences in unmet social needs for housing (p < .0001), food (p = 0.0003, p < .0001), utilities (p = 0.0484), employment (p = 0.0016), education (p < .0001), and finances (p < .0001) (See Figure 3). Additionally, respondents who self-reported as unable to work were more likely to state that they often or sometimes worried that food would run out before getting money to buy more, (p = 0.0002), and that the food bought did not last, and there was not enough money to get more (p = 0.00007).

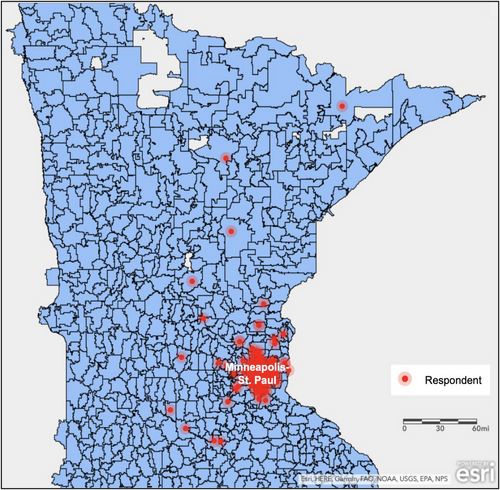
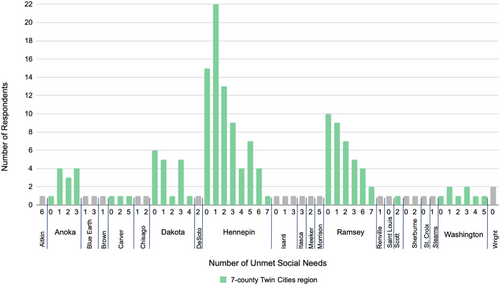
The analysis of each respondent's self-reported zip code of their primary place of residence demonstrated that the majority of dental school patients are located in the Minneapolis-St. Paul metropolitan area (See Figure 4). Respondents represented 20 unique Minnesota counties and 89 unique Minnesota zip codes, with 88% of the respondents resided within the 7-county Minneapolis-St. Paul metropolitan area: Hennepin (43%), Ramsey (21%), Dakota (10%), Anoka (7%), Washington (5%), Carver (2%), and Scott (1%) counties. One percent of the respondents resided outside of Minnesota at the time of screening. The SNV was highest in the counties of Hennepin and Ramsey, and they were the only counties reporting individuals experiencing seven unmet social needs. The SNV was the following: Hennepin (157), Ramsey (76), Dakota (26), Anoka (22), Washington (19), with all other counties having an SNV of 7 or less. (See Figure 5) The counties of Aitkin, Hennepin, and Ramsey reported individuals with six unmet social needs. Morrison and Aitkin were the only counties outside of the 7-county Twin Cities region including respondents experiencing five or more unmet social needs.
4 DISCUSSION
The results of this cross-sectional study demonstrated that within one US dental school, there were patients with undetected, unmet social needs relating to multiple SDOH domains. This finding is consistent with other studies that found undetected, unmet needs when screening was introduced and suggests a value in training students to screen.7, 20, 23 The Surgeon General's report Oral Health in America: Advances and Challenges stated, “Integrating medical screenings into dental visits provides the opportunity to identify high-risk medical patients and link them to care or programs that support and address SdoH.” Screening is a relatively simple process that oral health professionals can introduce that would uncover underlying health problems and nonmedical generating a process to improve population health. We suggest that screening for SDOH be implemented into academic dental programs and ultimately general practice.
The clinical enterprise within dental schools provides technical and procedural training for students through patient care. As oral health professionals advocate for putting the mouth back in the body, we must also train our students to fully understand the clinical and nonclinical aspects of their patient's health. The results of this preliminary study suggest that screening for SDOH in dental school clinics could provide students and faculty providers with nonclinical information that could be addressed via nonclinical interventions. Dental schools can partner with schools of social work on their campus or social services within their area or hire individuals to help patients navigate unmet social needs. By reducing the unmet social needs of patients, it will lead to better compliance from patient and improved health outcomes. Future studies should validate that more schools have similar unmet social needs within their patient population, which would increase the value of screening for SDOH as well as the outcomes from interventions.
Marmot and Bell stated, “If we really want to make a difference to inequalities in dental health, we must address the causes of the social distribution of the causes of dental illness.”21 As oral health professionals advocate for putting the mouth back in the body, we must consider training students to better understand nonclinical aspects of their patient's health. In the current study, patients were screened by a student using an IRB approved script to insure consistency and to a priori account for potential sensitive patient information. There is literature evidence that training students to screen can also have other educational benefits. The results of this preliminary study suggest that screening for SDOH in dental school clinics could provide students and faculty providers with nonclinical information that could be addressed via nonclinical interventions.
Dental schools have historically and traditionally served underserved and disadvantaged patients who often are uninsured or underinsured. Screening for SDOH provides nonmedical information that impacts many patients living under such circumstances, and will impact treatment choices and the ability for people to comply. Our study demonstrated the highest level of unmet social needs was in the domains of employment and finances, suggesting these domains are significant nonclinical factors in these patient's lives, as respondents with income <$40K. Unemployment will impact other social determinants of health by reducing finances available for healthcare, creating uninsured or under-insured statuses, restricting housing options, impacting transportation and food choices, as well as paying utility bills. Choices to extract versus restore could lead to more missing teeth, resulting in poorer health outcomes or a reduced quality of life.22 A poor oral health status was associated with poor mental health, age, socioeconomic status, and not visiting the dentist regularly.23 The screening process was not lengthy and did not interfere with the routine clinical flow. Therefore, screening for social determinants of health can be incorporated into routine patient data collection, made available for interpretation and integrated into overall patient care. Once the unmet needs are known, oral health providers can partner with community and public health organizations to guide patients to resources that can reduce or eliminate their specific unmet needs.
One aspect of this study was the mapping of the respondents’ unmet social needs to the respective geographic residential community. This exercise revealed a topical display of where the greatest need of patients was clustering in communities relative to proximity from our clinic. An evalution of the county level data revealed that the Hennepin County residents marked employment as an unmet need were primarily retirees or unable to work, while Ramsey County residents with the same unmet need were unemployed or unable to work. As the sample size is increased in future studies it will provide information on where the greatest need is and help to identify where community resources already exist. This geospatial mapping information can also help influence policy makers to deploy upstream resources appropriately that help reduce disparities.
There were several limitations, such as screening for unmet needs was performed in one intake clinic for a finite time frame and yielded 175 respondents. However, there were too few individuals in racial/ethnic groups to preform statistical analysis. Since income was recorded in ranges, it limited some potential analysis of the impact of income. Having categorical income data versus continuous data limited our ability to make additional associations of income and unmet social needs, nor did it account for students living at home with parents, who were working part-time but had adequate resources from parents. Future studies will need to ensure that the sample size is appropriate to analyze the geographic impact of SNV based upon the zip code. Although the social need value was greater for these counties, the uneven sample size across all counties limits making definitive cause and effect statements.
5 CONCLUSION
The outcomes revealed unmet social needs within the patients treated in this specific clinic, and screening, is an efficient way to uncover the true level of unmet social needs. The level of unmet need revealed within this clinic population suggests dental schools function as safety net clinics. Annual household income was a predominant driver of unmet social needs, with the greatest number of unmet needs existing in the domains of employment and finances. The results suggest that screening for social determinants of health by dental school clinics could be incorporated into routine patient data collection and could be performed by students for interpretation and integrated into overall patient care.


