A single chemotherapy administration induces muscle atrophy, mitochondrial alterations and apoptosis in breast cancer patients
Abstract
Background
Breast cancer patients are commonly treated with sequential administrations of epirubicin–cyclophosphamide (EC) and paclitaxel (TAX). The chronic effect of this treatment induces skeletal muscle alterations, but the specific effect of each chemotherapy agent is unknown. This study aimed to investigate the effect of EC or TAX administration on skeletal muscle homeostasis in breast cancer patients.
Methods
Twenty early breast cancer patients undergoing EC followed by TAX chemotherapies were included. Two groups of 10 women were established and performed vastus lateralis skeletal muscle biopsies either before the first administration (pre) of EC (50 ± 14 years) or TAX (50 ± 16 years) and 4 days later (post). Mitochondrial respiratory capacity recording, reactive oxygen species production, western blotting and histological analyses were performed.
Results
Decrease in muscle fibres cross-sectional area was only observed post-EC (−25%; P < 0.001), associated with a reduction in mitochondrial respiratory capacity for the complex I (CI)-linked substrate state (−32%; P = 0.001), oxidative phosphorylation (OXPHOS) by CI (−35%; P = 0.002), CI&CII (−26%; P = 0.022) and CII (−24%; P = 0.027). If H2O2 production was unchanged post-EC, an increase was observed post-TAX for OXPHOS by CII (+25%; P = 0.022). We found a decrease in makers of mitochondrial content, as shown post-EC by a decrease in the protein levels of citrate synthase (−53%; P < 0.001) and VDAC (−39%; P < 0.001). Despite no changes in markers of mitochondrial fission, a decrease in the expression of a marker of mitochondrial inner-membrane fusion was found post-EC (OPA1; −60%; P < 0.001). We explored markers of mitophagy and found reductions post-EC in the protein levels of PINK1 (−63%; P < 0.001) and Parkin (−56%; P = 0.005), without changes post-TAX. An increasing trend in Bax protein level was found post-EC (+96%; P = 0.068) and post-TAX (+77%; P = 0.073), while the Bcl-2 level was decreased only post-EC (−52%; P = 0.007). If an increasing trend in TUNEL-positive signal was observed post-EC (+68%; P = 0.082), upregulation was highlighted post-TAX (+86%; P < 0.001), suggesting activation of the apoptosis process.
Conclusions
We demonstrated that a single administration of EC induced, in only 4 days, skeletal muscle atrophy and mitochondrial alterations in breast cancer patients. These alterations were characterized by reductions in mitochondrial function and content as well as impairment of mitochondrial dynamics and an increase in apoptosis. TAX administration did not worsen these alterations as this group had already received EC during the preceding weeks. However, it resulted in an increased apoptosis, likely in response to the increased H2O2 production.
Background
Patients with early breast cancer are commonly treated with chemotherapy, which is composed mainly of sequential administrations of anthracycline–cyclophosphamide (inducing direct damage to DNA) and taxane (preventing the dissociation of microtubules and blocking cell cycle progression and therefore growth of cancer cells). These treatments are effective and increase the 5-year survival rate in breast cancer patients1 but are responsible for an extensive list of adverse events, such as skeletal muscle deconditioning.2-4 Resulting from a global perturbation of muscle homeostasis, skeletal muscle deconditioning is characterized by structural, functional and metabolic alterations2 that lead to a lower exercise capacity and quality of life.5
At the cellular level, preclinical studies have already demonstrated that anthracyclines induce a severe skeletal muscle atrophy. Indeed, reduction in myofibre cross-sectional area (CSA) has been reported as early as 1 day after a single administration.6 In addition, mitochondrial alterations have been documented and known to occur promptly. These alterations were characterized by a decrease in mitochondrial respiration,7-9 an increase in reactive oxygen species (ROS) production,7, 9 and apoptosis activation.9-11 Moreover, cyclophosphamide-treated mice also show impairments in mitochondrial function, as observed from 1 day and after 6 weeks of chemotherapy.12 Finally, a study conducted in 3D-bioengineered human myobundles has shown that anthracyclines lead to a decrease in mitochondrial respiratory capacity, while taxanes do not.13
In clinical studies, we and others have also identified both skeletal muscle atrophy and severe mitochondrial alterations in patients with breast cancer after chemotherapy treatment based on sequential administrations of anthracycline–cyclophosphamide and taxane. Specifically, reductions in myofibre CSA and in mitochondrial size and content have been reported.3, 4, 14 In addition, both mitochondrial dynamics and mitophagy were impaired, leading to the accumulation of fragmented and damaged mitochondria in skeletal muscle,3, 4, 14 which might account for the large increase in H2O2 production observed in breast cancer patients after treatment completion.14 These clinical studies based on vastus lateralis skeletal muscle biopsies obtained after treatment completion have been essential to understanding the chronic adaptations that occur subsequently to chemotherapy treatment. However, to date, no preclinical or clinical study has distinguished the effect of each type of chemotherapy administered to patients (i.e., anthracycline–cyclophosphamide vs. taxanes).
While alterations in both muscle mass and mitochondria function play a key role in skeletal muscle deconditioning with a direct influence on exercise capacity,2 understanding the effect of each type of chemotherapy on skeletal muscle is needed to better counteract the heavy side effects of these drugs. Thus, the PROTECT-06 prospective clinical study aimed to investigate the effect of anthracycline–cyclophosphamide or taxane on skeletal muscle homeostasis in breast cancer patients.
Materials and methods
Participants and study design
Twenty patients with breast cancer from the Institut de Cancérologie Strasbourg Europe (ICANS) were included in the PROTECT-06 prospective clinical study (NCT05128617). The standard (neo)adjuvant treatment prescribed at ICANS includes sequential administrations of epirubicin (anthracycline) combined with cyclophosphamide, followed by paclitaxel (taxane). Included patients then performed two vastus lateralis muscle biopsies (Figure 1): either before the first administration (pre) of epirubicin-cyclophosphamide (EC) or paclitaxel (TAX) and 4 days later (post).

All participants provided written informed consent prior to enrollment, and the study was conducted in accordance with the Declaration of Helsinki and with ethics approval from the national ethics committee (2020-A01266-33). The eligibility criteria included nonpregnant women of at least 18 years of age with a WHO performance status of 0–2 who were diagnosed with breast cancer and treated with (neo)adjuvant chemotherapy. Women were excluded if they had psychiatric, musculoskeletal or neurological disorders.
Patients of the EC group received three doses of steroids (20 mg of prednisone) to prevent nausea and vomiting: 1 h before every EC administration as well as 24 h and 48 h after. Patients of the TAX group had previously received 3 (100 mg/m2) or 4 (75 mg/m2) EC administrations (similar total dose of 300 mg/m2) during the preceding weeks, as the standard treatment prescribed at ICANS is based on EC administration followed by TAX. In addition, due to HER2-positive tumours, two patients in the TAX group also received trastuzumab (Table S1). No patients received nutritional support or anabolic therapy.
Skeletal muscle biopsies
Skeletal muscle biopsies were obtained from the left vastus lateralis muscle using a 5 mm Bergström biopsy needle under sterile conditions and local anaesthesia (1% lidocaine). The two biopsies were obtained from the same leg and at the same time in the morning. Patients were asked not to practice rigorous exercise at least 24 h prior to each visit. They were also asked to eat the same breakfast at least 1 h before the muscle biopsy procedure with a prohibition of proteins, caffeine and theine. Tissue for mitochondrial respiration, H2O2 and superoxide anion production measurements was immediately immersed in Krebs HEPES buffer. Tissue for western blotting analysis was immediately frozen in liquid nitrogen and stored at −80°C. Finally, tissue for histological analyses was embedded in small silicone casts filled with a cryoprotectant agent (OCT compound, Sakura, Finetek), immediately cooled in 2-methylbutane, immersed in liquid nitrogen and stored at −80°C.
Mitochondrial respiratory capacity recording
Within 1 h post-biopsy, muscle was dissected, and muscle fibres were permeabilized by incubation under stirring for 30 min at 4°C in buffer S (CaK2EGTA 2.77 mM, K2EGTA 7.23 mM, Na2ATP 6.04 mM, MgCl2 6.56 mM, taurine 20 mM, sodium phosphocreatine 12.3 mM, imidazole 20 mM, dithiothreitol 0.5 mM, K-methane sulfonate 50 mM, pH 7.0 at 4°C) with saponin (50 μg/mL). Then, muscle fibres were incubated with stirring for 10 min at 4°C in buffer S without saponin. Mitochondrial oxygen respiratory capacity was analysed using a Clark electrode in a thermostatically controlled oxygraphic chamber at 37°C with continuous stirring (Oxygraph-2k, Oroboros instruments, Innsbruck, Austria). Briefly, fibres (2–3 mg wet weight) were placed in 2 mL of buffer in an oxygraphic chamber. Then, basal oxygen consumption of the complex I (CI)-linked substrate state due to proton leakage in the presence of glutamate (10 mM) and malate (2.5 mM) was measured. Oxidative phosphorylation (OXPHOS) by CI was recorded after the addition of saturating amounts of ADP (2 mM) and OXPHOS by CI&CII after the addition of succinate (25 mM). Cytochrome C (10 μM) was added to confirm mitochondrial membrane integrity and all our samples never reached a 10% cutoff, showing that mitochondria have not been damaged during the permeabilization process. OXPHOS by CII was determined after the addition of rotenone (0.5 μM). Antimycin (2.5 μM) and oligomycin (2 μg/mL) were added before TMPD-ascorbate (2 and 0.5 mM) to determine uncoupled CIV. Data analysis was performed in duplicate using Oxygraph-2k-DatLab software version 6.2, and the results are expressed in pmol/s/mg wet weight.
H2O2 measurement
H2O2 production was measured as previously described14 in saponin-skinned muscle fibres with 20 μM Amplex Red and 1 U/mL HRP. Fluorescence was measured in duplicate simultaneously with mitochondrial respiratory capacity recording on high-resolution oxygraphy, and the results are expressed in pmol/s/mg wet weight.
Superoxide anion measurement
Electron paramagnetic resonance (EPR) was performed to determine the production of superoxide anion, as fully described in another study,14 using the specific spin probe 1-hydroxy-3-methoxycarbonyl-2,2,5,5-tetramethylpyrrolidine hydrochloride (CMH, 200 μM). Superoxide anion production analysis was performed in duplicate using Bruker BioSpin WinEPR Spectrometer Software version 4.5, and the results are expressed in μmol/min/mg dry weight.
Cryosectioning and histological analyses
Transverse serial cross sections (7 μm) were obtained using a cryostat maintained at −20°C. Then, an in situ cell death detection kit (Merck, 11684795910) based on the TUNEL method was used to quantify single-cell apoptosis according to the manufacturer's instructions. At least five muscle sections per patient were analysed from different parts of the muscle specimen. For each section, all TUNEL-positive signals were manually quantified and DAPI was used to ensure that the TUNEL-positive signals were co-localized with a nucleus. Results are expressed as an absolute value of TUNEL-positive nuclei per muscle section.
In addition, the total myofibre CSA as well as the type I and type IIa myofibre CSA were assessed. We performed these analyses according to the protocol of Murach et al.15 All slides were digitalized with a Zeiss Apotome.2 microscope with a ×20 objective (Hamamatsu).
Western blotting and antibodies
The western blotting procedures were fully described previously.14 The following primary antibodies were used: anti-4-HNE (Abcam, AB46545, 1:4000), anti-Bax (Santa Cruz, Sc-7480, 1:100), anti-Bcl-2 (Santa Cruz, Sc-7382, 1:200), anti-catalase (GeneTex, GTX110704, 1:1000), anti-citrate synthase (Santa Cruz, Sc-390693, 1:200), anti-p-DRP1 (Ser616, Cell Signaling, #34555, 1:500), anti-DRP1 (Cell Signaling, #5391S, 1:500), anti-Fis1 (Santa Cruz, Sc-376447, 1:200), anti GPx1 (Thermo Fisher Scientific, PA5-26323, 1:1000), anti-MFN2 (Santa Cruz, Sc-100560, 1:200), anti-Mul1 (Abcam, AB209263, 1:1000), anti-OPA1 (Thermo Fisher Scientific, MA5-16149, 1:1000), anti-Parkin (Abcam, AB77924, 1:2000), anti-PINK1 (Thermo Fisher Scientific, PA1-16604, 1:500), anti-PGC-1α1 (Millipore, AB3242, 1:1000), anti-SOD2 (Genetex, GTX116093, 1:1000) and anti-VDAC (Santa Cruz, Sc-390996, 1:200). Then, anti-rabbit (Cell Signaling, #7074S, 1:4000) or anti-mouse (Cell Signaling, #7076S, 1:4000) secondary antibodies were used. The blots were revealed using a Pierce ECL kit (Thermo Fisher Scientific) or SupraSignal Femto kit (Thermo Fisher Scientific), and proteins were visualized by enhanced chemiluminescence (iBright 1500 Imaging System, Invitrogen) and quantified with ImageJ Software (version 1.8.0). Ponceau coloration was used as the loading control.
Questionnaires
Physical activity level was assessed using the 16-item global physical activity questionnaire (GPAQ) version 2. The GPAQ was used to collect information on sedentary behaviour and physical activity during a typical week. A global score was calculated in metabolic equivalents (min/week), in which the higher the score, the better the patient's physical activity level. Appetite level was assessed using the Functional Assessment of Anorexia/Cachexia Treatment (FAACT) questionnaire, in which the higher the score, the better the patient's appetite level.
Statistical analysis
Two-way ANOVA with repeated measures (chemotherapy [EC vs. TAX] × time [pre- vs. post-biopsies or questionnaires scores]) were performed. If significant differences were found, multiple comparison analysis was performed with the Holm–Sidak post hoc test to compare pre-EC versus post-EC and pre-TAX versus post-TAX. The P-values of the post hoc test are mentioned in the results section while all the ANOVA effects are reported in supporting information (Table S2). Statistical significance was set at P < 0.05. Statistical analyses and graphs were made with GraphPad Prism 6 software, and all values are expressed as the mean ± SD.
Results
Patient characteristics
Twenty patients were included and assigned either to the EC (N = 10) or TAX (N = 10) experimental group. Their characteristics are shown in Table S1. All patients underwent the two muscle biopsies without any reported clinical adverse events. Patients of the EC group never received any previous chemotherapy or radiation. However, as abovementioned, patients of the TAX group already received EC administrations in the preceding weeks as their treatment consists in sequential administrations of EC then TAX.
Cross-sectional area of the vastus lateralis muscle fibres
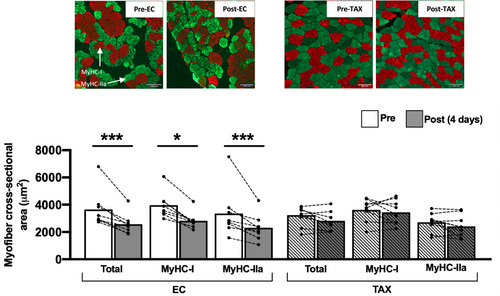
A skeletal muscle atrophy was only found post-EC (Figure 2), as documented by the decrease in the CSA of vastus lateralis muscle fibres post-EC (3777 ± 671 μm2 vs. 2522 ± 652 μm2; −25%; P < 0.001). More precisely, this decrease has been found in both type I (3774 ± 544 μm2 vs. 2767 ± 482 μm2; −27%; P < 0.001) and type IIa (2980 ± 922 μm2 vs. 2277 ± 891 μm2; −24%; P = 0.010) muscle fibres. No changes were found post-TAX for the global, type I and type IIa muscle fibres CSA.
Mitochondrial function, reactive oxygen species and markers of antioxidant defences
Mitochondrial respiratory capacity was severely altered from pre- to post-EC (Figure 3A), as shown for CI-linked substrate state (−32%; P = 0.001), OXPHOS by CI (−35%; P = 0.002), OXPHOS by CI&CII (−26%; P = 0.022) and OXPHOS by CII (−24%; P = 0.027), while uncoupled CIV did not change. No further change was found from pre- to post-TAX for all substrate additions.

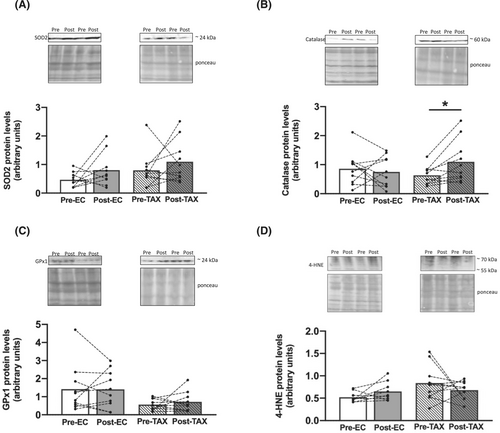
If H2O2 production (Figure 3B) was unchanged from pre- to post-EC after all substrate additions, an increase was found from pre- to post-TAX for OXPHOS by CII (+25%; P = 0.022), with no change for the other substrate additions. The production of superoxide anion (Figure 3C), another ROS, was similar from pre- to post-EC and from pre- to post-TAX. We then decided to explore the antioxidant defences, and we reported that the protein levels of SOD2 (Figure 4A), catalase (Figure 4B) and GPx1 (Figure 4C) did not change from pre- to post-EC. We also did not find any changes from pre- to post-TAX for SOD2 and GPx1, while an increase in catalase protein level was highlighted (+83%; P = 0.045). Finally, we found no changes in 4-HNE protein levels (Figure 4D) from pre- to post-EC and pre- to post-TAX.
Markers of mitochondrial content and biogenesis
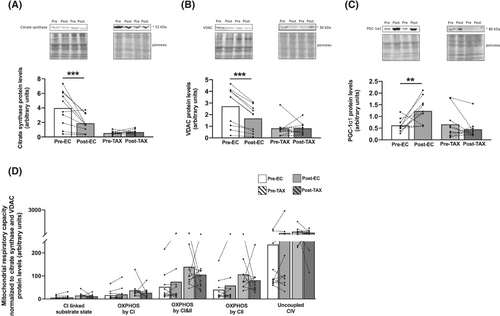
We found a large decrease in mitochondrial content marker protein expression, as shown by decreases in citrate synthase (Figure 5A; −53%; P < 0.001) and VDAC (Figure 5B; −39%; P < 0.001), from pre- to post-EC. Surprisingly, we also found an increase in the PGC-1α1 protein level from pre- to post-EC (Figure 5C; +100%; P = 0.008). For the TAX group, no additional change over time was observed for the protein levels of citrate synthase, VDAC and PGC-1α1. Of note, when normalized to both citrate synthase and VDAC protein levels, mitochondrial respiratory capacity did not change from pre- to post-EC and pre- to post-TAX (Figure 5D).
Markers of mitochondrial dynamics: Fusion, fission and mitophagy
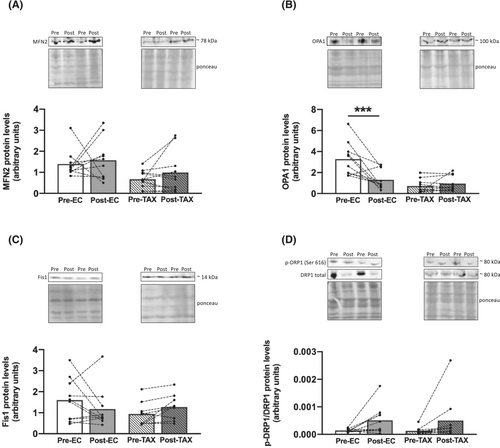
If the protein levels of MFN2, a key marker of mitochondrial outer membrane fusion, were unchanged from pre- to post-EC (Figure 6A), a decrease in the mitochondrial inner-membrane fusion marker OPA1 was found (Figure 6B; −60%; P < 0.001). Markers of mitochondrial fission remained unchanged from pre- to post-EC, as we observed similar protein levels of Fis1 (Figure 6C) and DRP1 (Figure 6D). For the TAX group, the protein levels of both mitochondrial fusion markers (MFN2 and OPA1) and fission markers (Fis1 and DRP1) were not different pre- versus post-TAX.
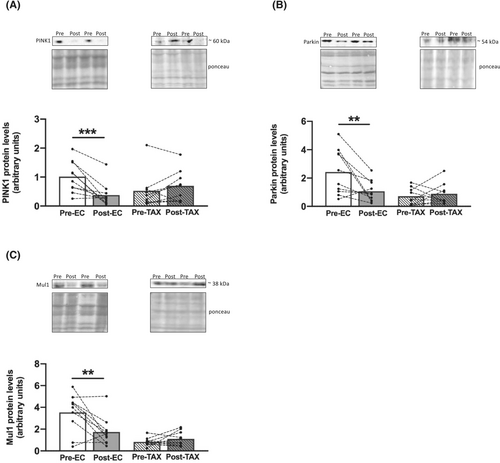
We then explored several markers of mitophagy and found large reductions from pre- to post-EC in the protein levels of PINK1 (Figure 7A; −63%; P < 0.001), Parkin (Figure 7B; −56%; P = 0.005) and Mul1 (Figure 7C; −51%; P = 0.001). For the TAX group, no additional changes over time were observed.
Apoptosis
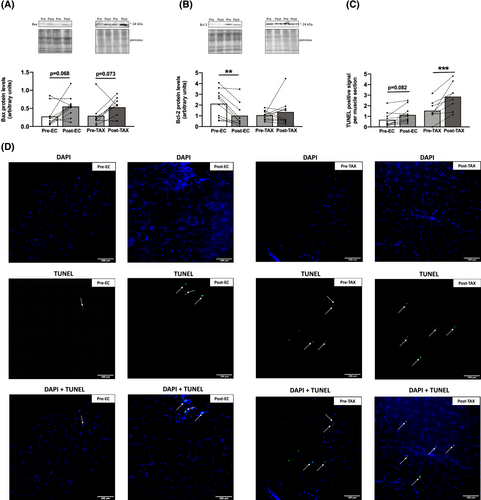
An increasing trend in Bax protein level (Figure 8A) was found from pre- to post-EC (+96%; P = 0.068) and from pre- to post-TAX (+77%; P = 0.073), while the level of Bcl-2 (Figure 8B), its antiapoptotic counterpart, decreased only from pre- to post-EC (−52%; P = 0.007) and not from pre- to post-TAX. An increasing trend in the TUNEL-positive signal (Figure 8C) was observed from pre- to post-EC (+68%; P = 0.082), and a significant increase was documented from pre- to post-TAX (+86%; P < 0.001).
Physical activity and appetite levels
The questionnaires scores and p-values are reported in Table S3. Changes were only found in the EC group, with an increase in sedentary behaviour (+63%; P = 0.017) and a decrease in the appetite levels (−12%; P = 0.019).
Discussion
The main novelty and strength of this study was the performance of skeletal muscle biopsies before and 4 days after the administration of either EC or TAX chemotherapy in breast cancer patients. Studies performing skeletal muscle biopsies in humans, and particularly in patients, are rare and provide mechanistic insights that are frequently demonstrated only in preclinical models. From a clinical context, it appears essential to remain consistent with the standard treatment, which includes sequential administrations of EC followed by TAX. Of note, patients in the TAX group had already received EC during the preceding weeks (Figure 1). Therefore, these patients had already begun to have altered skeletal muscle homeostasis, which might have limited the influence of TAX compared with that of its administration in isolation (i.e., without other previous chemotherapy administrations). However, while the final goal of this clinical study was to enable better counteraction of the side effects associated with the subsequent administration of both drugs, it was more important to characterize the specific effect of TAX after EC, as it is commonly prescribed in clinical settings.
In this clinical study, we found that a single EC administration was sufficient to induce a severe skeletal muscle atrophy for both type I and type IIa vastus lateralis muscle fibres in breast cancer patients. If skeletal muscle atrophy was classically reported at the end of the chemotherapy treatment3, 4, 14 or after a single administration of chemotherapy in preclinical models,6 we demonstrated, in patients, that a single dose of EC drastically reduced muscle fibres CSA. Such a decrease in muscle fibres CSA in humans highlights an extreme skeletal muscle deconditioning condition given that a similar decrease (≈−20%) have been reported after 5 days of dry immersion,16 a ground-based model aiming to mimic the effects of microgravity. In addition, the decrease found in our patients (−25%) is comparable with the considerable effect of 60 years of healthy aging,17 emphasizing the potent effect of EC on skeletal muscle in only 4 days. We also observed that TAX did not worsen the muscle atrophy found with EC. Having in mind that patients of the TAX group had already received several cycles of EC, we cannot exclude that the potential impact of TAX could be greatly reduced. However, our study still emphasizes that the skeletal muscle atrophy documented at the end of the chemotherapy treatment3, 4, 14 seems to be mainly attributed to EC administrations.
If the structure of the skeletal muscle was impaired by EC administration, the mitochondrial function was also drastically reduced. Indeed, mitochondrial respiratory capacity of permeabilized muscle fibres was reduced post-EC, as shown by substantial decreases in CI-linked substrate state, OXPHOS by CI, OXPHOS by CI&CII and OXPHOS by CII. These results are supported by those of studies exploring the effect of anthracycline on mitochondrial function in rodents.7-9 Indeed, following a single doxorubicin injection, all these studies highlighted severe skeletal muscle alterations, including a reduction in mitochondrial respiratory capacity. In our study, we also found that TAX did not worsen these alterations. If we were unable to distinguish the effect of a single TAX administration (without the three preceding cycles of EC), Torres et al.13 showed, in 3D-bioengineered human myobundles, that a single taxane administration did not disturb the mitochondrial respiratory capacity, while a single anthracycline administration had a substantial negative impact. Altogether, these findings suggest that the negative impact of breast cancer chemotherapy treatment on mitochondrial function is highly drug specific, while the isolation of TAX effect in patients is still needed to strengthen this conclusion.
On the other hand, we also highlighted several impairments in mitochondrial homeostasis, such as a severe reduction in markers of mitochondrial content from pre- to post-EC. Specifically, the protein levels of citrate synthase and VDAC, two key markers of mitochondrial quantity, were substantially decreased. This likely reduction in mitochondrial content could explain the decrease in mitochondrial function found post-EC as the mitochondrial respiratory recording was performed on permeabilized muscle fibres and not on isolated mitochondria. When normalized to VDAC and CS protein levels, mitochondrial respiratory capacity did not change after chemotherapy administration, strengthening the fact that the reduced mitochondrial content may represent the main cause explaining the reduction found in mitochondrial function. However, the normalization performed in this study has been done through CS and VDAC protein levels, markers reflecting mitochondrial content, and not quantitative measurements of mitochondria number. While a reduction in mitochondrial content has been previously observed after chemotherapy completion in breast cancer patients,3, 4, 14 our findings suggest that this reduction is likely attributable mainly to EC administration. Indeed, subsequent TAX administration did not further reduce the markers of mitochondrial content. Surprisingly, we found an increase in the protein level of PGC-1α1, a master regulator of mitochondrial biogenesis, from pre- to post-EC. This increase might have been a compensatory mechanism to counteract the loss of mitochondria by simply increasing mitochondrial biogenesis. However, since mitochondrial content is reduced after chemotherapy completion3, 4, 14 along with a decrease in the protein level of PGC-1α1,14 this potential increase in mitochondrial biogenesis seems ineffective in counteracting the mitochondrial toxicity induced by EC administration. On the other hand, it should be noted that PGC-1α1 is also implicated in several other cellular processes, such as thermogenesis, glucose uptake or lipogenesis,18 which could also explain its increase post-EC. Overall, as mitochondrial content and function are directly related to exercise capacity,19 our results may explain the early decrease in exercise capacity observed in breast cancer patients treated with chemotherapy.20
A decrease in mitochondrial content has been previously associated with impairment of mitochondrial dynamics in breast cancer patients14 characterized by an imbalance between fusion and fission processes. In this study, if the markers of mitochondrial fission (Fis1 and DRP1) were not altered post-EC or post-TAX, a decrease in the protein level of OPA1, a key marker of mitochondrial inner-membrane fusion, was observed only from pre- to post-EC. Even though mitochondrial outer-membrane fusion seems to be preserved, as shown by unchanged MFN2 protein levels post-EC and post-TAX, the coordination between outer and inner membrane fusion is crucial for mitochondrial health.21 Taken together, our results highlight a reduction in markers of mitochondrial fusion process post-EC, which may induce mitochondrial fragmentation.22, 23 Fragmented mitochondria are supposed to be removed through mitophagy, a cellular process in which damaged mitochondria are selectively eliminated. However, we found large decreases in the levels of Parkin, PINK1 and Mul1, three key markers of mitophagy, post-EC. Defective mitophagy classically induces progressive accumulation of defective organelles and fragmented/damaged mitochondria in cells.24 Given that subsequent TAX administration did not worsen or alleviate the alterations induced by EC and that we previously documented mitophagy impairments at the end of the entire chemotherapy regimen,14 the mitochondrial network may remain fragmented from EC to the end of TAX administration. This may explain the increase in H2O2 production observed post-TAX. Indeed, an increase in H2O2 production is a major characteristic of damaged and fragmented mitochondria.25 This observation is strengthened by our previous study14 showing a large increase in H2O2 production at the end of chemotherapy without changes in antioxidant defences, which also emphasizes that repetitive administrations of TAX might contribute to the increase in H2O2 production throughout the treatment. It should be noted that we only found a low increase in H2O2 production and, combined with the concomitant increase in catalase protein levels, it probably explains why no oxidative damages were reported as well in this study. Indeed, we documented an absence of changes in protein levels of 4-HNE, a marker of lipid peroxidation and a frequently used marker of oxidative damage. However, we cannot exclude an acute and transient increase in H2O2 following EC administration. For instance, Gilliam et al.7 showed in preclinical models that H2O2 production was increased 2 h after doxorubicin exposure (part of the anthracycline family), and then returned to baseline values 72 h later.
H2O2 is one of the most widely known apoptosis inducers,26 inducing sequential loss of mitochondrial membrane potential, release of cytochrome c, and formation of apoptosomes with caspase activation.26-29 We thus decided to investigate the apoptosis pathway and found that both EC and TAX administration led to its upregulation. We first observed an increasing trend in the protein level of the proapoptotic factor Bax from pre- to post-EC and post-TAX. If Bcl-2, its antiapoptotic counterpart, was decreased only post-EC, the TUNEL assay performed on muscle sections suggested an increase in apoptotic nuclei post-EC (P = 0.082) and post-TAX. As mentioned above, if the increase in apoptosis post-TAX is attributable to the increase in H2O2 production, the increase post-EC may be caused by defective mitophagy, given that mitophagy regulates apoptosis.30 Overall, the increase in activation of the apoptosis pathway observed from pre- to post-EC and again from pre- to post-TAX, as well as the chronic increase in apoptosis initiation observed after chemotherapy treatment,14 probably led to the loss of muscle cells or myonuclei. Considering that many different non-muscle cell populations reside within the skeletal muscle, our experiments cannot easily distinguish myonuclei from other nuclei present in the muscle environment. However, studies have already shown associations between loss of muscle mass/CSA and the number of apoptotic cells.31, 32 Intuitively, the loss of cells/nuclei within the skeletal muscle might appear to be one of the causes of skeletal muscle atrophy but there is still a debate about the current interpretation of the implication of myonuclei apoptosis during muscle atrophy.33
If the aim of this study was to assess the effect of EC or TAX on skeletal muscle, other concomitant factors may be involved in the alterations observed in breast cancer patients. First, we found an increase in sedentary behaviour post-EC, associated with a decrease in appetite level. These parameters are both known to be strongly related to the development of skeletal muscle atrophy and mitochondrial alterations.25, 34 In addition, patients of the EC group received prednisone before and after each EC administration in order to prevent nausea and vomiting. Prednisone could have worsened the skeletal muscle atrophy induced by EC administrations, as shown in renal transplant patients.35 Finally, if variations in feeding condition before the muscle biopsies would obviously influence the results observed in this study, patients were asked to eat exactly the same breakfast before each muscle biopsy, thereby preventing or at least greatly reducing the impact of this variability. Altogether, for all these concomitant factors, and certainly others that we are unaware of, chemotherapy treatments do not represent the only cause for all the negative effects highlighted in this study.
Conclusion and clinical application
This clinical study showed that a single administration of EC induced substantial skeletal muscle atrophy associated with mitochondrial alterations in only 4 days. These alterations were characterized by reductions in mitochondrial function and content as well as impairment of mitochondrial dynamics and an increase in apoptosis. In contrast, subsequent TAX administration did not further alter myofibre CSA or mitochondrial homeostasis and only increased apoptosis, probably in response to the increase in H2O2 production.
The alterations observed in the present study post-EC, may explain, at least in part, the early decrease in muscle force and exercise capacity observed in breast cancer patients.20 Indeed, muscle mass is strongly correlated to the force production36 and mitochondrial content and function are directly related to the exercise capacity.19 We previously reported in a cohort of 100 patients with breast cancer that knee extensors muscle force and exercise capacity were reduced at 8 weeks of treatment (i.e., after two or three EC administrations).20 However, exercise capacity further decreased between 8 weeks and the end of chemotherapy treatment.20 Thus, other mechanisms may be involved in this decrease, such as the well-accepted neurotoxicity induced by TAX administration37 or the cardiotoxicity induced by EC administration.38 We also recently demonstrated that the reduction in exercise capacity was associated with exacerbated central fatigue during exercise in patients compared with their healthy counterparts. This demonstrates that skeletal muscle alterations per se do not fully explain the decrease in exercise capacity documented in patients with breast cancer.39 Of note, due to HER2-positive tumours, two patients in the TAX group also received trastuzumab, a drug known to induce cardiotoxicity,38 and that also might have had a specific impact on skeletal muscle. However, we did not find any apparent changes in these patients compared with the other patients of the TAX group, although a specific investigation involving this targeted therapy is needed to rule out the absence of a specific impact.
Finally, our findings contribute to a better understanding of the heavy and highly specific side effects of chemotherapy medication on skeletal muscle and might contribute to the development of better preventive strategies. Indeed, preventive strategies should be implemented as soon as possible with the purpose of preventing skeletal muscle atrophy and mitochondrial alterations. Of note, the prescription of high-intensity aerobic exercise concomitantly with chemotherapy treatment appears effective and ultimately preserved exercise capacity in patients with breast cancer.4
Acknowledgements
We would like to thank Fabienne Goupilleau and Isabelle Georg for their help with mitochondrial respiration experiments. Many thanks to our patients for their participation. This work was supported by the Institut de Cancérologie Strasbourg Europe (ICANS) and OCOVAS and has been published under the framework of the IdEx Unistra supported by the Investments in the Future programme of the French government. The authors of this manuscript certify that they have complied with ethical guidelines for authorship and publishing in the Journal of Cachexia, Sarcopenia and Muscle.40
Conflict of interest
The authors declare that the research was conducted in the absence of any commercial or financial relationships that could be construed as a potential conflict of interest.


