Associations of low hand grip strength with 1 year mortality of cancer cachexia: a multicentre observational study
Abstract
Backgrounds
Hand grip strength (HGS) is one of diagnose criteria factors of sarcopenia and is associated with the survival of patients with cancer. However, few studies have addressed the association of HGS and 1 year mortality of patients with cancer cachexia.
Methods
This cohort study included 8466 patients with malignant solid tumour from 40 clinical centres throughout China. Cachexia was diagnosed using the 2011 International cancer cachexia consensus. The hazard ratio (HR) of all cancer cachexia mortality was calculated using Cox proportional hazard regression models. Kaplan–Meier curves were generated to evaluate the association between HGS and the 1 year mortality of patients with cancer cachexia. The interaction analysis was used to explore the combined effect of low HGS and other factors on the overall survival of patients with cancer cachexia.
Results
Among all participants, 1434 (16.9%) patients with cancer were diagnosed with cachexia according to the 2011 International cancer cachexia consensus with a mean (SD) age of 57.75 (12.97) years, among which there were 871 (60.7%) male patients. The HGS optimal cut-off points of male and female patients were 19.87 and 14.3 kg, respectively. Patients with cancer cachexia had lower HGS than those patients without cachexia (P < 0.05). In the multivariable Cox analysis, low HGS was an independent risk factor of cachexia [HR: 1.491, 95% confidence interval (CI): 1.257–1.769] after adjusting other factors. In addition, all of cancer cachexia patients with lower HGS had unfavourable 1 year survival (P < 0.001). In a subset analysis, low HGS was an independent prognosis factor of male patients with cancer cachexia (HR: 1.623, 95% CI: 1.308–2.014, P < 0.001), but not in female patients (HR: 1.947, 95% CI: 0.956–3.963, P = 0.0662), and low HGS was associated with poor 1 year survival of digestive system, respiratory system, and other cancer cachexia patients (all P < 0.05). Low HGS has combined effects with high neutrophil-to-lymphocyte ratio or low albumin on unfavourable overall survival of patients with cancer cachexia.
Conclusions
Low HGS was associated with poor 1 year survival of patients with cancer cachexia.
Introduction
Cancer cachexia is defined as a multifactorial syndrome which characterized by an ongoing loss of skeletal muscle mass.1 The prevalence of cachexia in patients with cancer is around 35%, and can reach to 80–90% for pancreatic and gastric cancers. Cancer cachexia is a highly prevalent condition associated with poor quality of life and reduced survival,2 and is a cause of death for 20–25% of patients with cancer.3 Thus, finding a predictive indicator of prognosis is essential for early intervention and management of cancer cachexia.
Based on the 2011 international consensus, weight loss, body mass index (BMI) decline, and sarcopenia were the main diagnosis criteria of cachexia.1 However, a recent study reported that weight loss and BMI decline are both key factors in patients with cancer leading to cachexia but less decisive. This study also illustrated that other factors need to be taken into consideration in order to be able to predict survival, including decreased muscle strength.4 Although muscle strength might only be indirectly related to overall function, this was often a useful prognostic marker.1
Hand grip strength (HGS) is considered a reliable instrument to predict the total skeletal muscle mass,5 being an easy and non-invasive method, and was recommended to be a criterion in the definition of cancer cachexia.4 A previous study showed that HGS could be used as a predictor of malnutrition in individuals with cancer.6 In addition, several studies7-9 also showed that low HGS was inversely related to the survival outcomes of cancer, but was different in male and female patients. Otherwise, a recent study also reported that low HGS was strongly associated with cancer mortalities based on a multicentre observational study.10 However, the impact of HGS on the prognosis of patients with cancer cachexia remains unclear.
Thus, the purpose of this study was to explore the sex-specific cut-off values of HGS for cachexia patients based on a Chinese population and examine the association between low HGS and 1 year and overall mortality of patients with cancer cachexia.
Methods
Patients
Patients were selected from the Investigation on Nutrition Status and its Clinical Outcome of Common Cancers (INSCOC) project of China. They were enrolled at 40 clinical centres throughout China from January 2013 through February 2020. All participants were followed up in-person or telephone questionnaires to collect information on clinical outcomes. The median follow-up date was 4.8 years. Specific inclusion criteria are as follows: (i) ≥18 years or older; (ii) length of hospital stay >48 h; and (iii) with first or previous diagnosis of one of the following 16 types of locally or metastatic malignant solid tumours: lung cancer, gastric cancer, liver cancer, colorectal cancer, breast cancer, oesophageal cancer, cervical cancer, endometrial cancer, nasopharyngeal carcinoma, pancreatic cancer, ovarian cancer, prostate cancer, bladder cancer, brain tumours, biliary tract malignant tumours, or gastrointestinal stromal tumours. The exclusion criteria included the following: (i) organ transplantation; (ii) current pregnancy; (iii) diagnosis of HIV infection or AIDS; (iv) admission to the intensive care unit at the beginning of recruitment; and (v) more than two hospitalizations during the investigation period. Only the data from the first survey were included. Finally, 8466 solid tumour patients were enrolled in this study. All participants signed the informed consent forms prior to study entry. The study protocol conformed to the ethical guidelines of the 1975 Declaration of Helsinki and was approved by the Institutional Review Committee of Beijing Shijitan Hospital.
Data collection
Within the first 48 hours after hospital admission, all patients signed an informed consent form. Then, a dietitian or clinician performed a comprehensive interview of all patients to acquire recent preoperative nutritional information, including the Nutritional Risk Screening 2002 (NRS-2002) score, Patient-Generated Subjective Global Assessment (PG-SGA) score, and Karnofsky Performance Score (KPS); laboratory routine blood test and anthropometric measurements included height, body weight, mid-arm circumference (MAC), calf circumference (CC, left calf circumference), HGS, and triceps skinfold thickness (TSF). Quality of life was assessed using the European Organization for Research and Treatment of Cancer Quality of Life Questionnaire (EORTC QLQ-C30 Version 3.0), and the summary score was calculated as previous study.11 The percentages of weight loss within 6 months were calculated by comparing present weight to the corresponding weight over time. Mid-arm muscle circumference (MAMC) was calculated by using the following formula: MAMC (mm) = MAC (mm) − (3.14 × TSF [mm]).12 BMI was calculated with body weight and height. Handgrip strength was measured using a hand dynamometer (Jamar Hand Dynamometer, IL, USA). The handle was adjusted individually to the size of the patient's hand. The measurement was carried out with the patient seated upright with the arms leaning on the arm-rests with the elbows in 90° flexion. The patient was instructed to grip the handle with maximal strength during 3 s. Tests were performed three consecutive times, and the maximal hand strength was taken.
Definition of cancer cachexia
Based on the 2011 international consensus framework,1 cancer cachexia was diagnosed using the following diagnostic criteria: (i) weight loss >5% over the past 6 months (in the absence of simple starvation); (ii) BMI < 18.5 kg/m2 (based on the criteria of Asia) and any degree of weight loss >2%; or (iii) appendicular skeletal muscle index consistent with sarcopenia (male patients <7.0 kg/m2; female patients <5.4 kg/m2) and any degree of weight loss >2%. Cancer cachexia was diagnosed if the patient was up to one or more abovementioned three criteria.
Statistical analyses
Continuous variables were presented as the mean ± standard deviation (SD) and analysed by Students' t test. Categorical variables were expressed as numbers (percentages) and analysed by Pearson χ2 analysis or Fisher test. The optimal cut-off points of HGS in each sex and neutrophil-to-lymphocyte ratio (NLR) were calculated with ‘maxstat’ package by an application ‘Evaluate Cutpoints’, which was developed by previous researchers.13 HGS values of the undominant hand were binary divided into high and low grip strength with optimal cut-off points. Restricted cubic splines (RCS) were generated to evaluate the nonlinear relationship of HGS and the overall survival rate of cachexia. Forest plots were generated to present the results of interaction analysis of low HGS and other factors on overall survival of patients with cancer cachexia visually. The survival curves were generated by Kaplan–Meier analysis. Univariate and multivariate Cox regression analysis were used to identify the independent significance of different parameters. All tests were two-sided and P < 0.05 was regarded as statistically significant. All statistical analyses were performed using software SPSS version 21 (SPSS, IBM, Armonk, NY, USA) and R (R, Version 4.0.1), involving R packages ‘survminer’, ‘survival’, ‘rms’, ‘ggplot2’, ‘forestplot’, and ‘maxstat’.
Results
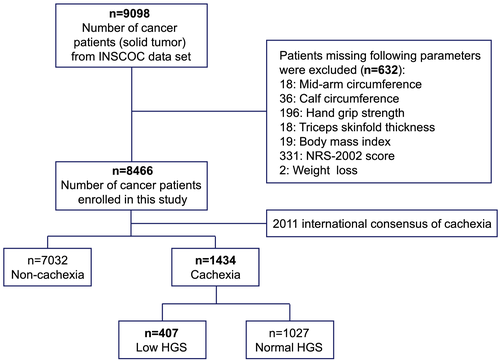
Among the 8466 patients with solid tumour recruited in our study, 1434 (16.9%) patients were diagnosed with cancer cachexia based on 2011 International consensus of cachexia, the specific flow chart was shown in Figure 1. The prevalence of cachexia in different cancers is shown in Figure S1. Pancreatic cancer had the highest prevalence of cachexia (45%), followed by gastric cancer (32.2%) and oesophageal cancer (28.5%). The comparison of the patients' demographic and clinicopathological characteristics between patients with and without cancer cachexia, low and normal HGS groups is presented in Table 1. Cachexia was associated with old age, male, higher NRS-2002 scores, PG-SGA, NLR, and TNM stage, reduced appetite and lower BMI, serum albumin concentration, KPS, MAC, TSF, CC, MAMC, and appendicular skeletal muscle index (ASMI). Low HGS was associated with old age, male, higher NRS-2002 scores, PG-SGA, and NLR, reduced appetite and lower BMI, serum albumin concentration, KPS, MAC, TSF, CC, MAMC, and ASMI. Previous alcohol drinking, smoking, and nutrition support were associated with cachexia and low HGS. HGS showed significant relationships with all items of quality of life (Table S1).
| Variables | All cancer | Non-cachexia | Cachexia | P | High HGS | Low HGS | P |
|---|---|---|---|---|---|---|---|
| N = 8466 | N = 7032 | N = 1434 | N = 1027 | N = 407 | |||
| Age, mean (SD) | 56.74 (12.03) | 56.54 (11.82) | 57.75 (12.97) | 0.001 | 56.34 (12.35) | 61.31 (13.80) | <0.001 |
| <65 years | 6213 (73.4) | 5215 (74.2) | 998 (69.6) | <0.001 | 769 (74.9) | 229 (56.3) | <0.001 |
| ≥65 years | 2253 (26.6) | 1817 (25.8) | 436 (30.4) | 258 (25.1) | 178 (43.7) | ||
| Sex, n (%) | |||||||
| Male | 4332 (51.2) | 3461 (49.2) | 871 (60.7) | <0.001 | 661 (64.4) | 210 (51.6) | <0.001 |
| Female | 4134 (48.8) | 3571 (50.8) | 563 (39.3) | 366 (35.6) | 197 (48.4) | ||
| BMI, mean (SD) | 22.89 (3.46) | 23.57 (3.06) | 19.55 (3.39) | <0.001 | 19.99 (3.43) | 18.43 (3.01) | <0.001 |
| <18.5 | 767 (9.1) | 0 (0.0) | 767 (53.5) | <0.001 | 497 (48.4) | 270 (66.3) | <0.001 |
| 18.5–23.9 | 4636 (54.8) | 4141 (58.9) | 495 (34.5) | 381 (37.1) | 114 (28.0) | ||
| 24–27.9 | 2461 (29.1) | 2312 (32.9) | 149 (10.4) | 127 (12.4) | 22 (5.4) | ||
| ≥28 | 602 (7.1) | 579 (8.2) | 23 (1.6) | 22 (2.1) | 1 (0.2) | ||
| TNM, n (%) | |||||||
| I | 1260 (14.9) | 1136 (16.2) | 124(8.6) | <0.001 | 98 (9.5) | 26 (6.4) | 0.13 |
| II | 2050 (24.2) | 1777 (25.3) | 273(19.0) | 198 (19.3) | 75 (18.4) | ||
| III | 2937 (34.7) | 2388 (34.0) | 549(38.3) | 396 (38.6) | 153 (37.6) | ||
| IV | 2219 (26.2) | 1731 (24.6) | 488(34.0) | 335 (32.6) | 153 (37.6) | ||
| Smoke, n (%) | |||||||
| No | 5114 (60.4) | 4361 (62.0) | 753 (52.5) | <0.001 | 504 (49.1) | 249 (61.2) | <0.001 |
| Yes | 3352 (39.6) | 2671 (38.0) | 681 (47.5) | 523 (50.9) | 158 (38.8) | ||
| Primary tumour, n (%) | |||||||
| Oesophagus cancer | 453 (5.4) | 324 (4.6) | 129 (9.0) | 93 (9.1) | 36 (8.8) | ||
| Lung cancer | 1864 (22.0) | 1585 (22.5) | 279 (19.5) | 203 (19.8) | 76 (18.7) | ||
| Pancreatic cancer | 100 (1.2) | 55 (0.8) | 45 (3.1) | 30 (2.9) | 15 (3.7) | ||
| Gastric cancer | 968 (11.4) | 656 (9.3) | 312 (21.8) | 212 (20.6) | 100 (24.6) | ||
| Colorectal cancer | 1514 (17.9) | 1186 (16.9) | 328 (22.9) | 231 (22.5) | 97 (23.8) | ||
| Nasopharynx cancer | 950 (11.2) | 852 (12.1) | 98 (6.8) | 79 (7.7) | 19 (4.7) | ||
| Breast cancer | 1485 (17.5) | 1423 (20.2) | 62 (4.3) | 48 (4.7) | 14 (3.4) | ||
| Cervical cancer | 349 (4.1) | 314 (4.5) | 35 (2.4) | 23 (2.2) | 12 (2.9) | ||
| Ovarian cancer | 205 (2.4) | 157 (2.2) | 48 (3.3) | 29 (2.8) | 19 (4.7) | ||
| Liver cancer | 191 (2.3) | 157 (2.2) | 34 (2.4) | 27 (2.6) | 7 (1.7) | ||
| Other cancer | 387 (4.6) | 323 (4.6) | 64 (4.5) | 52 (5.1) | 12 (2.9) | ||
| Alcohol, n (%) | |||||||
| No | 6898 (81.5) | 5810 (82.6) | 1088 (75.9) | <0.001 | 745 (72.5) | 343 (84.3) | <0.001 |
| Yes | 1568 (18.5) | 1222 (17.4) | 346 (24.1) | 282 (27.5) | 64 (15.7) | ||
| Nutrition support, n (%) | |||||||
| No | 7105 (83.9) | 6051(86.0) | 1054 (73.5) | <0.001 | 791 (77.0) | 263 (64.6) | <0.001 |
| Yes | 1361 (16.1) | 981(14.0) | 380 (26.5) | 236 (23.0) | 144 (35.4) | ||
| Anorexia, n (%) | |||||||
| No | 7378 (87.1) | 6300 (89.6) | 1078 (75.2) | <0.001 | 821 (79.9) | 257 (63.1) | <0.001 |
| Yes | 1088 (12.9) | 732 (10.4) | 356 (24.8) | 206 (20.1) | 150 (36.9) | ||
| NRS-2002, n (%) | |||||||
| <3 | 6258 (73.9) | 6096 (86.7) | 162 (11.3) | <0.001 | 132 (12.9) | 30 (7.4) | 0.004 |
| ≥3 | 2208 (26.1) | 936 (13.3) | 1272 (88.7) | 895(87.1) | 377 (92.6) | ||
| PG-SGA, n (%) | |||||||
| 0–3 | 4302 (50.8) | 4103 (58.3) | 199 (13.9) | <0.001 | 168 (16.4) | 31 (7.6) | <0.001 |
| 4–8 | 2593 (30.6) | 2093 (29.8) | 500 (34.9) | 396 (38.6) | 104 (25.6) | ||
| ≥9 | 1571 (18.6) | 836 (11.9) | 735 (51.3) | 463 (45.1) | 272 (66.8) | ||
| KPS, mean (SD) | 87.14 (12.68) | 88.14 (11.65) | 82.26 (15.98) | <0.001 | 85.38 (12.52) | 74.37 (20.45) | <0.001 |
| Albumin (g/L), mean (SD) | 39.54 (10.49) | 39.89 (8.52) | 35.17 (7.89) | <0.001 | 38.85 (19.42) | 35.17 (7.89) | |
| ≥35 | 6879 (81.3) | 5922 (84.2) | 957 (66.7) | <0.001 | 742 (72.2) | 215 (52.8) | <0.001 |
| <35 | 1587 (18.7) | 1110 (15.8) | 477 (33.3) | 285 (27.8) | 192 (47.2) | ||
| NLR (mean (SD)) | 3.54 (4.05) | 3.37 (3.85) | 4.39 (4.82) | <0.001 | 3.86 (3.58) | 4.71 (3.82) | <0.001 |
| MAC (cm), Mean (SD) | 26.59 (3.54) | 27.08 (3.31) | 24.18 (3.67) | <0.001 | 24.75 (3.54) | 22.74 (3.62) | <0.001 |
| TSF (mm), Mean (SD) | 16.90 (8.01) | 17.78 (7.88) | 12.61 (7.19) | <0.001 | 13.26 (7.40) | 10.97 (6.37) | <0.001 |
| HGS, kg, Mean (SD) | 24.89 (10.47) | 25.24 (10.37) | 23.14 (10.80) | <0.001 | 27.52 (9.34) | 12.09 (4.49) | <0.001 |
| MAMC (cm), Mean (SD) | 20.84 (3.42) | 21.03 (3.42) | 19.90 (3.26) | <0.001 | 20.25 (3.22) | 19.02 (3.19) | <0.001 |
| CC (cm), Mean (SD) | 33.23 (3.90) | 33.72(3.68) | 30.84 (4.05) | <0.001 | 31.45 (3.94) | 29.29 (3.93) | <0.001 |
| ASMI (kg/m2), Mean (SD) | 6.81 (1.02) | 6.91(0.98) | 6.31 (1.09) | <0.001 | 6.48 (1.06) | 5.88 (1.03) | <0.001 |
- ASMI, appendicular skeletal muscle index; BMI, body mass index; CC, calf circumference (left calf); HGS, hand grip strength; KPS, Karnofsky Performance Status; MAC, mid-arm circumference; MAMC, mid-arm muscle circumference; NLR, neutrophil-to-lymphocyte ratio; NRS-2002, the Nutritional Risk Screening 2002; PG-SGA, Patient-Generated Subjective Global Assessment; SD, standard deviation; TSF, triceps skinfold thickness.
- All of other cancers were solid neoplasms, including bladder cancer, prostate cancer, endometrial cancer, malignant brain tumour, gastric stromal tumour, and biliary tract cancer.
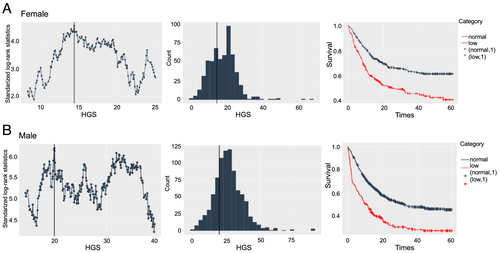
Among patients with different cancer types, Figure 2 showed that the HGS were lower in patients with cancer cachexia than those patients without cancer cachexia (P < 0.05). Among patients with cancer cachexia, the sex-specific optimal cut-off points for HGS associated with overall survival were <14.3 kg for female patients and <19.87 kg for males patients (Figure 3). In accordance with above cut-off points, 407 cachexia patients (51.6% male and 48.4% female) were diagnosed with low HGS. In Figure S2, we used restricted cubic splines to visualize the nonlinear relation between HGS and the risk of all-cause death in all patients with cancer cachexia and in men and female. Low HGS was more strongly associated with overall mortality in men cachexia patients than in women cachexia patients.

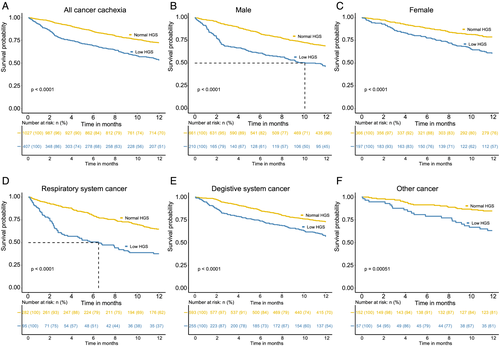
As shown in Table 2, the univariate Cox proportional hazards regression analyses showed that the aged, male, TNM Stages III and IV, low BMI, high NLR, low albumin, anorexia, nutrition support, alcohol, smoking and low HGS were associated with reduced overall survival of patients with cancer cachexia. In the multivariate analysis, low HGS, TNM Stages III and IV, low BMI, low albumin, and anorexia remained as independent factors of cancer mortality. The Kaplan–Meier curves showed the further analysis of the relationship between low HGS and the 1 year mortality of patients with cancer cachexia stratified by sex and cancer types (Figure 4). When only considering low HGS, cancer cachexia patients with low HGS had unfavourable 1 year survival than those cachexia patients with normal HGS for both women and men (P < 0.001) (Figure 4B and 4C). When the cachexia patients were categorized into different systems, the low HGS was still associated with poor 1 year survival of digestive system and respiratory system and other cancer (P < 0.05) (Figure 4D–4F). As shown in Figure S3, the cancer cachexia patients with low HGS had poor overall survival both in male and female patients.
| Variables | Univariate analysis | P | Multivariate analysis | P |
|---|---|---|---|---|
| HR (95% CI) | HR (95% CI) | |||
| Age ≥65 vs. <65 | 1.550 (1.320–1.800) | <0.001 | 1.174 (0.995–1.386) | 0.0574 |
| Sex male vs. female | 0.681 (0.581–0.798) | <0.001 | 0.821 (0.668–1.010) | 0.0617 |
| TNM | ||||
| I | (Reference) | (Reference) | ||
| II | 1.420 (0.898–2.260) | 0.133 | 1.244 (0.783–1.978) | 0.008 |
| III | 2.593 (1.704–3.947) | <0.001 | 2.278 (1.494–3.472) | <0.001 |
| IV | 6.564 (4.337–9.934) | <0.001 | 5.684 (3.746–8.623) | <0.001 |
| BMI < 18.5 vs. ≥18.5 | 1.190 (1.020–1.380) | 0.0262 | 1.170 (1.001–1.367) | 0.0489 |
| NLR | 1.010 (1.000–1.010) | 0.0098 | 1.005 (0.998–1.013) | 0.1287 |
| Albumin (g/L), <35 vs. ≥35 | 2.240 (1.920–2.600) | <0.001 | 1.783 (1.523–2.088) | <0.001 |
| HGS low vs. high | 1.760 (1.510–2.060) | <0.001 | 1.491 (1.257–1.769) | <0.001 |
| Anorexia yes vs. no | 1.880 (1.600–2.200) | <0.001 | 1.435 (1.217–1.692) | <0.001 |
| Nutrition support yes vs. no | 1.200 (1.020–1.420) | 0.0293 | 1.158 (0.977–1.371) | 0.0902 |
| Alcohol yes vs. no | 1.270 (1.070–1.500) | 0.0056 | 1.162 (0.958–1.411) | 0.1278 |
| Smoke yes vs. no | 1.300 (1.120–1.510) | <0.001 | 1.135 (0.930–1.385) | 0.2122 |
- BMI, body mass index; HGS, hand grip strength; HR, hazard ratio; NLR, neutrophil-to-lymphocyte ratio; 95% CI, 95% confidence interval.
- Nutrition support include enteral nutrition and parenteral nutrition.
To elaborate the effect of low HGS in male and female cachexia patients, we did a sex subset analysis (Table S2). The results showed that low HGS was an independent prognosis factor of male patients with cancer cachexia [hazard ratio (HR): 1.623, 95% confidence interval (CI): 1.308–2.014, P < 0.001]. In the specific cancer types, low HGS remained as independent factors of male digestive system cancer (HR: 1.427, 95% CI: 1.083–1.879, P = 0.0115) and respiratory system cancer (HR: 2.093, 95% CI: 1.427–3.070, P < 0.001) patients with cachexia. What's more, in the female's cancer subset, low HGS still has no significant effect in the prognosis of patients with cancer cachexia (HR: 1.947, 95% CI: 0.956–3.963, P = 0.0662). In a word, low HGS was an independent prognosis factor of male patients with cancer cachexia, but low HGS has no such results in female patients. We performed linear regression analysis of HGS on nutritional indices further (Figure S4). The slopes for men were generally stronger than those for women, although the strength of the correlation seems not enough.
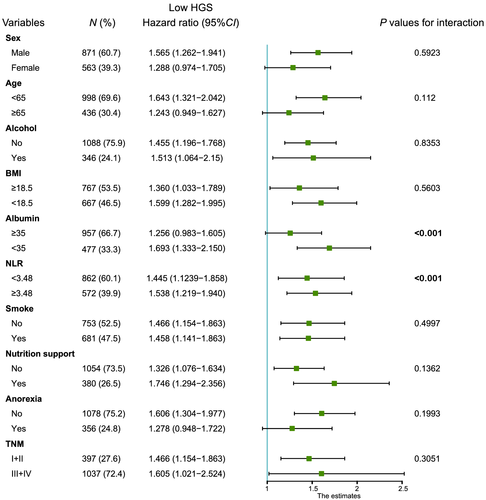
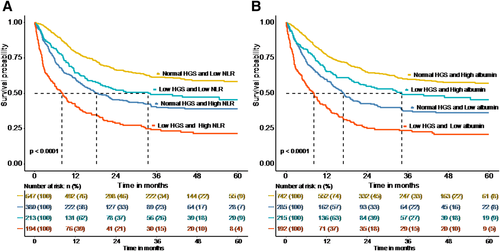
In order to explore the interaction of low HGS and other factors in the overall survival of patients with cancer cachexia, we did a further interaction analysis. The result of interaction analysis revealed that the low HGS had interaction with low albumin and high NLR (all P values for interaction <0.001) (Figure 5). The combined effect of low HGS and albumin or high NLR were shown in Figure 6; low HGS and high NLR group had the most unfavourable survival than other three groups (P < 0.0001). Similarly, low HGS and albumin group had the poorest survival than other three groups (P < 0.0001). These results showed that low HGS combining with low albumin or high NLR could be useful indicator of overall survival in patients with cancer cachexia.
We conducted a sensitivity analyses in cachexia patients with low handgrip strength stratified by age. Results showed that the low HGS was an independent prognosis factor in cancer cachexia patients less than 60 years old (HR: 1.350, 95% CI: 1.024–1.781, P = 0.033) and between 60 and 75 years old (HR: 1.439, 95% CI: 1.117–1.854, P = 0.005) (Table S3). Among the patients with low and normal weight (BMI < 18.5 and BMI 18.5–24), low HGS was an independent risk factor of death in male cancer cachexia patients. Otherwise, female cachexia patients who were overweight and obese (BMI ≥ 24) with low HGS had an elevated risk of death (HR: 4.172, 95% CI: 1.140–15.274, P = 0.0310). Considering the effects of sex-specific cancers and the reasons of death on the analysis, we did a sensitivity analysis by removing patients who had sex-specific cancers, such as breast cancer, ovarian cancer, cervical cancer, endometrial cancer, and prostate cancer; or removing the patients who were died because of other reasons. Again, results were similar to when those patients were included (HR, 1.37; 95% CI: 1.14–1.65 for low HGS [yes/no]) (Table S4).
Discussion
To our knowledge, this is the first study to establish sex-specific cut-off points of HGS for patients with cancer cachexia and explore the association of low HGS and the 1 year mortality of cancer cachexia patients. We found that low HGS was associated with the poor survival of patients with cancer cachexia and also revealed that the combined effect of low HGS and high NLR or low albumin on the unfavourable overall survival of cancer cachexia patients. It indicates the importance of HGS detection and pays close attention to the interaction of low HGS and other factors in patients with cancer cachexia.
Hand grip strength, a commonly made parameter of anthropometry, can be used to assess the muscle strength14, 15 and has been suggested to be a marker for nutritional status.16 Several previous studies revealed that HGS was a strong predictor of morbidity and mortality in cardiovascular disease, respiratory disease, peritoneal dialysis, and patients with cancer.7, 10, 14, 17-19 But the sex-specific cut-off points of HGS in cancer cachexia patients and the association of low HGS with cancer cachexia mortality was unclear yet. Consist with previous study,20 the HGS of cancer cachexia was lower than that in patients without cancer cachexia in our study. In the present study, we obtained sex-specific HGS cut-off points patients with cancer cachexia for Chinese as <14.3 kg for female patients and <19.87 kg for male patients based on our large-scale population. They were lower than cut-off points for defining sarcopenia in European Working Group on Sarcopenia in Older People e (EWGSOP) guidelines,21, 22 and also lower than the cut-off points for patients with cancer in a recent study10 and other studies.23, 24 As expected, the cut-off points of our study were lower than that in previous study, it is reasonable because our study population were cancer cachexia patients. Taking into account the regional differences of parameters, the BMI < 20 kg/m2 and ASMI (male <7.26 kg/m2; female <5.45 kg/m2) of 2011 international consensus were substituted by BMI < 18.5 kg/m225and ASMI (male <7.0 kg/m2; female <5.4 kg/m2)26 (based on Asia criteria) in our study, respectively. Thus, the number of cachexia patients based on the diagnosis criteria in our study was less than that based on the original international consensus.
A sex-specific difference in the association between low HGS with the mortality of cachexia patients is apparent. Low HGS mainly has apparent association with the mortality of cancer cachexia patients in male, but not in female. Low HGS have a different impact on cancer mortality in men9 even though in different cancer types.10 One study reported that gynaecological cancer had no association with HGS.27 Like previous study, we could also not find the reason why the low HGS has sex-specific different effect on the mortality of cancer cachexia patients. Maybe as the explanation in previous,10 HGS has multiple influent factors, such as health status, stress, smoking, lifestyles, and hormone. In addition, the HGS of female is weaker than male originally, and has a smaller range of variation. Thus, low HGS has stronger association with mortality of patients with cancer cachexia in men, but was not a good prognosis indicator of cancer cachexia in female.
Given the limited number of cases in patients with cachexia, we divided the cachexia patients into different group based on different systems instead of cancer types. In our study, low HGS in respiratory system patients with cancer cachexia had more association with the decrease in mortality than that digestive system patients with cancer cachexia. A study reported that the median survival of low HGS in lung cancer was shorter than colorectal cancer and gastric cancer.10 So, the low HGS likely has more effect on the mortality of respiratory system patients with cancer cachexia.
Low BMI was one diagnosis criteria of cachexia based on 2011 international consensus. Recently, the condition of sarcopenic obesity gains attention as an independent predictor of poor prognosis in cancer.28, 29 A study reported that low muscularity is an independent prognostic indicator in obese patients with advanced pancreatic cancer.30 Sarcopenia was also one of diagnosis criteria of cachexia; thus, not all cachexia patients have low BMI on account of presence of sarcopenic obesity (obesity in the presence of low muscle loss). There are 172 (12%) cachexia patients were overweight or obese (BMI ≥ 24 kg/m2) in our study. In the sensitivity analysis of BMI, low HGS was an independent prognostic indicator of obese cachexia in female patients. Cespedes Feliciano et al. revealed that metabolic syndrome and obesity may decrease survival among patients with colorectal cancer, whereas obesity or metabolic syndrome alone do not.31 Thus, these obese female patients with cachexia in our study may have metabolic syndrome, but this hypothesis still needs to be further verified in a larger population.
Interestingly, we found no strong association between low HGS and overall mortality in cancer cachexia patients with aged >75 years old in line with a previous study about patients with cancer.10 A study revealed that there was no association between the HGS and overall survival in older women patients with cancer.32 A meta-analysis suggested that the association of low grip strength and mortality seemed to be weaker in people aged ≤60 years comparing with older participants, but lacking detail analysis with age on account of the low number of studies.33 Celis-Morales et al. showed that grip strength was moderately stronger associated with health outcomes in the younger age groups.7 Loss of skeletal muscle mass was age related even without any underlying disease,4 and mean HGS also declined with advancing age.34, 35 Thus, the cachexia-related HGS decline in older patients maybe was masked by the age-related decline in HGS.
Surprisingly, the combined effects of low HGS and high NLR or low albumin on the high mortality of patients with cancer cachexia were come under observation in our study. Serum albumin levels is commonly used as part of nutritional assessments and has been shown to predict survival in a cancer population with or without cachexia.36-38 The NLR is significantly elevated in multiple cancer types with cachexia compared with non-cachectic patients with advanced cancer,39 and the NLR alone can predict poor outcomes in patients with cancer, including inferior overall survival.40 However, there is no such study to evaluate the combined effects of low HGS and high NLR or low albumin on the mortality in patients with cancer cachexia yet. The cachexia patients with low HGS combined with high NLR or albumin had shorter survival comparing with those cachexia patients with low HGS or high NLR or low albumin alone.
Almost all cachexia patients suffer from different levels of malnutrition, but parenteral nutrition did not improve overall survival in patients with cancer cachexia. Consisting with previous study, the enteral and parenteral nutrition support in our study had no protect function on the overall survival of cachexia patients. However, proper physical exercise can preserve muscle mass and function, which can prevent the symptoms of cancer cachexia.41 Therefore, low-intensity exercise may be an effective therapeutic intervention to prevent muscle atrophy caused by cancer cachexia.
Several limitations must be noted. First, as in all observational studies, HGS of partial population which were unable measure may result in measurement bias. Second, our study population which did not include the hematologic tumour may generate selection bias, leading the conclusion of our study was not suitable for all cancer types with cachexia. Finally, the association of low HGS with mortality of female patients with cancer cachexia cannot be explained clearly in our study. When the TNM stage was enrolled into the adjusted factors of RCS analysis, the trend of RCS curve in female had a great change we cannot explain. It needs to be explored and explained in a future study.
Conclusion
In conclusion, we established the sex-specific cut-off points for Chinese patients with cancer cachexia. Low HGS was associated with poor 1 year survival of both male and female patients with cancer cachexia. The impact of low HGS in male patients was greater than that in female patients. Low HGS had combined effects with high NLR and low albumin on the poor survival of patients with cancer cachexia. It is important to focus on the baseline HGS of cancer patients to help us better assess outcomes and guide precise treatment.
Acknowledgements
The authors certify that they comply with the ethical guidelines for publishing in the Journal of Cachexia, Sarcopenia and Muscle: update 2019.42
Funding
This work was financially supported by National Key Research and Development Program to Dr Hanping Shi (No. 2017YFC1309200).
Conflict of interest
The authors have declared no conflicts of interest.


