Biomarker expression analysis in different age groups revealed age was a risk factor for breast cancer
Abstract
The relationship between age and breast cancer is ambiguous. Here, we analyzed the differential expression pattern of long noncoding RNAs (lncRNAs) and messenger RNAs (mRNAs) in different age groups to provide an effective association between age and breast cancer risk at the molecular level. We integrated the microarray information from the Cancer Genome Atlas (TCGA) and Gene Expression Omnibus (GEO) data sets. The patients were divided into young ( < 50 years) and old ( ≥ 50 years) age groups and evaluated by differential gene expression, weighted gene correlation network analysis (WGCNA), functional enrichment analyses, and coexpression analysis. To determine their potential clinical significance, univariate Cox regression analysis and survival assessment were conducted. We identified two lncRNAs (AL139280.1 and AP000851.1) and three mRNAs (MT1M, HBB, and TFPI2) as the risk markers, and Gene set enrichment analysis (GSEA) focusing on a single gene revealed that "pyrimidine metabolism," "cell cycle," and "P53 signaling pathway" were coenriched. These data demonstrated that age may be a risk factor for breast carcinogenesis and prognosis and provide an in-depth molecular characterization based on the expression patterns of lncRNAs and mRNAs.
1 INTRODUCTION
As an organism ages, changes occur at the cellular and tissue levels, and these signs of aging ultimately lead to various diseases and limit life expectancy (Jin, 2010). In general, age is considered the strongest demographic risk factor for most chronic diseases, including cancer (Latorre & Harries, 2017), but this association is not as strong for breast cancer (BC) (Bray et al., 2018).
BC, one of the most common malignant tumors, remains a serious health threat for women. However, the etiology and development of BC are complex and multifactorial. Increasing evidence has emphasized the connection between age and risk of BC; however, the underlying mechanisms remain unclear. The risk of triple-negative breast cancer (TNBC) in women who are < 40 years old has been shown to be more than two times the risk in women who are > 50 years old (Trivers et al., 2009). In addition, several prognostic studies have shown that young women with BC had worse outcomes than older women (Cancello et al., 2010; Lian et al., 2017; Santos Sda, Melo, Koifman, & Koifman, 2013; Sharma & Singh, 2017). Thus, studying the impact of age on BC and underlying age-related mechanisms has become crucial to better understand this disease.
Messenger RNAs (mRNAs) and long noncoding RNAs (lncRNAs) play important roles during development and aging. Belonging to the family of noncoding RNAs, lncRNAs have been shown to be essential in the development and differentiation of normal cells and tissues as well as in the initiation and progression of various pathogenic conditions, especially cancer (Khorkova, Hsiao, & Wahlestedt, 2015). Recent studies have suggested that there are age-dependent variations in lncRNA expression profiles (Arshi et al., 2018; Pereira Fernandes, Bitar, Jacobs, & Barry, 2018). Analyses of the molecular processes involved in some age-related phenotypes have provided compelling evidence confirming that lncRNAs are indeed key regulators in the manifestation of these phenotypes (Grammatikakis, Panda, Abdelmohsen, & Gorospe, 2014; Kour & Rath, 2016). However, most of such studies have focused on neurodegenerative diseases since neurodegenerative diseases are highly associated with increased age (Wan, Su, & Zhuo, 2017). Although there have been few studies using lncRNA and mRNA expression analyses to elucidate the links between age and cancer risk, the reported results have proven to be important. In particular, BC is affected by menstrual hormones, usually in a time-dependent manner.
In the present study, we constructed an lncRNA–mRNA model based on high-throughput data portals to explore the differences at the molecular level among different age groups of patients with BC. In addition, integrated data analysis was performed, and the results clearly showed the impact of age on BC at the molecular level. The workflow is displayed in Figure 1.
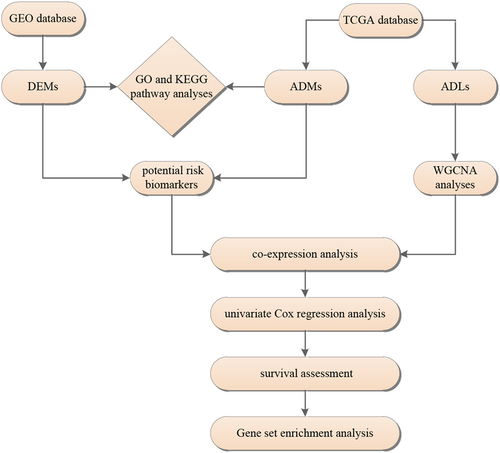
Workflow of the selection process for the eligible studies in the analysis. ADMs, age-stratified differential mRNAs; ADLs, age-stratified differential lncRNAs; DEMs, differentially expressed mRNAs; GEO, Gene Expression Omnibus; GO, Gene Ontology; KEGG, Kyoto Encyclopedia of Genes and Genomes; lncRNAs, long noncoding RNAs; mRNAs, messenger RNAs; TCGA, The Cancer Genome Atlas
2 MATERIALS AND METHODS
2.1 Procurement of BC data sets
All the available BC lncRNA and mRNA data sets were searched in The Cancer Genome Atlas (TCGA) data portal (https://cancergenome.nih.gov/) and obtained using the R/Bioconductor TCGA biolinks package (Silva et al., 2016; https://www.bioconductor.org/). Clinical and follow-up information were downloaded in separate files and extracted to perform age stratification and statistical analyses. Microarray profiles used to analyze the expression of mRNAs in tissues from patients with BC and normal mammary tissues were obtained from the Gene Expression Omnibus (GEO) database of NCBI (http://www.ncbi.nih.gov/geo).
2.2 Differential expression analysis
We used TCGA data for the analysis of age-based differential expression. Subjects were divided into two different groups, a young group with subjects who were < 50 years old and a relatively older group with subjects who were ≥ 50 years old. The differential expression pattern observed between the two groups in multifactor or multigroup experimental RNA-seq data from TCGA was identified using the edgeR package in R (R version 3.5.1). Specifically, we used a scaling normalization factor to adjust gene read counts, and then used the negative binomial (NB) model to calculate the significance of differential expressions and Benjamini–Hochberg method to adjust p-values (Lu et al., 2018). The age-stratified differential mRNAs (ADMs) and lncRNAs (ADLs) were screened.
The differentially expressed mRNAs (DEMs) in BC and normal tissues were screened from the GEO data. The Robust Multi-array Average (RMA) algorithm in the R package affy was used for background correction and normalization with the quantile method. Array probes were mapped to the corresponding gene ID. RMA is considered to be more efficient for the merging of microarray data sets from different platforms (Bolstad, Irizarry, Astrand, & Speed, 2003). Differential expression in two comparison groups was assessed with log-transformed values using Pearson's correlation. As the comparison was carried out between two groups, p-values were calculated using t test. The false discovery rate (FDR) was used for correction, and adjusted p-values were used for accurate data screening. For selecting the top features in a large sample data platform and differential expression, p < .05 and |log-fold change (FC)| > 1 were set as the cut-off criteria.
2.3 Characterization of differential data and molecular marker fishing
TCGA data representing age-level stratification and GEO data indicative of the differential expression in cancer and normal tissues were further characterized based on biological properties. Gene Ontology (GO) and Kyoto Encyclopedia of Genes and Genomes (KEGG) pathways were analyzed using DAVID (https://david.ncifcrf.gov/summary.jsp) to identify the functions and regulatory pathways of these predictive genes. And OmicShare Tools (https://www.omicshare.com/tools/) was used to visualize them. Morpheus (https://software.broadinstitute.org/morpheus) and R package were used for the generation of heat maps. Hierarchical clustering was performed with Pearson's correlation.
Venny 2.1.0 (https://bioinfogp.cnb.csic.es/tools/venny/index.html) was used to construct a Venn diagram to visualize the cross-genes of two sets of differential expression data, which were defined as risk biomarkers between different age groups.
2.4 LncRNA screening and weighted gene correlation network analysis (WGCNA)
First, EdgeR was used for the analysis of differential expression. The calcNormFactors function was used to describe equilibrium nodes to normalize the log-fold difference between the samples and for the calculation of log FC and P-values. We calculated the Pearson's correlation matrices for all the differentially expressed lncRNAs, and a suited value of β was applied to build a scale-free network. Then, a weighted adjacency matrix was converted to a topological overlap matrix (TOM) that measures the network connectivity of a gene. Genes with similar expression profiles were classified into different modules using hierarchical agglomerative clustering analysis, and the cutHeight value was set to 0.8. Module eigengenes (MEs) identifies expression patterns of all genes as a single characteristic expression profile within a given module. Lastly, modules with the highest correlation were selected for further analyses.
2.5 The coexpression and univariate Cox regression analyses of lncRNAs and mRNAs
We further identified ADLs that targeted the key mRNAs in the significant modules and then analyzed if there were any overlaps among these lncRNAs. This step was performed using the limma package of R software to characterize the coordinated changes in lncRNA and mRNA expressions. The expression correlation was obtained, and the initial acquisition criteria for lncRNAs were based on p < .05. The coexpression network was visualized using Cytoscape 3.6. Then, for the investigation of the prognostic values of ADLs and key mRNAs, we used a univariate Cox regression analysis to select potential biomarkers.
2.6 Prognostic analysis of the survival model
To further study the potential clinical significance of breast cancer biomarkers as molecular risk markers, the Kaplan–Meier curves were used to assess the differences in the overall survival by using the survival package in R. Furthermore, biomarkers which were prominently associated with overall survival were considered to be risk biomarkers.
2.7 Gene set enrichment analysis (GSEA)
GSEA is a computational method that is based on gene sets, that is, groups of genes that share common biological functions (Subramanian et al., 2005). The association between the key targets and potential biological mechanisms was analyzed with GSEA v3.0 (http://www.broad.mit.edu/gsea/) using the gene sets from the Molecular Signatures Database (MSigDB) as a reference. Metrics for ranking the key mRNAs were calculated based on Pearson's correlation coefficient. The maximum and minimum sizes of gene sets were set as 500 and 10, respectively. Thresholds for significance were determined by permutation analysis (1,000 permutations). Enrichment results with an FDR value < 0.25 and a nominal p < .05 were considered statistically significant.
3 RESULTS
3.1 Differential expression data collection
BC-associated mRNA expression data and clinical data of 1,011 samples were obtained from the TCGA database. Age stratification was performed based on the clinical data, and the young and old groups were found to contain 273 and 738 subjects, respectively. The limma package of R software was used for the analysis of differential expression. After screening by the truncation criteria, we obtained 687 ADMs (Table_1_SuppInfo).
The GPL4133 and GPL570 microarray platforms were screened, and three Affymetrix microarrays, GSE10780 (tumor:42; normal:143), GSE42568 (tumor: 104; normal: 17), and GSE45827 (tumor: 130; normal: 11), were identified. All of these microarrays are focused on BC and normal tissue samples. A total of 1,093, 4,028, and 5,940 DEMs were obtained from GSE10780, GSE42568, and GSE45827, respectively, after analysis and processing with R software.
3.2 Acquisition and characterization of the key mRNAs in age-stratified groups
We performed a feature analysis of the DEMs. A Venn diagram was constructed (Figure 2a), revealing 683 significant targets that overlapped among the three Affymetrix microarrays (Table_1_SuppInfo). A heatmap (Figure 2b) was constructed after clustering the top 100 overlapping DEMs with the highest |log2 FC| values using Morpheus online software. Volcano maps (Figure 2c), a heatmap (Figure_1_SuppInfo) of the ADMs were constructed using the R package. KEGG pathway and GO analyses were used to identify the enriched DEMs and ADMs (Figure 3). The key mRNAs differentially expressed in the BC and normal tissues were extensively enriched in cancer-related pathways, including cancers such as "Bladder cancer," "Prostate cancer," and "Colorectal cancer," and classical carcinogenic pathways such as "Focal adhesion," "Pathways in cancer," and "ECM-receptor interaction." ADMs were enriched in various developmental and differentiation processes, such as "ectoderm development," "keratinocyte differentiation," and "muscle organ development."
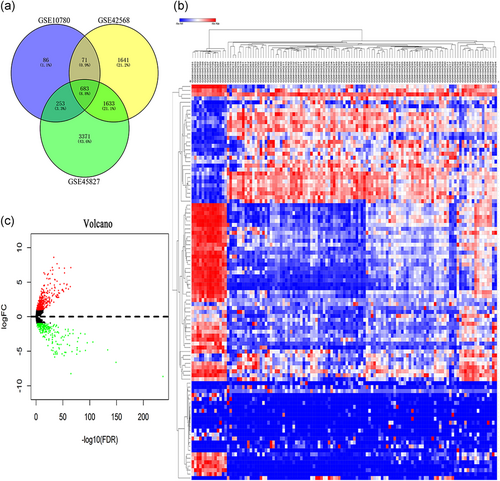
Screening and characterization of TCGA and GEO data. (a) Venn diagram of the DEMs from three Affymetrix microarrays GSE10780, GSE42568, and GSE45827. A total of 683 significantly overlapping mRNAs were finally obtained. (b) Heatmap of the DEMs. Red, blue, and white colors respectively represent the relatively high, low, and equal expression of mRNAs. Only the top 100 overlapping DEMs are shown. (c) Volcano map of ADMs. Green, red, and black colors respectively represent relatively low, high, and equal expression of mRNAs. ADMs, age-stratified differential mRNAs; DEMs, differentially expressed mRNAs; GEO, Gene Expression Omnibus; mRNAs, messenger RNAs; TCGA, The Cancer Genome Atlas
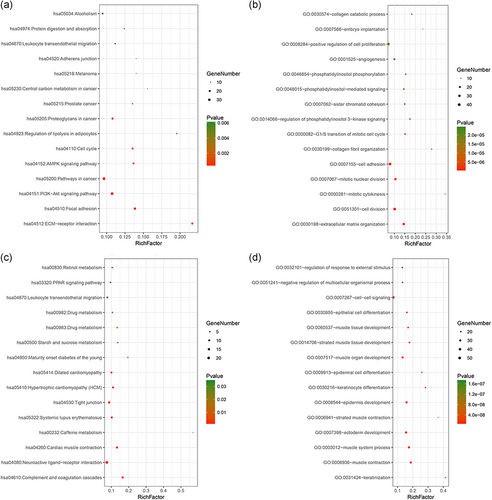
Bubble chart of the enrichment pathways based on the identified DEMs and ADMs. (a) and (b) KEGG pathway analysis and GO analysis for DEMs. (c) and (d) KEGG pathway analysis and GO analysis for ADMs. The cutoff criterion was p < .05, and the first 15 pathways are shown. ADMs, age-stratified differential mRNAs; DEMs, differentially expressed mRNAs; GEO, Gene Expression Omnibus; KEGG, Kyoto Encyclopedia of Genes and Genomes; mRNAs, messenger RNAs
Finally, we crossed the DEMs with ADMs and obtained MT1M, MB, HBB, KLHDC7B, MMP9, and TFPI2, which were considered to be potential risk biomarkers between different age groups.
3.3 Age-stratified risk lncRNA identification
We first obtained 348 ADLs by EdgeR package screening (Table_1_SuppInfo). Subsequently, using the “WGCNA” R package, these 348 ADLs were classified via the average linkage clustering, and a total of 11 modules were identified (Figure 4a). Then, the MEs indicated that the turquoise module clearly showed the highest association with age stratification (r = 0.067, p = .03; Figure 4b). Therefore, the turquoise module with 12 ADLs was identified as an important module of lncRNAs for further analysis.
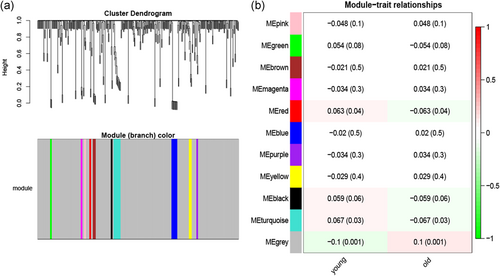
Network construction of the weighted coexpressed genes and their associations with the clinical traits. (a) Dendrogram produced by average linkage hierarchical clustering of the identified coexpression modules. The gray colored leaves indicate unassigned lncRNAs. (b) Module–trait relationships between the identified modules and clinical status (young vs. old). The numbers represent Pearson's correlation between the clinical traits and modules. The numbers in the parentheses correspond to the p-values. The background colors of the numbers represent the strength of the correlation. lncRNAs, long noncoding RNAs
3.4 The coexpression analysis and univariate Cox regression analysis of lncRNAs and mRNAs
First, we performed coexpression analysis of 12 ADLs with six key mRNAs. p < .05 was set as the truncation criteria, and 12 significantly correlated lncRNAs were obtained (Table 1, Figure_2-7_SuppInfo). The lncRNA–mRNA coexpression pattern was visualized with Cytoscape and displayed in Figure 5. Univariate Cox regression analysis that used p < .05 as the screening criteria found three lncRNAs (AL139280.1, AP000851.1, and AC079793.1), and four mRNAs (MT1M, HBB, MMP9, and TFPI2) were closely related to the overall survival of the patients with breast cancer.
| mRNAs | lncRNAs |
|---|---|
| HBB | LINC02523, AC000061.1, AC092580.2, AL139280.1, AP000851.1, LINC02474, and LINC00113 |
| KLHDC7B | AC000061.1, AC092580.2, AP000851.1, LINC02474, LINC00479, AC079793.1, LINC01170, and LINC00113 |
| MB | AC092580.2, AL139280.1, AP000851.1, LINC02474, AC079793.1, LINC01170, AP004247.2, and LINC00113 |
| MMP9 | LINC02523, AC092580.2, AL139280.1, LINC02474, AC079793.1, LINC01170, and LINC00113 |
| MT1M | AC092580.2, AL139280.1, AP000851.1, LINC00479, and LINC01170 |
| TFPI2 | AL139280.1, AP000851.1, LINC02474, LINC00479, and LINC00113 |
- Abbreviations: lncRNAs, long noncoding RNAs; mRNAs, messenger RNAs.
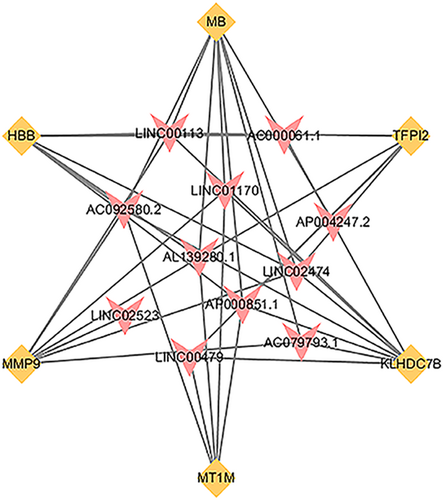
The construction of the coexpression network was based on Cytoscape. The pink triangles represent the key lncRNAs, while the orange quadrilateral represent key mRNAs. lncRNAs, long noncoding RNAs; mRNAs, messenger RNAs
3.5 Prognostic analysis of survival model
To improve the reliability of the risk biomarkers, we used the Kaplan–Meier curves to further clarify the relationship between the risk biomarkers and overall survival. We found that, altogether, two lncRNAs (AL139280.1 and AP000851.1) and three mRNAs (MT1M, HBB, and TFPI2) were significantly (p < .05) related to the overall survival on the basis of survival analysis (Figure 6a–e).
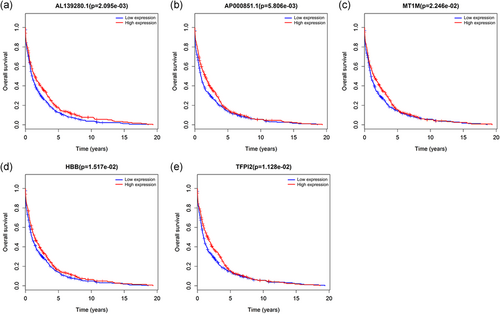
Kaplan–Meier curves of the risk biomarkers in breast cancer. (a) AL139280.1, (b) AP000851.1, (c) MT1M, (d) HBB, and (e) TFPI2. The criterion was set at p < .05
3.6 Differential expression enrichment analysis of the key targets
We aligned the TCGA data and focused on a single gene for the phenotype. We found that the differential regulation of MT1M, HBB, and TFPI2 was significantly enriched in "pyrimidine metabolism," "cell cycle," and "P53 signaling pathway" (Figure 7). This finding is also consistent with that of a previous study that showed that the three signaling pathways were closely related to cancer progression.
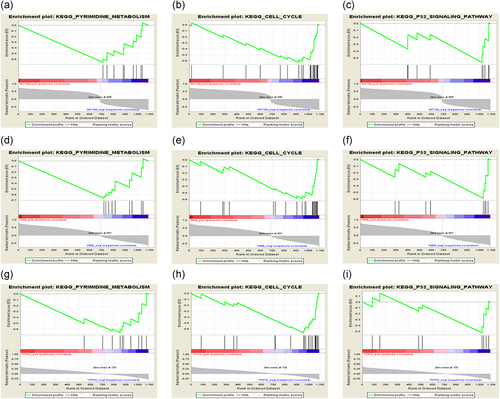
Identification of the enriched gene sets with GSEA analysis focused on a single gene as a phenotype in the merged microarray. Over-representation of negative MT1M, HBB, and TFPI2 were associated with pyrimidine metabolism (a, d, and g), cell cycle (b, e, and h), and P53 signaling pathway (c, f, and i)
4 DISCUSSION
As a complex chronic systemic disease, BC seems to be associated with age (Arshi et al., 2018; Hofstatter et al., 2018). However, there have been few studies that evaluated the effect of age on BC because of the lack of a suitable molecular biomarker for age. Studies have reported that lncRNAs play key roles in complex diseases, especially in development and aging, although most lncRNAs are poorly conserved, and their expression levels are significantly lower than those of mRNAs (Fatica & Bozzoni, 2014; Mercer, Dinger, & Mattick, 2009). In our study, we identified and validated the predictive values of two lncRNAs (AL139280.1 and AP000851.1) and three mRNAs (MT1M, HBB, and TFPI2) as risk models and provided age as a molecular assessment of BC risk.
Bioinformatics has been widely used in research and helps to further characterize molecular mechanisms of disease occurrence and development. We integrated the genes in TCGA and GEO that were differentially expressed and identified six key genes as the potential key markers for age-associated risk stratification. Then, the WGCNA analysis was performed. This is a relatively new and easy-to-understand coexpression network analysis method, which can aggregate coexpressed molecules into "modules" reflecting their interactions in biological systems, and it has successfully been applied to BC research (Li et al., 2019). Therefore, in this study, the lncRNAs in the turquoise module with the highest correlation with age stratification were used for further analysis. Next, hierarchical clustering was performed to evaluate the lncRNAs coexpressed with the six key genes. The basic assumption underlying this clustering was that genes in the same group with similar expression patterns might have similar functions. Finally, the risk biomarkers were identified by univariate Cox regression analysis and survival assessment.
Based on the integrated model, the five risk biomarkers received a good survival assessment. Metallothionein (MT) is a unique cysteine-rich small protein, which plays an important role in maintaining steady-state levels and detoxification of metal ions (Albrecht et al., 2008; Coyle, Philcox, Carey, & Rofe, 2002). In addition, recent experimental evidence suggests that MTs play a key role in tumorigenesis, development, drug resistance, and metastasis by participating in a variety of biological processes (Si & Lang, 2018). As a major member of the MT family, low expression of MT1M is related to poor prognosis in large cell lung cancer, esophageal squamous cancer, and hepatocellular carcinoma (da Motta, De Bastiani, Stapenhorst, & Klamt, 2015; Ding & Lu, 2016; Oka et al., 2009). HBB is a member of the globin family, and in addition to its involvement in gas transport (Bonaventura, Henkens, Alayash, Banerjee, & Crumbliss, 2013), it exerts antitumor activity. For example, studies have shown that HBB inhibits proliferation of human neuroblastoma cells (Maman et al., 2017). Low expression of HBB has been observed in lung adenocarcinoma, and it has been shown to be associated with poor prognosis in non-small cell lung cancer (Bepler et al., 2002). In addition, HBB expression has been found to be inhibited in anaplastic thyroid cancer cell lines/tissues and oral tongue squamous cell carcinoma (Onda et al., 2005; Suresh et al., 2012). As a Kunitz serine protease inhibitor, TFPI2 can inhibit many serine proteases, including trypsin, plasmin, plasma kallikrein, and chymotrypsin (Li et al., 2016). Studies have shown that the low expression of TFPI2 in small cell lung cancer (SCLC) can promote proliferation of the cells (Cao, Guo, Yin, Li, & Zhou, 2018). In addition, TFPI2 is closely related to apoptosis and angiogenesis in cervical cancer, and its expression tends to decrease with the progression of cancer (Zhang et al., 2012).
Due to the novelty of the two lncRNAs, their disease correlation needs to be further characterized. However, their differential expression pattern indicates that age is closely related to the occurrence and prognosis of BC. In addition, we obtained their details through the UCSC database, such as sequence information, length, exon count, position, etc. (Table_2_SuppInfo). Consistent with these reports, we found differences in the performance of these three key targets under different conditions. The results established herein suggest that inhibition of the three key targets may have abnormal consequences in the young group. This observation indicates that the young group is at a higher risk of BC and may be associated with a worse prognosis.
Pathway enrichment analysis is important to understand diseases. In our study, the differentially expressed genes were enriched in pathways associated with cancer, development, and differentiation. This finding is consistent with our hypothesis and demonstrates the credibility of the data we obtained. In addition, GSEA analysis was performed with the key targets MT1M, HBB, and TFPI2, which were significantly enriched in "pyrimidine metabolism," "cell cycle," and "P53 signaling pathway". Previous studies have shown that pyrimidine metabolism is significantly associated with poor prognosis of tumors (Choi & Na, 2018). Through regulation of DNA and RNA metabolism, epigenetic modification of pyrimidine metabolism may affect cell cycle, proliferation, and differentiation, including microRNAs and noncoding RNAs (Fu & He, 2012). In general, it is believed that the correlation between abnormal metabolism and cancer involves the associations among obesity, inflammation, and cancer cell proliferation, invasion, and angiogenesis (Amiri et al., 2018; Tang, Zhou, Hooi, Jiang, & Lu, 2018). Furthermore, cell cycle can influence cancer progression through mitosis and proliferation of cancer cells (Bai et al., 2019). The p53 signaling pathway plays a significant role in cell cycle regulation, aging, metabolism, reproduction, development, and suppression of tumorigenesis (Khan et al., 2019).
Previous epidemiological and clinical studies have also provided possible factors for an effective association between age and BC. The significant decrease in postmenopausal female hormone levels was thought to lower BC risk. For example, the decrease in the incidence of BC in the early 21st century was, at least in part, related to the decline in the use of postmenopausal hormone therapy after the launch of the Women's Health Initiative trial (Ettinger, Quesenberry, Schroeder, & Friedman, 2018). In addition, older women seem to be more likely to take nonsteroidal anti-inflammatory drugs (NSAIDs) as they age because of the onset of various diseases, and NSAID exposure has been shown to be associated with a decreased risk of BC (Hung et al., 2018). A worse prognosis may be related to the type of surgery performed. Given the importance of esthetics and quality of life in societies, conservative surgery is more likely to be chosen by young women in comparison with old women. The study by Arriagada et al. (2003) showed that younger patients who received breast-conserving treatment were more likely to develop advanced BC recurrence than patients who underwent mastectomy. Although various external environmental interventions affect the body to a certain extent, molecular studies based on large real sample data still provide a reliable trend between age and BC risk.
The present study has some limitations. Identification of the two lncRNAs as BC risk biomarkers is novel. Although the evidence suggests an effective association between them and BC risk, the mechanism underlying their link with BC needs to be further characterized. In addition, although more detailed age stratification would be desirable, we divided the population into just two age groups to obtain more data for each group, thereby reducing errors. Nonetheless, our study analyzed the age stratification of BC by summarizing the existing data, and we thereby demonstrated how such data might be used to profile characteristics of the genes associated with specific risks and disorders. Evidence at the molecular level that age is a risk factor was ultimately obtained.
5 CONCLUSION
In summary, our study found that two lncRNAs (AL139280.1 and AP000851.1) and three mRNAs (MT1M, HBB, and TFPI2) were differential risk biomarkers in patients with BC in both the young and old age groups. This finding was further expanded to determine the role of age as a risk factor in the development of BC. Consistent with the results of previous studies, we found that the differences in the expression patterns of the key targets might explain the higher risk and worse outcomes in young BC patients at the molecular level.
ACKNOWLEDGMENTS
This study is supported by the grants from National Natural Science Foundation of China (81673799) and National Natural Science Foundation of China Youth Fund (81703915).
CONFLICT OF INTERESTS
The authors declare that they have no conflict of interests.
AUTHOR CONTRIBUTIONS
C. S., X. X. conceived and designed the project; X. M., C. L., C. G., and J. W. collected and analyzed the data; C. S. and C. Z. interpreted the data; X. M., C. L., F. F., and L. W. wrote the manuscript; H. L., J. Z., and L. L. analyzed the data, and review the manuscript; H. L., Z. L., and J. L. participated in preparation of the figures and tables. All authors read and approved the final manuscript.
Open Research
DATA AVAILABILITY STATEMENT
The data that support the findings of this study are available from the corresponding author upon reasonable request.


