Identification of biomarkers correlated with hypertrophic cardiomyopathy with co-expression analysis
Abstract
Hypertrophic cardiomyopathy (HCM) is reported to be the most common genetic heart disease. To identify key module and candidate biomarkers correlated with clinical prognosis of patients with HCM, we carried out this study with co-expression analysis. To construct a co-expression network of hub genes correlated with HCM, the Weighted Gene Co-expression Network Analysis (WGCNA) was performed. Gene Ontology (GO) and Kyoto Encyclopedia of Genes and Genomes (KEGG) enrichment analyses were performed by Database for Annotation, Visualization and Integrated Discovery (DAVID). The protein-protein interaction network analysis of central genes was performed to recognize the interactions of central genes. Gene set enrichment analyses were carried out to discover the possible mechanisms involved in the pathways promoted by hub genes. To validate the hub genes, quantitative real-time polymerase chain reaction (RT-PCR) was performed. Based on the results of topological overlap measure based clustering, 2,351 differentially expressed genes (DEGs) were identified. Those genes were included in six different modules. Of these modules, the yellow and the blue modules showed a pivotal correlation with HCM. DEGs were enriched in immune system procedure associated GO terms and KEGG pathways. We identified nine hub genes (TYROBP, STAT3, CSF1R, ITGAM, SYK, ITGB2, LILRB2, LYN, and HCK) affected the immune system significantly. Among the genes we validated with RT-PCR, TYROBP, CSF1R, and SYK showed significant increasing expression levels in model HCM rats. In conclusion, we identified two modules and nine hub genes, which were prominently associated with HCM. We found that immune system may play a crucial role in the HCM. Accordingly, those genes and pathways might become therapeutic targets with clinical usefulness in the future.
1 BACKGROUND
Hypertrophic cardiomyopathy (HCM) is the most common genetic heart disease. It is reported that the prevalence is high up to 1 in 200 people (Semsarian, Ingles, Maron, & Maron, 2015). The most important feature of HCM is ventricular hypertrophy, which can lead to arrhythmia, heart failure, and even sudden death in clinic (Maron et al., 2014). Current treatments for HCM include ICD implantation in patients with high risk of sudden death, ventricular septal surgery (septal myectomy and alcohol ablation) in patients with outflow obstruction, heart transplantation in patients with advanced heart failure, and pharmacologic treatment (β-adrenergic blocking agents, calcium-channel blockers, and anticoagulant drugs; Maron, Rowin, Casey, & Maron, 2016).
Previous studies have shown that mutations in genes encoding sarcomere proteins are associated with HCM (Biagini et al., 2014). Genetic testing panels show great heterogeneity, especially with the development of whole-genome-sequencing, numerous variants have been found, makes it difficult to distinguish between pathogenic and nonpathogenic variants (Alfares et al., 2015; Maron, 2018). What we defined as an abnormal genetic variation might be completely normal in different racial, ethnic, and ancestry populations (Manrai et al., 2016). Improving the accuracy of the diagnosis of HCM is necessary because there are many other similar diseases, such as Fabry disease, Danon disease, prkag2-related cardiomyopathy, developmental disorders, and so forth, which could be easily misdiagnosed (Elliott et al., 2014). At present, genetic diagnosis is mainly used to exclude the gene carrying of other family members of the proband, but often some gene carriers do not have any cardiac events or symptoms, but it is still possible to pass the therapeutic gene to the offspring (Jensen et al., 2013). Finding high-efficiency and low-cost diagnostic methods to recognize key genes is currently the main challenge.
The pathogenesis and development of diseases may not be caused by a single gene, but by the synergy in a complex network. A systems biology algorithm of weighted gene co-expression network analysis (WGCNA) has been conducted to assess the association between gene sets and external sample characteristics by building a scale-free gene co-expression network (Langfelder & Horvath, 2008; Zhang & Horvath, 2005). Thus, we used the WGCNA algorithm to recognize network-centric genes associated with the progress and prognosis of HCM.
2 MATERIALS AND METHODS
2.1 Data collection
We downloaded the microarray datasets from the Gene Expression Omnibus (GEO) database (http://www.ncbi.nlm.nih.gov/geo/) and performed on Illumina HumanHT-12 V3.0 expression beadchip platform (GPL15389). Dataset GSE36961 was used as a training set to construct co-expression networks and identify hub genes in this study. This dataset included 145 samples, of which 109 are surgical myectomy tissues from patients with HCM, and 36 are control donor cardiac tissues. In addition, clinical information of all samples including age, gender, and type, were collected for further analysis.
2.2 Identification of differentially expressed genes
In order to recognize differentially expressed genes (DEGs) between the HCM and normal samples, “LIMMA” package in R was conducted (Smyth, 2004). To control the false discovery rate (FDR) caused by multiple testing, p-values were adjusted.
2.3 Weighted gene co-expression network analysis
Network construction was performed using the WGCNA R package. WGCNA started from the level of thousands of genes, these genes were divided into different modules according to connectivity patterns with other genes. Then, we related these modules to clinical traits and Gene Ontology (GO) information. The dissimilarity matrix was used to recognize gene modules through a dynamic tree-cutting algorithm (Zhang & Horvath, 2005). Genes were hierarchically clustered and visualized in a dendrogram. The branches of the tree labeled with a specific color represented one module containing highly correlated genes. The gray section donated background genes that belonged to none of the modules.
2.4 Bio-function enrichment analysis
The Database for Annotation, Visualization and Integrated Discovery (DAVID) is a web-based analytical tool can provide functional interpretation of genes derived from genomic studies (Huang et al., 2007). We used DAVID resources to perform GO functions and Kyoto Encyclopedia of Genes and Genomes (KEGG) pathway enrichment analysis. The GO terms of biological processes (BP), molecular functions (MF), and cellular components (CC) were carefully assessed. The biological functions of GO terms and KEGG charts were enriched with p < .05.
2.5 Identification of protein-protein interaction networks
We used the online Search Tool for the Retrieval of Interacting Genes (STRING database, Version 10.5; http://string-db.org/) to build a protein-protein interaction (PPI) network based on broad function of genome-wide data (Szklarczyk et al., 2017). After carefully calculating, the threshold >0.4 was applied to build the PPI network, and the cytoscape software (version 3.7.0; http://cytoscape.org/) was used to visualize and analyze the biological networks. The nodes of the networks represented “hub genes” that highly interacted with other genes or proteins.
2.6 Validation of DEGs
After obtaining the hub genes through the co-expression network, we verified several of them by real-time polymerase chain reaction (RT-PCR). We established aortic arch constriction (TAC) model in rats to induce cardiac hypertrophy (Rockman et al., 1991), and we collected nine septal samples, including four normal control and five HCM samples (from the TAC rats). Total RNAs were extracted using TRIzol Reagent (G3013; Servicebio, Wuhan, China). To get messenger RNA (mRNA) reverse transcription, RevertAid First Strand cDNA Synthesis Kit (#K1622; Thermo Fisher Scientific, Shanghai, China) was used in 2 μg of total RNA. Amplification of mRNA was carried out using the following system: 95°C for 10 min, then 40 cycles of 95°C for 15 s, 60°C for 60 s. Primers of RNAs are shown in Table 1. Glyceraldehyde 3-phosphate dehydrogenase (GAPDH) was used as the internal control for mRNA evaluation. Experimental data were calculated by SPSS 22.0 software, and the data were measured by mean ± standard error of mean (SEM). In the above calculation methods, p < .05 was considered to be statistically different. Our animal experiments were approved by the Animal Ethical and Welfare Committee of Nanjing Medical University.
| Sequences | |
|---|---|
| R- TYROBP-S | AGTGACAATTACCCAGGATGCG |
| R- TYROBP-A | AGTGACAATTACCCAGGATGCG |
| R- STAT3-S | TTAACATTCTGGGCACGAACA |
| R- STAT3-A | TGACAATCAAGGAGGCATCAC |
| R-CSF1R-S | GCGAGGGTTCATTATCCACAAG |
| R-CSF1R-A | TCACCAGCTTAGTAGGTTCCAATAT |
| R- ITGAM-S | GGGATCATTCGCTACGTTATTG |
| R- ITGAM-A | CCTGTCTGGGTGCCCTCAAT |
| R-SYK-S | GGAAGGTATTACACTATCGCATCG |
| R-SYK-A | GGCTTTGGGAAGGAGTAGGATT |
| R-ITGB2-S | AAGAAGTTGGGTGGTGATTTGCT |
| R-ITGB2-A | GTTGGAGTTGTCGGTTAGCTTGA |
| R-GAPDH-S | CTGGAGAAACCTGCCAAGTATG |
| R-GAPDH-A | GGTGGAAGAATGGGAGTTGCT |
3 RESULTS
3.1 Data processing and identification of DE genes and co-expression modules
R package annotation was carried out to match probes and several gene symbols. For genes matched by multiple probes, the average quantity was regarded as the expression value. At last, 2,351 genes were found to be differentially expressed between HCM samples and control samples. Among these DEGs, 1,197 were downregulated and 1,154 were upregulated. A heat map was conducted to assess the levels of the DEGs expression to distinguish the HCM and control samples. The 2,351 DEGs were used for cluster analysis by the WGCNA package (Figure 1a), and as we could find out, 145 samples were divided into two independent clusters.
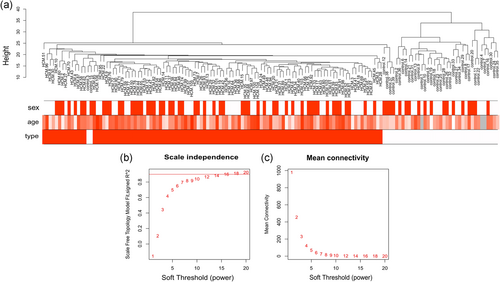
Clustering of samples and determination of soft-thresholding power. (a) The clustering was based on the expression data of GSE36961, which contained 109 hypertrophic cardiomyopathy (HCM) and 36 normal samples. The 2,351 genes with the highest p-values were used for the analysis by weighted gene co-expression network analysis (WGCNA). The different color was related to different disease status (normal and HCM), gender, and age. (b) Analysis of scale-independence index for various soft threshold powers. (c) Analysis of mean connectivity for various soft threshold powers, in all, 14 was the most fit power value [Color figure can be viewed at wileyonlinelibrary.com]
3.2 Construction of weighted co-expression network and identification of key modules
To identify the relatively balanced scale independence and mean connectivity of the WGCNA, we carefully selected the soft-thresholding power. As shown in Figure 1b,c, power value 14, was selected to produce a hierarchical clustering tree (dendrogram) of 2,351 genes. We found that those genes were contained in six different modules according to their degree of connectivity. There were 292 genes in the yellow module, 579 genes in the blue module, 309 genes in the brown module, 97 genes in the green module, 58 genes in the red module, and 605 genes in the turquoise module. The genes that could not be contained in any modules were placed into the gray module, which was removed in the following analysis. The co-expression modules are shown in Figure 2.
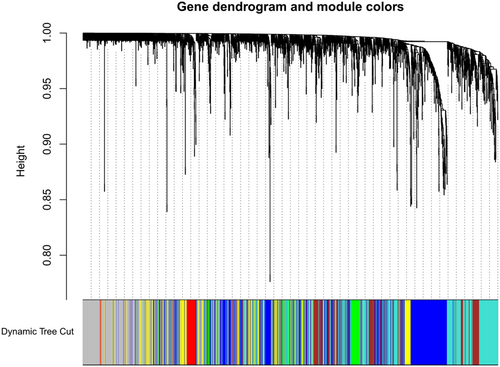
Construction of co-expression modules by WGCNA package in R. The cluster dendrogram of genes in GSE36961. Each branch in the figure represents one gene, and every color below represents one co-expression module. WGCNA, weighted gene co-expression network analysis [Color figure can be viewed at wileyonlinelibrary.com]
3.3 Correlation between modules and identification of key modules
Among the six different modules, interaction association was analyzed, and the network heat map was painted (Figure 3a). The results showed that modules were independent to each other, which indicated a relative independence of different genes expression in different modules.
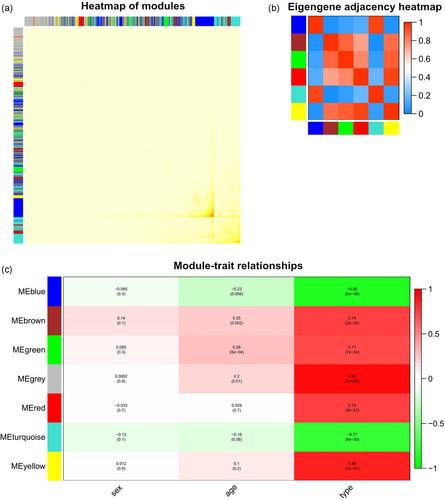
(a) Association analysis of modules. Different colors represent different modules, and the density of yellow in the middle of the figure represents the connectivity of different modules. There was no significant dissimilarity of association among different modules, showing high-degree independence among these modules. (b) Heat map plot of the adjacencies in the hub gene network. (c) Heat map of the association between modules and the illness status of HCM. The yellow and blue module showed to be more correlated with the type of HCM. HCM, hypertrophic cardiomyopathy [Color figure can be viewed at wileyonlinelibrary.com]
Our research showed that the six modules were separated into two main clusters. The heat map of hub gene network showed the similar results (Figure 3b). Further, the yellow and blue modules revealed a high correlation with disease type (normal or HCM) compared with other modules (Figure 3c). We recognized two modules, the yellow and the blue module, as the most significant modules to the illness status of HCM.
3.4 Kyoto Encyclopedia of Genes and Genomes pathway analysis
KEGG pathway maps of biological functions were obtained from the DAVID web-based search tool. Figure 4a shows the DEGs and the pathways in which they interact. We assessed the DEGs and identified five possible co-pathways in HCM samples: Phagosome, osteoclast differentiation, pathogenic Escherichia coli infection, mineral absorption, and apoptosis.

The Kyoto Encyclopedia of Genes and Genomes (KEGG) pathways enrichment (a) KEGG enrichment of differentially expressed genes (DEGs) of HCM and control samples. The x-axis represents the number of genes in enrichments. (b) KEGG enrichment of yellow module. (c) KEGG enrichment of blue module. HCM, hypertrophic cardiomyopathy [Color figure can be viewed at wileyonlinelibrary.com]
In the WGCNA study, the yellow and blue module showed a greater correlation with HCM. To explore the differences in the pathways in each module, we performed KEGG in all modules. The yellow module genes were mainly enriched in the tight junction, cAMP signaling pathway, thyroid hormone signaling pathway, glycerophospholipid metabolism, and cGMP-PKG signaling pathway (Figure 4b). The blue module genes were significantly associated with leishmaniasis, Staphylococcus aureus infection, complement and coagulation cascades, pertussis, inflammatory bowel disease (Figure 4c).
3.5 Gene Ontology functional analysis
We performed GO enrichment analysis of the DEGs following the LIMMA study. Among the biological processes (BP), the cluster was significantly associated with immune response, including the myeloid cell activation involved in immune response pathway, leukocyte degranulation pathway, myeloid leukocyte-mediated immunity pathway, neutrophil activation pathway, and granulocyte activation pathway. Among the molecular function (MF) analysis, our results showed that the DEGs were significantly associated with the cell adhesion molecule binding. In cellular component (CC) enrichment analysis, the terms of the primary lysosome were enriched. In the co-expression study, the genes in the yellow module, which were associated with HCM type, were mainly enriched in muscle contraction. In particular, it needs to be pointed out that the genes enriching the blue module showed significant association with immune responses when it came to the biological process analysis, which was similar to the result of DEG analysis, illustrating the potential molecular mechanism in relation to the HCM type (Figure 5).
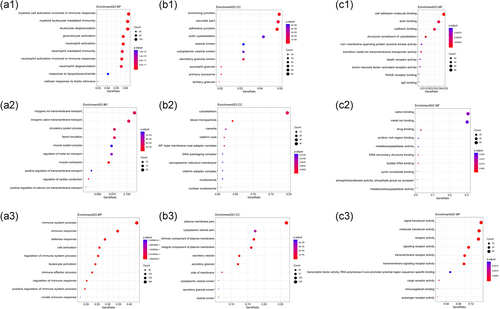
Gene Ontology (GO) terms enrichment: The functional enrichment analysis was performed using the Database for Annotation, Visualization and Integrated Discovery (DAVID). GO terms enrichment for DEGs (Figure 5.1), yellow module (Figure 5.2), and blue module (Figure 5.3) are shown in biological processes (a), molecular function (b), and cellular component (c). The sizes of the circle dots indicate the numbers of enriched DEGs, and the intensity of circle color indicates the p-value. DEG, differentially expressed gene [Color figure can be viewed at wileyonlinelibrary.com]
3.6 Protein-protein interaction network analysis of DEGs
Based on the STRING database, we constructed a PPI network of the yellow and blue module. After calculating the degree of each DEGs, 11 genes (CENPA, CCND1, AP1B1, MME, TUBG1, SPTAN1, ERCC5, TUBB4B, TUBA3C, ELL, and PPARG) of yellow module (degree >4) and 13 genes (IL6, TYROBP, STAT3, CSF1R, MYC, ITGAM, SYK, FOS, ITGB2, LILRB2, PLEK, LYN, and HCK) of blue module (degree >40) were considered central genes of each module. The interaction of genes of the PPI network is shown in Figure 6.
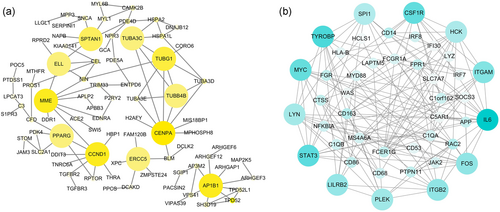
The Protein-protein (PPI) network constructed by the STRING database. (a) PPI network of hub genes of the yellow module. (b) PPI network of hub genes of the blue module (to make it easier to see, we simplified the picture by removing the low-connective nodes). The color of nodes represent the degree of gene interaction, the darker the color, the higher the connectivity of the genes [Color figure can be viewed at wileyonlinelibrary.com]
We selected the genes of DEGs with high connectivity as core genes. By comparing them with the central genes of the key module, we obtained the common hub genes in both DEGs and modules. Among the common hub genes, there were nine genes (TYROBP, STAT3, CSF1R, ITGAM, SYK, ITGB2, LILRB2) connected with immune response. Those common hub genes may play more crucial roles in the biological functions and the development of HCM than the other ordinary genes in the module (Figure 7).

Common genes of DEGs and modules. (a) Common genes of DEGs and yellow modules (the yellow circle). We sequenced the DEGs according to their connectivity, and selected 1,192 genes with high connectivity to act as the core genes in DEGs (the red circle). By comparing them with the genes of the modules, we obtained the common genes. There were five genes identified TUBA3C, PPARG, CCND1, ELL, and TUBG1. (b) Common genes of WGCNA and blue modules (the blue circle). Twelve genes were identified: TYROBP, STAT3, CSF1R, MYC, ITGAM, SYK, FOS, ITGB2, LILRB2, PLEK, LYN, and HCK. Among the 12 genes, there were nine genes (TYROBP, STAT3, CSF1R, ITGAM, SYK, ITGB2, LILRB2) connected with immune system. DEG, differentially expressed gene; WGCNA, weighted gene co-expression network analysis [Color figure can be viewed at wileyonlinelibrary.com]
3.7 Experimental validations of DEGs
For preliminary verification our identifications, the expression levels of TYROBP, STAT3, CSF1R, ITGAM, SYK, and ITGB2 were determined in HCM rats and normal controls. The RT-PCR results showed that the mRNA expression levels of TYROBP, CSF1R, and SYK were significantly increased in HCM rats contrast to the normal controls (Figure 8a, c, and f). Meanwhile, the expression levels of STAT3, ITGAM, and ITGB2 showed no significant difference between the HCM rats with the normal controls (Figure 8b, d, and e).
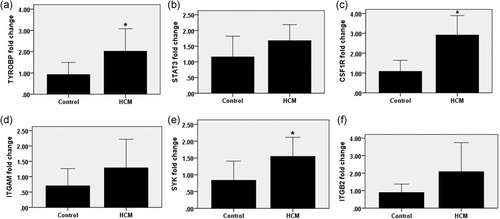
Expression levels of TYROBP, STAT3, CSF1R, ITGAM, SYK, and ITGB2 determined using quantitative real-time polymerase chain reaction. The mark * means there was significant difference between the two sets of data
4 DISCUSSION
Since hypertrophic cardiomyopathy was first described as autopsy in 1958 (Teare, 1958), it came to be considered the most common nontraumatic cause of sudden cardiac death among young adults (Maron, Doerer, Haas, Tierney, & Mueller, 2009; Maron et al., 2016). After two decades of exploration, investigators have defined the vast heterogeneity of the HCM substrate, reporting 11 or more causative genes with 1,400 mutations (Maron, Maron, & Semsarian, 2012). These genes encode thick and thin myofilament proteins of the sarcomere or contiguous Z-disc (Seidman & Seidman, 2011; Tester & Ackerman, 2011). Among the patients with positive genetic tests, more than a half (approximately 70%) are found to have mutations in the two most common genes, MYH7 and MBPC3 (Maron et al., 2012). A mutation could be considered pathogenic to meet the following criteria: amino acid sequence alteration in a highly conserved region, indicating its significance to basic cellular function (Richards et al., 2008; Tester & Ackerman, 2011). At the same time, many amino acid variants not generally expected to be deleterious, leading to what is called benign polymorphism. Even if those variants were identified, it was difficult to link them with certain disease clearly. In the end, these mutations of genes are considered as variants of unsure importance (VUS or VOUS; Landstrom & Ackerman, 2010; Richards et al., 2008; Seidman & Seidman, 2011), with no clinical usefulness for screening.
As a matter of fact, with the reduction of technology cost and wildly spread comprehensive DNA sequencing, the mutations of genes will be discovered more easily, and it will be harder to distinguish and explain mutations from pathogenic to nonpathogenic (Meder et al., 2011; Mestroni & Taylor, 2011).
What we do in this study is try to identify co-expression genes and possible biological pathways of HCM, aimed to facilitate the detection and illumination of differential genes in genetic testing in the future.
We used a dataset downloaded from the internet, identified 2,561 DEGs with R package. With the aim to assess the association between the DEGs and external clinical features, we carried out a WGCNA study and found that genes enriched in the yellow and blue module may be potentially targeted for HCM. Biological process analysis of the blue module showed that immune system process revealed an important role in the status of HCM.
By using The GeneCards human gene database (http://www.genecards.org), we made queries about the function of those related genes. At last, we found that the genes enriched in the immune system process, like AIF1 (allograft inflammatory factor 1), ALOX5 (arachidonate 5-lipoxygenase), ARPC1B (actin-related protein 2/3 complex subunit 1B), and so forth, not only made affection in the immune process, but also affected the cytoskeleton and myocardial proteins. Meanwhile, when we came to analyze the common hub genes of the DEGs and the modules, we also found that many genes are involved in the immune response, like TYROBP, STAT3, CSF1R, ITGAM, SYK, ITGB2, LILRB2, LYN, and HCK. Previous researches have confirmed that the gene TYROBP is mainly expressed on immune cells, like macrophages, natural killer cells, osteoclasts, and oligodendrocytes in peripheral organs (Takaki, Watson, & Lanier, 2006; Tomasello & Vivier, 2005). The gene modulates the functions of these cells to affect the immune system process (Turnbull & Colonna, 2007). However, how these genes affect cardiac hypertrophy has not been reported.
To initially verify the accuracy of the hub genes we obtained, RT-PCR were performed. We made HCM rats by the TAC model. Several hub genes we found were validated in our HCM rats and the normal control group. Among them, we found that the expression levels of TYROBP, CSF1R, and SYK increased significantly in HCM rats, and the expression levels of STAT3, ITGAM, and ITGB2 had an increasing trend contrast to normal rats, although they failed to reach statistical difference.
Although we have discovered and preliminarily verified some hub genes that may affect HCM, the mechanisms of these genes that could affect the myocardial cells are still unknown. Some relevant cytokines like tumor necrosis factor receptor-associated factor (TRAFs) and deubiquitinating enzymes (Gupta, Varshney, & Khan, 2018; Ji et al., 2016) have been reported, there are still few studies concerning the relationship between immune response and cardiac hypertrophy. We need more research to explore the correlations between the immune system and myocardial tissue.
It is worth mentioning that we found there was no significant correlation between age or sex and the modules. HCM could become clinically manifest at any age, and the sudden death occurred both in children and in adults (Maron, Rowin, Casey, Lesser et al., 2016; McKenna & Deanfield, 1984). The result suggested that HCM is a rather common genetic illness and is now regarded to occur in the global world (Maron, 2018; Maron, Rowin, & Maron, 2018).
4.1 Limitations
Although the results of gene-based co-expression analysis are enlightening, we currently do not understand how those genes contribute to the HCM. Our animal experiments are small and there is a lack of accuracy in the validation results, the advanced experimental validations should be accomplished. Meanwhile, what we used in this research, the STRING and the DAVID databases, are not widely used in other databases, there are huge difference between databases.
In conclusion, we identified the hub genes associated with HCM with the powerful co-expression analysis. As far as we know, this is the first study using co-expression analysis to explore the genetic expression of HCM. We found that the immune system process may play a key role in HCM, which is rarely covered in current research. We identified that several hub genes were significantly related to the immune system. We used RT-PCT to validate three of the hub genes, TYROBP, CSF1R, and SYK, and demonstrated that their expression levels were significantly increased in HCM rats. The relevance of these genes to HCM requires further advanced experiments to validate.
ACKNOWLEDGMENT
This work was supported by the National Natural Science Foundation of China (NSFC No. 81770333).
CONFLICT OF INTERESTS
The authors declare that there are no conflict of interests.
AUTHOR CONTRIBUTION
RC and TG designed the whole study. WJ and JH were responsible for the experiments. QC and JG were responsible for data analysis. RC drafted the paperpaper and QS revised it.
DATA AVAILABILITY
Our raw data is downloaded from the Gene Expression Onibus (GEO) database of the National Center of Biotechnology Information (NCBI) at https://www.ncbi.nlm.nih.gov/geo/query/acc.cgi?Acc=GSE36961.


