Integrated mRNA-Seq and miRNA-Seq analysis of PLCγ2-overexpressing hepatocarcinoma cells and identification of the associated miRNA-mRNA network
Abstract
Our previous study has discovered the positive effect of phospholipase Cγ 2 (PLCγ2) on the growth of hepatocarcinoma cells; however, the underlying mechanism is far from being understood. For this reason, this study attempts to identify the differently expressed microRNAs (miRNAs) and messenger RNAs (mRNAs) in PLCγ2-overexpressing hepatocarcinoma cells. The results showed that totally 596 differently-expressed genes (DEGs) were identified in PLCγ2-expressed cells, including 314 upregulated and 282 downregulated ones; according to gene ontology analysis, these DEGs were involved in different cellular processes. Concurrently, 34 differently-expressed miRNAs (DEMs) were also detected in PLCγ2-expressing hepatocarcinoma cells. Moreover, the integrative analysis of miRNA and mRNA expression profiles identified the potential regulatory network linked to hepatocarcinoma-related biological processes, including metabolic activity, gene expression, cell cycle, cell migration, and so on. To our knowledge, it is the first study on the effect of PLCγ2 on miRNA and mRNA expressions in hepatocarcinoma cells, and the findings provide new insights into the mechanism supporting the growth-promoting effect of PLCγ2 in hepatocarcinoma cells.
1 INTRODUCTION
Hepatocellular carcinoma (HCC), accounting for 90% of liver cancers, has become one of the leading causes of cancer-related deaths worldwide, and the morbidity rate caused by this disease is increasing year by year.1-4 Mounting evidence demonstrates the critical role of oncogenes and oncogenic signaling pathways in the occurrence and development of HCC.5 Phospholipase C (PLC) is a family consisting of 13 isozymes divided into six subfamilies, PLCγ, PLCε, and so on, and once activated, these enzymes cleave membrane phospholipid phosphatidylinositol 4,5-bisphosphate (PIP2) into diacylglycerol (DAG) and inositol triphosphate(IP3), subsequently triggering calcium and protein kinase C signaling,6 which eventually alters the metabolic pathways and regulates multiple important cellular functions, such as cell proliferation, differentiation as well as immune cell activation.7 Findings have suggested that the dysregulation of these signal pathways could hasten the development and progression of cancers.8
Phospholipase Cγ2 (PLCγ2) is one member of subfamily PLCγ and has been shown to engage in the development of many diseases. Mao et al9 in their study mentioned that inhibition of PLCγ2 enzymatic activity markedly blocked the development and function of osteoclasts, and more importantly, targeted deletion of PLCγ2 gene in mice could lead to an osteopetrotic phenotype. Also, Song et al10 observed a strong correlation between PLCγ2 activity suppression and the maximal rate of chronic lymphocytic leukemia cell death, thus validating the tumor-promoting function of PLCγ2 in this type of leukemia. In the study of the possible mechanistic insight into pathogenesis of juvenile dermatomyositis (JDM), Throm et al11 found that dysregulation of PLCγ2 phosphorylation caused a significant decrease in calcium flux in natural killer (NK) cells, finally contributing to the occurrence of JDM. Also, several observations have demonstrated the involvement of PLCγ2 activation in proliferation and migration of several cancers.12, 13 In the investigations from Feng et al14 and Leung et al,15 the significant growth arrest was seen in melanoma cells and breast cancer cells administrated with PLCγ2 inhibitor thieno [2,3-b] pyridines, respectively. However, PLCγ2 deletion also augments the growth of several cancers, as confirmed by one study indicating that PLCγ2−/− mice with dysfunctional osteoclast and impaired T cell activation were highly predisposed to develop into osteosarcoma.16 The similar conclusion was also drawn from our previous research showing a significant increase in the proliferation viability of hepatocarcinoma RH35 cells highly expressing PLCγ2. However, the exact mechanism of growth-promoting effect of PLCγ2 on hepatocarcinoma remains poorly defined.
It is well known that microRNAs (miRNAs) are a class of small, highly conserved and endogenous noncoding single stranded small RNAs with ~22 nucleotides (nts) in length. It has been found that a large number of miRNAs are present in the liver where miRNAs not only orchestrate cell differentiation but participate in hepatocarcinogenesis.17 miRNAs function as the regulatory molecules, acting as either oncogenes or tumor suppressor genes to govern the proliferation, invasion, and metastasis of hepatocarcinoma cells via some pathways.18 For instance, some miRNAs consistently overexpressed in HCC tissues, such as miR-21, miR-221, miR-222, and miR-224, have been confirmed to significantly cause the deregulation of cell cycle via targeting tumor suppressors including Pten6, Smad4, Cdkn1b/p27 and Cdkn1c/p57, Ddit4, Timp3, and Bmf.19-21 And there are also some documents reporting that miRNAs, for example, miR-122, miR-101, let-7 family, and miR-124, are consistently under-expressed in HCC tumors and act as tumor-suppressor genes to restrain cancer cell growth by negatively regulating oncogenes.22, 23 Of above-mentioned miRNAs, miR-122 is the most abundantly expressed miRNA, accounting for about 70% of total miRNAs in normal mouse liver, and inhibits the growth of liver cancer cells through dysregulation of DNA replication.24, 25
There is growing evidence that miRNAs usually suppress the expression of the corresponding target genes.26 Meanwhile, literatures have shown that regulation of messenger RNAs (mRNAs) by miRNAs in HCC can be elucidated using an integrative method27 which could be used for comprehensively analyzing the expression patterns of miRNAs and mRNAs to identify miRNA-mRNA regulatory network and identify candidate miRNA-mRNA target pairs in HCC. Therefore, this study employed the next-generation sequencing technology to investigate the miRNA and mRNA expression profiles in PLCγ2-overexpressing hepatocarcinoma cells. Through an integrated analysis of transcriptome and miRNAome, we attempted to shed light on the molecular mechanism defining the effect of PLCγ2 on hepatocarcinoma cell growth.
2 MATERIALS AND METHODS
2.1 Cell culture
Recombinant adenovirus vector carrying rat PLCγ2 (AdPLCγ2) used in this study has been constructed previously.28 Rat liver carcinoma cell line RH35 was gifted from the Key Laboratory for Cell Differentiation Regulation of Henan Normal University. Cells were cultured in Dulbecco's modified Eagle's medium supplemented with 10% fetal bovine serum and 100 U/ml penicillin/streptomycin at 37℃ in a humidified atmosphere with 5% CO2.
2.2 Grouping and adenovirus infection
The cells in the logarithmic growth phase were plated in a six-well plate and classified into two groups: control group (or AdGFP group, n = 3) and PLCγ2-overexpressing group (or AdPLCγ2 group, n = 3). For control group, the cells were infected with empty adenovirus AdGFP at an multiplicity of infection (MOI) of 50. For AdPLCγ2 group, the cells were treated with AdPLCγ2 at identical MOI. After infection for 24 hours, 48 hours, and 72 hours, MTT assay was done to detect the cell viability and result showed that the cells treated with AdPLCγ2 was the highest proliferation rate at 48 hours postinfection than those at other times. Also, quantitative real time polymerase chain reaction (qRT-PCR) results indicated the higher PLCγ2 mRNA level in the cells at 48 hours after AdPLCγ2-infection than the control group. Detailed protocols and results have been addressed in another manuscript.
2.3 RNA extraction, purification, and quality assessment
At 48 hours of infection, total RNA was extracted using Trizol reagent (Invitrogen, Life Technologies) following the manufacturer's instruction. Total RNA for each sample was quantified and qualified by Agilent 2100 Bioanalyzer (Agilent Technologies, Palo Alto, CA), NanoDrop (Thermo Fisher Scientific Inc), and 1% agrose gel. One microgram RNA with RIN (RNA integrity number) value >7.0 was used for following library preparation.
2.4 Library preparation, miRNA sequencing, and data analysis
The miRNA libraries were developed according to the manufacturer's protocol (NEBNext Multiplex Small RNA Library Prep Set for Illumina). Following the isolation and purification of 18 to 30 nt small RNAs, the 5′ and 3′ adaptors were ligated to small RNA molecules, and the ligation products were then reverse-transcribed into complementary DNA (cDNA) via polymerase chain reaction (PCR) amplification. The amplified fragments were sequenced using a 2 × 150 paired-end configuration in an Illumina HiSeq instrument (Illumina, San Diego, CA).
For obtaining high quality clean data, the resulting pass filter data were processed using Cutadapt 1.9.1 software to remove adapters, PCR primers and fragments thereof. miRDeep2 software was then applied for identifying miRNAs and their expression data. DESeq2 Bioconductor package was employed for differential expression analysis. |log2(FC)|>1 and the cut-off of P < .05 were set up to identify differently expressed miRNAs (DEMs).
2.5 Prediction and functional annotation of miRNA-targeted genes
In this present study, the miRmap software, a Python library for the target prediction of miRNA, was used to identify the candidate targets. The miRmap score indicates the suppression strength of miRNA targets. The higher miRmap score, the higher the suppression strength is. Here, miRNA targets with miRmap scores ≥90.0 were screened out for further gene functional analysis. Subsequently, the functional analysis of target genes was carried out with gene ontology (GO) database, a community-based bioinformatics resource supplying information about gene product function.
2.6 Library establishment and mRNA sequencing
As for mRNA sequencing, six mRNA libraries (three biological replicates in each group) were firstly prepared according to the manufacturer's protocol (NEBNext Ultra Directional RNA Library Prep Kit for Illumina). Briefly, the ribosomal RNA (rRNA) was removed from total RNA using Ribo-Zero rRNA removal Kit (Illumina). The remaining RNA was then fragmented and reverse-transcribed. The resulting double-stranded cDNA was subjected for purification and end repair, followed by the addition of adaptors to both ends. Adaptor-ligated cDNA fragments with ~360 bp in length were selected and amplified by PCR using P5 and P7 primers for generating a cDNA library. The cDNA library was validated with an Agilent 2100 Bioanalyzer (Agilent Technologies, Palo Alto, CA) and quantified using Qubit 2.0 Fluorometer (Invitrogen, Carlsbad, CA). Ultimately, the cDNA library was subjected to 2 × 150 bp paired-end sequencing by Illumina HiSeq (Illumina) according to the vendor's recommended protocol.
2.7 Identification of gene expression level and differently-expressed genes
By aligning the reads to the reference genome, the multi-mapped reads were discarded, and the uniquely mapped reads were screened and counted using HTSeq0.6.1 software. The number of paired-end clean reads was used to estimate gene expression level through FPKM (Fragments Per Kilobases per Million reads) method in Rsem V1.2.6 software.
Then, the relatively rigid algorithm method was utilized to evaluate the differential expression of genes between the two groups. P < .05, fold change ≥1.5, or ≤1/1.5 in combination with expression level ≥1.0 FPKM were referred to as the threshold to detect the significance of differently-expressed genes (DEGs).
2.8 GO and pathway enrichment analysis of DEGs
To elucidate the concrete biological functions of significantly differently expressed genes, the GO Consortium online tool was employed to analyze GO term enrichment of DEGs at functional level. To mine the critical signaling pathways enriched by DEGs, the Kyoto Encyclopedia of Genes and Genomes (KEGG) database-based pathway analysis was performed in this study. Finally, Fisher's exact test was used to determine the significant GO categories and the significant pathways according to the corrected P-value.
2.9 Protein-protein interaction network construction and module analysis
The interactions among the selected DEGs-encoded proteins were analyzed with rat protein-protein interaction (PPI) dataset from the Search Tool for the Retrieval of Interacting Genes/Proteins (STRING) database (http://string-db.org). The protein pairs with confidence score >0.9 were chosen for establishing the PPI network. The core module was mined in the PPI network of DEGs using the MCODE plugin in cytoscape. Finally, the networks were visualized by Cytoscape software.
2.10 Screening and interaction network visualization of miRNA-target gene pairs
In this study, DEMs, DEGs, and miRNA-target gene database miRmap were combinedly used for screening the important miRNA-target gene pairs involved in PLCγ2-stimulated hepatocarcinoma cell growth. miRNA-target pairs were selected from the prediction result of miRmap software only when both miRNAs and genes displayed the more significantly differential expression in the PLCγ2-overexpressing cells than that in the control cells. The pairs with miRmap score ≥90.0 were considered as miRNA-mRNA pairs that play the critical role in PLCγ2-promoting hepatocarcinoma cell growth. To visualize the regulatory relationship between miRNAs and the corresponding targets, Cytoscape software was utilized to establish the network of miRNA-target pairs.29
2.11 Functional analysis of miRNA-mRNA pairs
Based on the miRNA-mRNA genomic analysis, using gene ontology annotation (GOA) database online, this study analyzed and identified the biological function of each miRNA-mRNA pair with the opposite correlation.
3 RESULTS
3.1 Analysis of miRNA expression profiles in PLCγ2-overexpressing hepatocarcinoma cells
As indicated in our previous study, totally 285 known miRNAs were identified (data not shown). After using both |Log2Foldchange|≥1 and P-values ≤.05 as cut-offs, this study screened 34 DEMs in AdPLCγ2-infected hepatoma cells compared to the control group. Of these 34 DEMs, 9 miRNAs were up-expressed and the remaining 25 exhibited the opposite expression trend (Figure 1). To be more specific, rno-miR-324-5p, rno-miR-206-5p, rno-miR-493-5p, rno-miR-191b, rno-miR-433-5p, rno-miR-219a-1-3p, rno-miR-196c-5p, rno-miR-421-5p, and rno-miR-466b-2-3p showed the significant upregulation with |Log2FC| value ranging from 1.8 to 12; other 25 were dramatically downregulated, among which two miRNAs, including rno-miR-6328 and rno-miR-1306-5p, were decreased more than 8-fold.
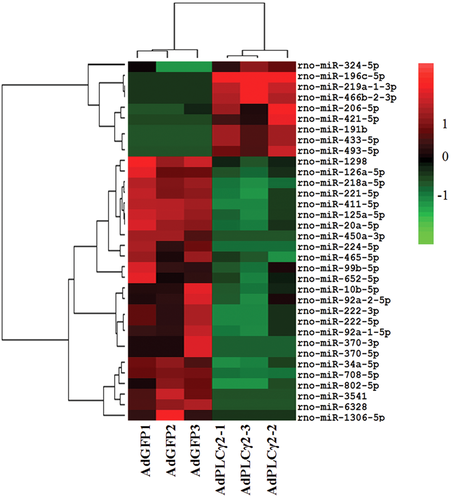
Clustering of 34 DEMs in PLCγ2-overexpressing cells compared to the control cells. The colors indicate the normalized expression values, in brief, green, red, and black denote the lower expression, higher expression, and insignificantly expression values, respectively. DEMs, differently-expressed miRNAs; PLCγ2, positive effect of phospholipase Cγ 2
3.2 Identification and function analysis of miRNA target genes
To elucidate the biological functions of above 34 DEMs, this study employed miRmap database to predict their target genes. As a result, 5279 genes were predicted as the potential miRNA targets (data not shown). GO analysis results showed that 5118 out of these target genes were successfully annotated for above 34 DEMs. According to GO enrichment analysis, there were mainly 93 significantly enriched functional groups (false discovery rate (FDR) < 0.05) assigned to 34 miRNAs, being involved in multiple biological processes, for example, metabolism, signal transduction, cell differentiation, development, cell biogenesis and morphogenesis, cell migration, immune response, etc. Herein, the top 20 functional groups are listed in Table 1.
| GO biological process | Background frequency | Sample frequency | Fold enrichment | FDR |
|---|---|---|---|---|
| G protein-coupled receptor signaling pathway | 2061 out of 21 465, 9.6% | 212 out of 5158, 4.11% | 0.43 | 1.01E−39 |
| Cell differentiation | 3455 out of 21 465, 16.1% | 1218 out of 5158, 23.61% | 1.47 | 1.60E−32 |
| Animal organ development | 3346 out of 21 465, 15.59% | 1182 out of 5158, 22.92% | 1.47 | 1.28E−31 |
| Anatomical structure morphogenesis | 2127 out of 21 465, 9.91% | 805 out of 5158, 15.61% | 1.57 | 5.69E−27 |
| Protein modification process | 2450 out of 21 465, 11.41% | 876 out of 5158, 16.98% | 1.49 | 2.32E−23 |
| Protein localization | 1800 out of 21 465, 8.39% | 639 out of 5158, 12.39% | 1.48 | 8.68E−16 |
| Cellular response to stress | 1501 out of 21 465, 6.99% | 545 out of 5158, 10.57% | 1.51 | 1.05E−14 |
| Organelle organization | 2988 out of 21 465, 13.92% | 954 out of 5158, 18.5% | 1.33 | 5.47E−14 |
| Protein transport | 1132 out of 21 465, 5.27% | 424 out of 5158, 8.22% | 1.56 | 7.75E−13 |
| Cellular protein localization | 1371 out of 21 465, 6.39% | 484 out of 5158, 9.38% | 1.47 | 1.82E−11 |
| Cell migration | 826 out of 21 465, 3.85% | 311 out of 5158, 6.03% | 1.57 | 1.83E−09 |
| Cell motility | 940 out of 21 465, 4.38% | 339 out of 5158, 6.57% | 1.5 | 1.25E−08 |
| Cell adhesion | 680 out of 21 465, 3.17% | 261 out of 5158, 5.06% | 1.6 | 1.6E−08 |
| Cation transport | 800 out of 21 465, 3.73% | 284 out of 5158, 5.51% | 1.48 | 1.15E−06 |
| Angiogenesis | 273 out of 21 465, 1.27% | 119 out of 5158, 2.31% | 1.81 | 6.74E−06 |
| Enzyme linked receptor protein signaling pathway | 525 out of 21 465, 2.45% | 194 out of 5158, 3.76% | 1.54 | 1.90E−05 |
| MAPK cascade | 169 out of 21 465, 0.79% | 82 out of 5158, 1.59% | 2.02 | 2.01E−05 |
| Small gtpase mediated signal transduction | 267 out of 21 465, 1.24% | 112 out of 5158, 2.17% | 1.75 | 5.78E−05 |
| Macromolecule catabolic process | 815 out of 21 465, 3.8% | 269 out of 5158, 5.22% | 1.37 | 2.47E−04 |
| Humoral immune response | 236 out of 21 465, 1.1% | 25 out of 5158, 0.48% | 0.44 | 5.77E−04 |
- Abbreviations: FDR, false discovery rate; GO, gene ontology; MAPK, mitogen-activated protein kinase.
3.3 Identification and analysis of DEGs in PLCγ2-overexpressing hepatocarcinoma cells
To reveal the molecular mechanism of PLCγ2-driven hepatoma cell growth, we performed the RNA-Seq analysis to compare mRNA expressions of AdPLCγ2-infected cells with the control ones. As depicted in Figure 2, 14 527 transcripts were detected using Illumina sequencing method. Out of these transcripts, 596 genes were identified as DEGs based on the criteria described in the “Methods and Materials” section, amongst of which, 314 genes were markedly increased and 282 genes were significantly reduced in expression levels (Figure 3A). The top 20 differentially expressed genes ranked by their fold changes were selected for cluster analysis (Figure 3B), in which several clusters with similar expressions were observed. In comparison to the control, Hao1, Fam50a, Cxcl10, Atp1b1, and Cgnl1 genes were the most highly upregulated, while Kctd15, Adipoq, Letmd1, Cst6, and Filip1 genes were the most significantly downregulated in PLCγ2-overexpression group. GO term enrichment analysis demonstrated that these DEGs were mostly implicated in cell proliferation, cell adhesion, cell migration, cell-cell signaling, metabolic process, defense response, immunity and inflammation, and several signaling pathways.
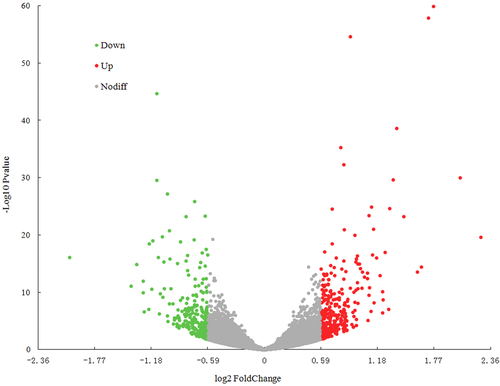
Volcano plot displaying gene expression alterations in PLCγ2-overexpressing cells compared to the control. X- and Y-axes indicate the fold changes of DEGs and the statistical significance of gene expression in PLCγ2-overexpressed cells, respectively. The red, green, and grey points represent ≥1.5-fold upregulated, ≤2/3-fold down-expressed, and equally expressed genes with a ratio > 2/3 or 1.5, respectively. DEGs, differently-expressed genes; PLCγ2, positive effect of phospholipase Cγ 2
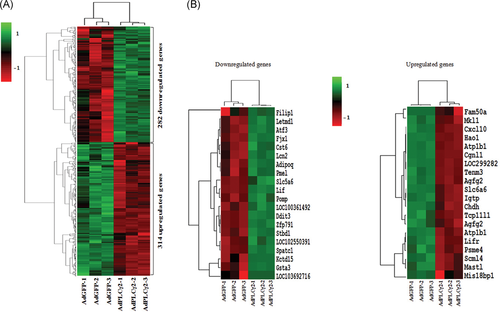
Hierarchical clustering heatmap showing the differential expression mRNAs between PLCγ2-overexpressing cells and the control cells. A, The expression profiles of 596 DEGs in the PLCγ2-overexpressing cells. B, The top 20 most significantly upregulated (right) and downregulated (left) genes exhibited on the heatmap. Each column represents one sample and each row represents a single gene. Gene expression alterations are represented by red (≥1.5 upregulation), green (≤2/3 downregulation), and black (unchanged expression) colors. DEGs, differently-expressed genes; PLCγ2, positive effect of phospholipase Cγ 2
3.4 Gene ontology and KEGG pathway enrichment analysis of DEGs
To uncover the relevance of these differently expressed genes to PLCγ2-driven hepatocarcinoma cell growth, both GO and KEGG analyses were done to mine cellular biological processes and signaling pathways, respectively. GO enrichment analysis showed that the 596 DEGs were primarily related to lipid metabolism, nucleic acid metabolism, organelle organization and biogenesis, cell cycle, and response to DNA damage (Figure 4A). Furthermore, KEGG pathway analysis results indicated the involvement of these DEGs mostly in glutathione metabolism, chemical carcinogenesis, peroxisome proliferator-activated receptor (PPAR) signaling pathway, mitogen-activated protein kinase (MAPK) signaling pathway, chemokine signaling pathway, transcriptional misregulation in cancer, etc (Figure 4B).
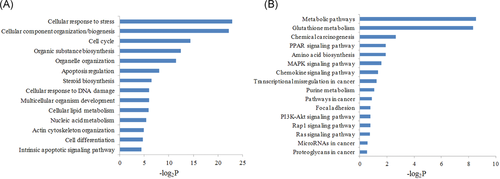
GO and KEGG enrichment pathway analyses of 596 DEGs. A, GO analysis of DEGs. B, KEGG pathway analysis of DEGs. DEGs, differently-expressed genes; GO, gene ontology; KEGG, Kyoto Encyclopedia of Genes and Genom
3.5 PPI network analysis
The PPI network of differently expressed genes-encoded proteins was created according to the information provided by the STRING database, and the built PPI network consisted of 72 nodes and 86 edges with average node degree of 2.36 and average local clustering coefficient of 0.848, involving 45 up- and 27 downregulated genes (Figure 5A). In addition, a significant module was dug out from the PPI network of DEGs using the MCODE plugin of Cytoscape, comprising 12 nodes and 59 edges (Figure 5B). These 12 representative genes were separately acetyl-CoA acetyltransferase 2 (Acat2), ATP citrate lyase(Acly), acyl-CoA synthetase short-chain family member 2 (Acss2), fatty acid synthase (Fasn), 3-hydroxy-3-methylglutaryl-CoA synthase 1, 2 (Hmgcs1, Hmgcs2), insulin induced gene 1 (Insig1), isopentenyl-diphosphate delta isomerase 1 (Idi1), nicotinamide adenine dinucleotide phosphate (NADP) dependent steroid dehydrogenase-like (Nsdhl), lanosterol synthase(Lss), methylsterol monooxygenase 1 (Msmo1), and squalene epoxidase (Sqle). Gene ontology combined with KEGG pathway analyses found that these 12 central genes mostly encode the proteins involved in sterol biosynthesis, lipid biosynthesis, cholesterol biosynthesis, acyl-CoA metabolism, and fatty acid biosynthesis which are essential for the rapid proliferation of tumor cells (Table 2).
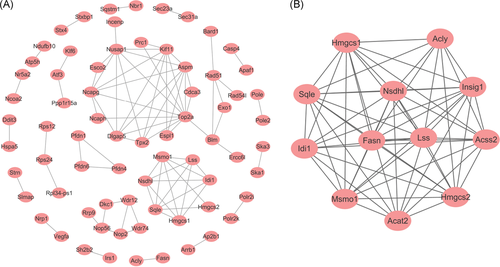
The PPI network of DEGs (A) and the significant module selected from PPI network using MCODE plugin in Cytoscape software (B). DEGs, differently expressed genes; PPI, protein-protein interaction
| GO term | Description | Count | P-value |
|---|---|---|---|
| GO:0016126 | Sterol biosynthetic process | 8 | 1.23E−19 |
| GO:0008610 | Lipid biosynthetic process | 10 | 1.36E−17 |
| GO:0006695 | Cholesterol biosynthetic process | 6 | 6E−16 |
| GO:0007275 | Multicellular organism development | 5 | 3.22E−15 |
| GO:0048731 | System development | 5 | 3.22E−15 |
| GO:0008299 | Isoprenoid biosynthetic process | 4 | 1.17E−11 |
| GO:0006637 | Acyl-coa metabolic process | 2 | 7.11E−06 |
| GO:0006633 | Fatty acid biosynthetic process | 2 | 7.11E−06 |
| GO:0071398 | Cellular response to fatty acid | 2 | 2.81E−05 |
| GO:0001889 | Liver development | 3 | .00015 |
- Note: Count, the genes numbers involved in certain biological process.
- Abbreviation: GO, gene ontology.
3.6 Integrated genomic analysis of miRNA and mRNA expression profiles
As mentioned above, miRNA target genes have been successfully predicted by miRmap software. To clarify the regulatory relationship between miRNAs and mRNAs, the significant miRNA-mRNA pairs were first identified based on gene expression profiles obtained from this study. Usually, the target genes are negatively regulated by upstream miRNAs. So, theoretically, once miRNA expressions are repressed in the PLCγ2-overexpressing cells, their targets are upregulated and vice versa. In this study, a total of 2311 miRNA-mRNA pairs with significantly differential expressions were found in PLCγ2-overexpressing cells (data not shown). To further find out the central part of network which perhaps plays an important role in cellular processes, the miRNA/mRNA pairs with miRNA targets of miRmap score ≥90 were selected as the part of central network. As shown in Figure 6A, 17 DEMs were identified as the central miRNAs exhibiting the expression profiles opposite to the corresponding targets. Moreover, several miRNAs were found to share some common target genes.
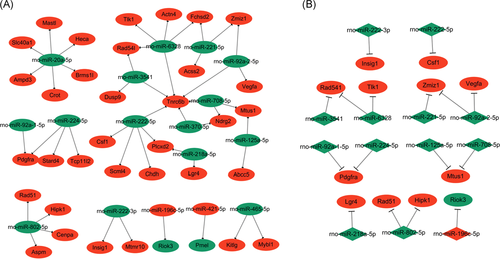
miRNA-mRNA negatively regulatory network in PLCγ2-overexpressing hepatocarcinoma cells. A, The miRNA-mRNA network related to PLCγ2-stimulated hepatocarcinoma cell growth by integrating the expression changes of target genes. B, The core of regulatory network. Red and green indicate upregulated and downregulated expressions, respectively. miRNA, microRNA; mRNA, messenger RNA; PLCγ2, positive effect of phospholipase Cγ 2
To determine the core of miRNA-mRNA regulatory network, GO enrichment analysis was performed on these differently-expressed targets. According to the result, those genes closely linked to tumor-related activities, such as cellular metabolism, DNA replication, and gene expression, were chosen for establishing one core miRNA-mRNA network. Interestingly, all the selected miRNA-target pairs have the opposite expression patterns in PLCγ2-overexpressing cells (Figure 6B).
4 DISCUSSION
HCC is one primary malignancy of the liver occurring predominantly in those people with chronic liver disease and cirrhosis and nowadays has become one of the most common causes of cancer deaths worldwide.30, 31 To find out the novel approach to cancer treatment, exploring the mechanisms involved in the pathogenesis of HCC has spawned much interest of researchers. Our previous findings have suggested the promotive effect of PLCγ2 on hepatocarcinoma cell proliferation, whereas, less certain is what the underlying mechanisms for such effects might be. Therefore, this study utilized high-throughput sequencing technology to reveal how PLCγ2 contributes to HCC cell proliferation at transcriptome level through the combined analysis of miRNA-mRNA regulatory network.
Depending on the RNA-Seq result and bioinformatics analysis, this study identified a total of 596 DEGs including 314 upregulated and 282 downregulated genes in PLCγ2-overexpressed cells compared to the control cells. Gene functional annotation showed that a substantial proportion of these DEGs encode the proteins supporting lipid metabolism, nucleic acid metabolism, organelle biogenesis, cell cycle, and response to DNA damage (Figure 4A). These differently expressed mRNAs maybe actively take part in PLCγ2-stimulated hepatocarcinoma cell growth via modulating the above cellular processes. Based on KEGG enrichment analysis, we identified the pathways enriched in genes associated with glutathione metabolism, chemical carcinogenesis, PPAR signaling pathway, MAPK pathway, chemokine signaling pathway, and transcriptional misregulation in cancer (Figure 4B). In view of this, PLCγ2 might have a vital role in promotion of hepatocarcinoma cell growth through regulating the above pathways. Also, the PPI network was established in this study to identify the potential central module, and the result showed that 12 representative genes were appraised as key genes, including Acat2, Acly, Acss2, Fasn, Hmgcs1, Hmgcs2, Insig1, Idi1, Nsdhl, Lss, Msmo1, and Sqle, which possibly provided the new clues for treatment strategy of HCC.
Interestingly, these 12 genes were all up-expressed in PLCγ2-overexpressing hepatocarcinoma cells, and mainly encode the enzymes involved in lipid biosynthesis and transportation. Liver cancer development is an extremely complex, multistep and multifactorial process, during which metabolic reprogramming is required to sustain the rapid proliferation of cancer cells, as proven by multiple documents.32-34 There is a vast body of evidence that the dysregulated lipid metabolism has been a newly-recognized hallmark feature of liver carcinogenesis. Observations have shown that rapid growth of cancer cells requires a sustainable supply of lipids for membrane formation. In view this, cancer cells have to enhance the uptake of lipids or activate de novo lipid synthesis which has been observed in many tumor types, including HCC.35-38 For instance, the observations showed high expressions of Fasn and Acly genes whose products are lipid metabolic pathway-involved enzymes in cancer cells.39, 40 Notably, Fasn is key to the synthesis of endogenous long-chain fatty acid. In keeping with our findings, this enzyme has been documented to display an elevated activity even in the presence of extracellular lipids in tumor cells.37, 41, 42 In addition, the abnormally increased cholesterol synthesis also belongs to an aberration of lipid metabolism occurring most often in many cancers.43-45 Two Hmgcs isoforms, including Hmgcs1 and 2, encode the key rate-limiting enzyme in cholesterol biosynthesis via mevalonic acid (MVA) pathway. Ashida et al46 observed a high expression of Hmgcs1 in prostate cancer (PC), and knocking down this gene by shRNA significantly attenuated the cell viability of PC, implying the positive correlation between cholesterol metabolism and cancers. However,47 found an opposite result that Hmgcs1 and Msmo1, both significantly upregulated in primary effusion lymphoma (PEL) cells, could induce PEL apoptosis through cell cycle arrest and DNA damage. The reason why the above two studies came to very different conclusions remains unclear and needs to be explained through further investigation.
Once cholesterol level is decreased, sterol regulatory element-binding proteins are translocated from the endoplasmic reticulum into the nucleus where this protein augments the transcription of the genes encoding sterol biosynthesis-involved enzymes (eg, ACSS2) under control of Insig gene.48 ACSS2 is mainly distributed in the cytoplasm and nucleus,49 and catalyzes the conversion of acetate into acetyl-CoA that act as an essential substrate for lipid synthesis in tumors, as shown in the studies on patient-derived glioblastoma. Observations demonstrated that inhibiting or knocking out ACSS2 could result in a dramatic reduction of lipid synthesis,50 and in turn restrain the growth and proliferation of some carcinoma cells.51-54 Besides the above gene Hmgcs, Acat2 is also one important enzyme in MVA pathway. Consistent with observation of the effect of Hmgcs1 on tumor development, high expression of Acat2 gene correlates with decreased survival in patients with breast cancer or brain tumor.55, 56 It is a common sense that there are two important rate-limiting enzymes in cholesterol synthesis, including HMGCR and SQLE. Among them, SQLE is the second rate-limiting enzyme and necessary for catalyzing the first oxygenation step in this metabolic process. Findings have demonstrated a significant upregulation of Sqle gene in many cancers (eg, HCC, prostate cancer, and breast cancer), which in turn facilitates cancer cell growth and leading to higher cancer mortality rates.57-59 Further investigations indicated that the oncogenic effect of this gene was mediated by its metabolite cholesteryl ester. The remaining three genes, such as Nsdh1, IDI1, and Lss are located in the central part of the network. Until now, there is little research report about their relevance to cancer development. According to the findings that the significantly increased expressions of these three genes were identified in this study, we hypothesized that they can become novel potential targets for therapy of liver cancer through normalizing cholesterol biosynthesis pathway.
The role of miRNAs in the pathogenesis of multiple types of cancers (eg, HCC) has been well established.60 Understanding the implication of miRNAs in carcinogenesis and cancer development might be beneficial to the early effective control of tumors. In regard to miRNAs, this study successfully identified 34 differently expressed miRNAs by applying high-throughput sequencing technology, comprising 9 upregulated and 25 downregulated miRNAs. Of these significantly altered miRNAs, rno-miR-466b-2-3p and rno-miR-6328 were sequentially the most significantly upregulated and downregulated. Interestingly enough, some studies have observed a dramatic decrease in expression of rno-miR-466b-2-3p in rats undergoing ischemic brain damage characterizing the active cell death.61 And the similar expression alteration of rno-miR-6328 has been detected in Tong's study in which underexpression of rno-miR-6328 caused a marked attenuation of spermatogenic cell apoptosis via regulating Bcl/Bax pathway.62
In general, the development of liver cancer is a multistage complex process characterized by uncontrolled cell division. Accumulating studies have confirmed that many miRNAs are dysregulated in HCC and closely associated with tumorigenesis, acting as either oncogenes or tumor suppressors.63-65 As mentioned previously, the role of miRNAs in cancers is most often mediated through targeting the mRNAs.66 There are multiple interconnected pathways between miRNAs and mRNAs, thus possibly generating the close cooperative relationship.67, 68 Therefore, studying miRNA-mRNA regulatory module has become an important means to unravel the pathogenesis of HCC. Thirteen miRNAs involved in building the core of miRNA-mRNA network were picked out by bioinformatics analysis in this study (Figure 6B). To better understand the impact of these 13 core miRNAs on HCC, more specific studies on these miRNAs would be further conducted in the future. In addition, depending on functional enrichment analysis performed in this study, we had a preliminary understanding of the role of miRNA-mRNA regulatory network in HCC. As for the above 13 core miRNAs, their corresponding target genes, such as Insig1, Csf1, Hipk1, Riok3, Tlk1, Rad51, and Rad54l, are mostly involved in lipid metabolism, DNA replication and protein metabolism which are indispensable for the high growth and proliferation activities of cancer cells. Collectively, identifying the core of miRNA-target networks can be helpful for a better understanding of PLCγ2-stimulated cell growth in liver cancer.
As demonstrated in our previous study, PLCγ2 has a positive impact on cancer cell proliferation, however, the underlying molecular mechanism still remains unclear. In this study, we screened out the potentially important DEGs and DEMs and constructed a central miRNA-mRNA regulatory network in the context of PLCγ2-stimulated hepatocarcinoma cell growth, which will perhaps provide new insight into the action mechanism of PLCγ2 in HCC development.
ACKNOWLEDGEMENT
This study was supported by the National Natural Science Foundation of China (No. 31401209) and Student Research Training Program (SRTP) from Henan University of Science and Technology (No. 2018368).
CONFLICT OF INTERESTS
The authors declare that there is no conflict of interests.


