LncRNA MEG3 contributes to adenosine-induced cytotoxicity in hepatoma HepG2 cells by downregulated ILF3 and autophagy inhibition via regulation PI3K-AKT-mTOR and beclin-1 signaling pathway
Zejin Pu and Lingfei Wu contributed equally to this study.
Abstract
Adenosine is a promising cytotoxic reagent for tumors, long noncoding RNA (lncRNA) maternally expressed gene 3 (MEG3) has been indicated to play critical roles in tumorigenesis, ILF3 has been recognized as a MEG3-binding protein, however, the roles of adenosine and MEG3 on hepatoma are still ambiguous. To clarify the effects of MEG3 on the adenosine-induced cytotoxicity in hepatoma, MEG3 and ILF3 lentivirus were transduced into human hepatoma HepG2 cells to stimulate overexpression of MEG3 (OE MEG3) and overexpression of ILF3 (OE ILF3), furthermore, ILF3 small interfering RNA (siRNA) was also applied to downregulate the expression of ILF3. In this study, autophagy was markedly inhibited by low concentration of adenosine, which present by not only inhibited transformation from LC3-I to LC3-II and autophagosomes formation, but also the elevation of mTOR and reduction of beclin-1 proteins. Furthermore, low concentration of adenosine also exerted marked cytotoxicity representing induced cell apoptosis together with reductions of cell viability and migration, which were also markedly enhanced by OE MEG3. Novelly and excitingly, adenosine markedly stimulated MEG3 expression, OE MEG3 markedly decreased the ILF3 expression in HepG2 cells, and the adenosine-induced autophagy inhibition, together with the ratio of p-PI3K/PI3K, p-AKT/AKT, and p-mTOR/mTOR were also boosted by OE MEG3. More interestingly, OE ILF3 increased autophagy, whereas downregulated ILF3, especially in the case of adenosine, led to marked autophagy inhibition by decreasing beclin-1. The present study demonstrates autophagy inhibition is involved in the adenosine-induced cytotoxicity in HepG2 cells, the cytotoxicity can be synergized by OE MEG3 via downregulated ILF3 to activate PI3K/Akt/mTOR and inactivate the beclin-1 signaling pathway. In conclusion, MEG3 and inhibition of autophagy might be potential targets for augmenting adenosine-induced cytotoxicity in hepatoma.
1 INTRODUCTION
Hepatoma is one of the most common tumors worldwide, particularly in less developed countries located in East Asia and Southeast Asia.1 Low sensitivity of chemotherapy drugs and regimens, including side effects, limits the clinical application of anticarcinogen in patients with hepatoma. Hence, searching for more effective and sensitive antihepatoma drugs, along with better understanding the underlying resistant mechanisms, might shed substantial light on the prognosis of hepatoma to some extent.2
Nucleoside analogs or derivatives, such as fludarabine, have been used in hepatocellular carcinoma (HCC) chemotherapy clinically.3 Notably, adenosine, another important nucleoside analog, exerts both promising and specific antitumor effects in various tumor types.4-6 Adenosine performs diverse biological functions in physiological condition with concentration lower than 1 µM, higher concentration of adenosine ( > 100 µM) usually emerges under stress conditions and some tumors.7
Autophagy is a process relied on lysosomes to hydrolyze vesicular contents to maintain cellular homeostasis and energy recycling.8 Autophagy is not only a physical process that helps cell survive by getting rid of or cyclizing unfold proteins and damaged organelles, but a pathological status existing in many diseases, including cancers.9, 10 Autophagy could induce programmed cell death in physiological situation,11 however, in tumor diseases, aberrantly activated autophagy would help cell survive and resist to chemotherapeutic drugs.12-14
Recent studies have also indicated the involvement of long noncoding RNAs (lncRNAs) for regulating autophagy and drug resistance.15, 16 LncRNAs, a class of noncoding RNA transcript longer than 200 nucleotides, play crucial roles in carcinogenesis.17 Maternally expressed gene 3 (MEG3), one of the foremost lncRNAs with tumor suppressor function, is an imprinted gene located on chromosome 14q32.3.18 Generally, MEG3 expresses in many human normal tissues, but downregulates or even disappears in many tumor tissues such as bladder cancer,19 lung cancer,20 and endometrial carcinoma.21
In this study, we try to study the effect of autophagy inhibition on the cytotoxicity of adenosine, and explore the effect of adenosine concentration on autophagy. Besides, we would prefer to investigate the effect of MEG3 on autophagy and cytotoxicity of adenosine, and explore the potential mechanism and application of MEG3 in the treatment of hepatoma.
2 MATERIALS AND METHODS
2.1 Reagents
HepG2 and 293T cells were purchased from Cell Bank of the Chinese Academy of Sciences (Shanghai, China). Adenosine, monodansylcadaverine (MDC), dimethyl sulfoxide (DMSO), and rabbit polyclonal LC3B antibody were from Sigma (St. Louis, MO). Rabbit monoclonal anti-beclin-1, anti-mTOR, anti-PI3K, anti-phosphorylated PI3K (p-PI3K), anti-AKT, and anti-phosphorylated AKT (p-AKT) were purchased from Cell Signaling Technology (Danvers, MA). ILF3 polyclonal antibody, mouse monoclonal anti-β-tubulin antibody was from Abcam (Cambridge, UK). Horseradish peroxidase (HRP)-conjugated goat-antimouse and goat-antirabbit HRP-conjugated IgG were purchased from Jackson (PA). Enhanced chemiluminescence (ECL) Western blot analysis Substrate Kit was purchased from Merck Millipore (MA). Cell Counting Kit-8 (CCK-8) was obtained from Dojindo (Kumamoto, Japan). Small interfering RNA (siRNA) targeting ILF3 gene was purchased from RiboBio Co. (Guangdong, China) and pEGFP-LC3 was obtained from addgene (addgene, MA). Plasmid Maxprep Kit was purchased from Vigorous Biotechnology (Beijing, China). Trans2K Plus II DNA Marker and TransStbl3 competent cell were purchased from TransGen Biotech (Beijing, China). Penicillin-streptomycin, Lipo LTX, OPTI-MEM, Trizol reagent, Polybrene (hexadimethrine bromide), fetal bovine serum (FBS), Dulbecco's modified Eagle medium (DMEM) were obtained from Thermo Fisher Scientific (Fremont, CA), and protease inhibitor cocktail was purchased from Roche (Basel, Switzerland). T4 DNA Ligase, TaKaRa LA Taq, advantage RT-for-PCR Kit, and SYBR Fast qPCR Mix were purchased from Takara (Takara Bio Inc., Shiga, Japan).
2.2 Cell culture
HepG2 cells were cultured in complete DMEM supplemented with 10% FBS (v/v), penicillin (100 U/mL), and streptomycin (100 mg/mL) under a humidified atmosphere of 5% CO2 at 37°C.
2.3 OE MEG3 and OE ILF3 in HepG2 cells by lentivirus transduction
Human MEG3 and ILF3 were synthesized in vitro followed by polymerase chain reaction (PCR) amplification (MEG3 primers: forward, 5′-ATCGGTTAACAGCCCCTAGCGCAGACGG-3′; reverse, 5′-TAAATGTGTTTCCTGTCTTAACAAAAAGGATCCCGTA-3′. ILF3 primers: forward, 5′-ATCGGTTAACATGCGTCCAATGCGAATTTT- 3′; reverse, 5′- CGGAATTCTTAAGCGTAATCTGGAACATCGTATGGGTATCTGTACTGGTAGTTCATGCTGTGG-3′), then cloned into pHIV-EGFP lentivirus vector. Correct plasmids of cloning were confirmed by Sanger sequencing, termed as pHIV-MEG3-EGFP and pHIV-ILF3-EGFP, respectively. Plasmids were prepared by using a Plasmid Maxprep Kit. To assembly recombinant lentiviruses, 9 µg pHIV-MEG-EGFP or pHIV-ILF3-EGFP, 6 µg psPAX2 (packaging plasmid), and 3 µg pMD2.G (envelope plasmid) were cotransduced into 293T cells by using 30 µL Lipofectamine LTX in 10 cm dish. Supernatants were harvested at 48 hours transduction, then filtered by 0.45 µm polyvinylidene difluoride (PVDF) membrane and 100 × concentrated by ultracentrifuge at 20 000 × g at 4°C for 2 hours. Virus titers were determined by transducing 293T cells with gradient dilutions of viral stock then by counting the number of GFP positive cells. The final titer of recombinant lentivirus was calculated as 8 × 10⁷ TU/mL. To overexpress MEG3 and ILF3 in HepG2 cells, 5 × 10⁵ HepG2 cells in six-well plate were transduced with MOI of 100 together with 8 µg/mL polybrene. Effect of overexpression was confirmed by the quantitative real-time polymerase chain reaction (RT-qPCR) (OE MEG3) and Western blot analysis (OE ILF3) after 72 hours transduction.
2.4 Knockdown of ILF3 by siRNA
To efficiently silence ILF3 gene expression, specific siRNA oligos to target ILF3 were reasonably designed, the effect of successful knockdown was verified by Western blot analysis. The oligo (GACCGAAATTTGCTGCTAA) with the highest silencing outcome was then cloned into pLL3.7 lentivirus vector (termed as pLL3.7-ILF3-siRNA) and verified by DNA sequencing. pLL3.7-LIF3-siRNA plasmid was prepared, together with psPAX2 and pMD2.G plasmid DNA, transduced into 293T cells as mentioned above. pLL3.7-LIF3-siRNA lentivirus was prepared exactly as before, and final titer of recombinant lentivirus was calculated as 7 × 10⁷ TU/mL. To knockdown ILF3 in HepG2 cells, pLL37-LIF3-siRNA with MOI of 100 was applied. Effect of ILF3 silence in HepG2 cells was verified by Western blot analysis after 72 hours transduction.
2.5 Real-time-quantitative polymerase chain reaction (RT-qPCR)
Total RNA was isolated from pHIV-EGFP-MEG3 or pHIV-EGFP (control) transduced HepG2 cells using the Trizol reagent based on manufacturer's instructions. Next, 1 μg of total RNA was reversely transcribed using M-MLV RTase complementary DNA (cDNA) Synthesis Kit, and RT-qPCR was performed using a SYBR Fast qPCR Mix by CFX96 real-time PCR system. Human MEG3 was detected (forward: 5′-GGTCTCTCCTCAGGGATGACAT-3′, reverse: 5'-TTAAGTCTTTAGGTAAGAGGGACAGC-3′). The 18S ribosomal RNA (rRNA) used as normalization was detected (forward: 5′-TATCAACTTTCGATGGTAGTCGC-3′, reverse: 5'-CAATGGATCCTCGTTAAAGGATT-3′). The relative expression of MEG3 transcription after 72 hours transduction was calculated by using the 2–ΔΔCt formula and fluorescence microscopy also was used to obverse the GFP expression.
2.6 Protein extraction and Western blot analysis
At indicated timepoints, different treated groups of HepG2 Cells were harvested and lyzed in radioimmunoprecipitation assay (RIPA) buffer (150 mmol/L NaCl, 1% Triton X-100, 0.5% sodium deoxycholate, 0.1% sodium dodecyl sulfate [SDS], and 50 mmol/L Tris, pH 8.0). Cell lysates were cleared by centrifuging at 12 000 rpm at 4°C for 30 minutes, and bicinchoninic acid (BCA) assay was used to measure the total protein concentration in the supernatant. Cleared supernatant was dissolved in Laemmli 4 × SDS loading buffer then boiled at 100°C for 5 minutes. About 10 μg total proteins were loaded on 8%-12% sodium dodecyl sulfate-polyacrylamide gel electrophoresis (SDS-PAGE) then transferred to 0.45 μm nitrocellulose (NC) membrane. NC membrane was blocked by 5% fat-free milk for 1 hour at room temperature, then incubated with different primary antibodies (1:2000 dilution) against LC3B (Sigma-Aldrich, Cat# L7543, RRID: AB_796155), beclin-1 (Cell Signaling Technology, Cat# 3738, RRID: AB_49083), mTOR (Cell Signaling Technology, Cat# 2972, RRID: AB_330978), PI3K (Cell Signaling Technology, Cat# 4292, RRID:AB_329869), p-PI3K (Cell Signaling Technology, Cat# 4228, RRID:AB_659940), AKT (Cell Signaling Technology, Cat# 9272, RRID:AB_329827), p-AKT (Cell Signaling Technology, Cat# 13038, RRID: AB_2629447), and β-tubulin (Abcam, Cat# ab6046, RRID: AB_2210370) at 4°C overnight. At the next day, HRP-conjugated goat-antirabbit (Jackson ImmunoResearch Labs, Cat# 111-035-003, RRID: AB_2313567) and HRP-conjugated goat-antimouse (Jackson ImmunoResearch Labs Cat# 115-035-003, RRID: AB_10015289) secondary antibody (1:10 000 dilution) was used for 40 minutes at room temperature, desired bands of target proteins were visualized using the ECL detection system. To determine the relative expression of target proteins, Quantity One software (Bio-Rad, Hercules, CA) was used to calculate the density of target proteins in each group with normalized to the density of β-tubulin.
2.7 Flow cytometry assay for cell apoptosis by annexin V-APC/PI
To confirm autophagy inhibition could increase adenosine-induced cell apoptosis, autophagy inhibitor 3-MA was applied in the study. For adenosine group, 1 mmol/L adenosine was added in HepG2 cells for 12 hours. For 3-MA group, 5 mmol/L 3-MA was used for 12 hours. For combined treatment of adenosine and 3-MA group, 1 mmol/L adenosine, and 5 mmol/L 3-MA were added for 12 hours. For OE MEG3 group, as mentioned above, pHIV-EGFP-MEG3 lentivirus (MOI = 100) was transduced into HepG2 cells for 72 hours. For combined treatment of OE MEG3 and adenosine, pHIV-EGFP-MEG3 lentivirus was transduced into HepG2 cells for 60 hours, followed by adding 1 mmol/L adenosine for additional 12 hours to reach a total 72 hours as a final time point. Apoptosis in HepG2 cells was measured by Annexin V-APC/PI Kit (keyGEN biotech, Jiangsu, China) according to the manufacturer's manual. Briefly, at indicated time point, all groups of HepG2 cells were trypsinised to single cell suspension, followed by twice wash with PBS, then resuspended in 500 µL binding buffer. Next adding 5 µL Annexin V-APC and 5 µL propidium iodide (PI), cells then were incubated at room temperature for 15 minutes in the darkness and immediately detected by flow cytometry (Gallios Flow Cytometer, Beckman Coulter, Brea, CA, USA). Flowing Software was used to analyze results and compare proportions of apoptotic cells between different treatments. The PI and Annexin V double positive populations was considered as late apoptotic cells, and PI negative but Annexin V positive populations indicated early apoptotic cells. Summation of both proportions of cells represented the apoptotic effects.
2.8 Determination of cell viability by CCK-8 assay
The viability of HepG2 cells was evaluated using CCK-8 kit at different timepoints in 96 well plates (2 × 10⁴ cells/well). Different experimental groups were set out and described exactly as those in Annexin V-APC/PI assay. HepG2 cells were incubated with adenosine, at the scheduled time point (indicating at 0, 12, 24, 48 and 72 hours), 10 µL CCK-8 (5.0 g/L) was added per well with another 2 hours incubation in the darkness at 37°C. Cell viability was measured by absorbance (A) at a wavelength of 450 nm using Wellscan K3 microtiter plate reader (KHB Lab-systems, Finland). The following equation was used to compare the relative readouts: Cell viability (%) = (A sample − A untreated) / (A control − A untreated).
2.9 Cell migration detection using transwell system
Transwell system was applied to assess capability of cells migration in HepG2 cells after various treatments. Different experimental groups were set out and described exactly as those in Annexin V-APC/PI assay. At the endpoint (equal to 1 mmol/L adenosine treating for 12 hours), HepG2 cells from different groups were harvested and re-seeded in the upper chamber of a 24-well transwell insert. The culturing conditions were: upper insert under FBS-free medium while bottom chamber was using complete DMEM. Cells migrated into the bottom chamber were collected 12 hours later, followed by ice-cold 100% methanol fixation and stained by 0.1% crystal violet at 37°C for 30 minutes, and then cell numbers and morphology were assessed by optical microscope (OLYMPUS, Japan) in five random fields.
2.10 Detection of autophagosomes by GFP-LC3 transduction
To determine whether inhibition of autophagy was induced by adenosine treatment, labeling of LC3 by GFP-LC3 transduction was used. Briefly, 2 × 10⁴ HepG2 cells were seeded at a 24-well plate overnight. Next day, 0.5 μg pEGFP-LC3 plasmid DNA was introduced into HepG2 cells by using 2.5 μl ViaFect Transduction Reagent according to instruction manual. Incubate cells for another 48 hours, followed by split and growing into a 24-well plate with coverslips. These cells were handled by different treatments as mentioned above. At the indicated time, cells were fixed by 4% paraformaldehyde for 10 minutes, followed by DAPI staining and mounting. All the coverslips were visualized under fluorescence microscopy and images were captured accordingly, and then five cells were randomly selected to calculated the average number of autophagosomes.
2.11 Statistical analysis
Quantitative data are presented as mean ± SD (standard deviation). Multi-group comparison was performed by one-way analysis of variance (ANOVA). Two-tailed Student t-test was used to compare between two groups. All experiments were performed in triplicate independently, and the statistical analysis was performed using SPSS, version 24.0 (IBM Corp., NY, USA), P < 0.05 was considered as statistical significance.
3 RESULTS
3.1 Low concentration of adenosine inhibits autophagy of HepG2 cells
The transformation from LC3-I to LC3-II, an indicator for autophagy, is considered as activation of autophagy, consequently, LC3-II and the ratio of LC3-II/LC3-I are usually used to evaluate the level of autophagy. After incubated HepG2 cells with 1 mmol/L adenosine, the LC3-II and LC3-I proteins were detected using Western blot analysis. The results showed autophagy was markedly inhibited by adenosine but not by DMSO in HepG2 cells (P < 0.01) (Figure 1 A). To evaluate the variance of autophagy, the level of autophagy was detected at the concentration of 0, 0.2, 0.5, 1, 2 mmol/L, respectively. In the present study, low concentration of adenosine (0.2-1 mmol/L) decreased the autophagy, which was more noticeable at the concentration of 1 mmol/L adenosine (P < 0.01) (Figure 1 B).
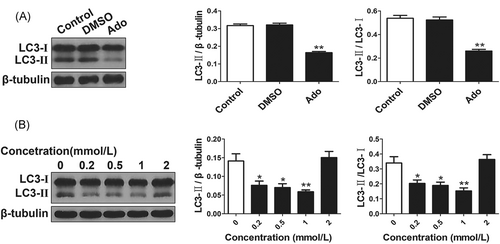
Autophagy inhibition in HepG2 cells by adenosine is concentration-dependent A. Autophagy was inhibited by adenosine (Ado) in HepG2 cells (**P < 0.01 vs DMSO and Control). B. The effects of different concentration (0-2 mmol/L) of adenosine on autophagy were analyzed. The expression of LC3-II and the ratio of LC3-II/LC3-I were decreased by adenosine (0.2-1 mmol/L), which was more remarkable at the concentration of 1 mmol/L (*P < 0.05, **P < 0.01 vs 0 mmol/L)
3.2 3-MA synergized adenosine to induce cell apoptosis and reduce cell viability and migration
To evaluate the cytotoxicity of adenosine, the viability and apoptosis of HepG2 cells were investigated, furthermore, the migration of HepG2 cells was also studied to present the anticancer ability of adenosine. 3-MA was used to evaluate the effect of autophagy inhibition on adenosine-induced cytotoxicity. Cell viability was detected by CCK-8 assay, after incubation with adenosine for 24 to 72 hours, the viability of HepG2 cells was decreased markedly in a time-dependent manner (P < 0.01), compared with adenosine alone, the viability was markedly decreased in combined adenosine and 3-MA group (P < 0.05) (Figure 2A). For cell migration assay, compared with control, the results revealed that the number of migrated HepG2 cells were markedly reduced after treated with adenosine (11.33 ± 2.52), 3-MA (13.33 ± 3.51) (P < 0.05) (Figure 2B). Compared with adenosine alone, adenosine combine 3-MA (6.00 ± 2.65) reduced markedly the number of migrated HepG2 cells (P < 0.05) (Figure 2B). Apoptotic cells were detected by Annexin V-Apoptosis Detection Kit (APC)/propidium iodide (PI) kit and analyzed using a flow cytometer, total apoptotic cells are the sum of late apoptotic cells (the upper right region) and early apoptotic cells (the low right region). Compared with control (1.09% ± 0.19%), the percentage of apoptotic cells was increased after treatment with adenosine (20.26% ± 2.49%), 3-MA (9.96% ± 1.57%); compared with adenosine alone, the percentage of apoptotic cells was markedly increased in combined adenosine and 3-MA group (30.66% ± 3.07%) (P < 0.01) (Figure 2C).
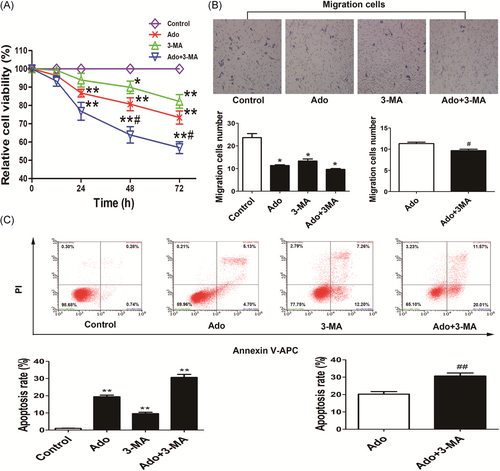
Enhanced cytotoxicity of adenosine by combined with 3-MA A, Viability of HepG2 cells was measured by CCK-8 assay. Remarkable reduction of viability was observed in adenosine and 3-MA single treating group (*P < 0.05, **P < 0.01 vs Control), and adenosine combined treatment with 3-MA markedly impaired the cell viability (#P < 0.05 vs Ado). B, Migration of HepG2 cells was detected by transwell assays. The migrated cells were markedly reduced in both adenosine and 3-MA single treated group (*P < 0.05 vs Control). Notably, 3-MA synergized the effect of adenosine-induced migration reduction of HepG2 cells (#P < 0.05 vs Ado). C, Striking increases of apoptosis detected by Annexin V/PI staining occurred in both adenosine and 3-MA single treating group (**P < 0.01 vs Control). Of note, 3-MA markedly boosted adenosine-induced cell apoptosis (##P < 0.01 vs Ado)
3.3 3-MA increased adenosine-induced inhibition of autophagy via increasing mTOR and decreasing beclin-1
The ratio of LC3-II/LC3-I was decreased in HepG2 cells by adenosine or 3-MA, which was markedly decreased in combined adenosine and 3-MA group (Figure 3A). To explore the potential mechanism of autophagy inhibition induced by adenosine, mTOR, and beclin-1, two key regulators of autophagy were detected by Western blot analysis. Like 3-MA treatment, the expression of mTOR was increased and beclin-1 was decreased after adenosine treatment, importantly, which were more significant in combined adenosine and 3-MA group (P < 0.01) (Figure 3B). Autophagosomes is the polymeride of many autophagic vacuoles in cytoplasm, increased autophagosomes indicates that more LC3-I transforms to LC3-II. Likewise, autophagosomes was reduced in HepG2 cells after treatment with adenosine or 3-MA, which was more obviously in combined adenosine and 3-MA group (P < 0.01) (Figure 3C).
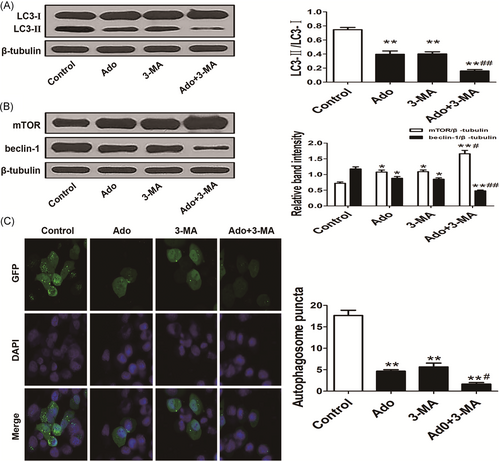
3-MA synergistically enhanced adenosine-induced autophagy inhibition by increased mTOR and decreased beclin-1. A, The ratio of LC3-II/LC3-I and the number of autophagosomes was decreased by adenosine and 3-MA, which indicated autophagy was inhibited (**P < 0.01 vs Control, ##P < 0.01 vs Ado). B, Upregulated mTOR and downregulated beclin-1 were detected in adenosine and 3-MA single treating groups (*P < 0.05 vs Control), in addition, combined treatment of adenosine and 3-MA markedly increased mTOR and decreased beclin-1 (**P < 0.01 vs Control; #P < 0.05, ##P < 0.01 vs Ado). C, The autophagosomes were detected by GFP-LC3. Autophagosomes were markedly reduced in adenosine and 3-MA single treating groups, combined treatment of adenosine and 3-MA markedly reduced the autophagosomes (**P < 0.01 vs Control, #P < 0.05 vs Ado)
3.4 Adenosine increased MEG3 expression and OE MEG3 decreased the expression of ILF3
Low MEG3 mRNA was detected in HepG2 cells using PCR, interestingly, which was increased gradually after adenosine treatment, markedly increased by adenosine as early as 6 hours, and decreased gradually after adenosine was discarded (P < 0.01) (Figure 4A). To study the mechanisms of adenosine-induced cytotoxicity, MEG3 lentivirus and ILF3 lentivirus were successfully transduced into HepG2 cells to induce OE MEG3 and OE ILF3, furthermore, ILF3 siRNA lentivirus was also constructed to confirm the effect of ILF3 in adenosine-induced cytotoxicity (Figure 4B and 4C). OE MEG3, OE ILF3, and downregulated ILF3 were all detected in HepG2 cells after the corresponding lentivirus transduction, all of above proved the MEG3, ILF3, and ILF3 siRNA lentivirus were transduced into HepG2 cells successfully. Excitingly, OE MEG3 decreased the ILF3 protein expression in HepG2 cells (P < 0.05) (Figure 4C).
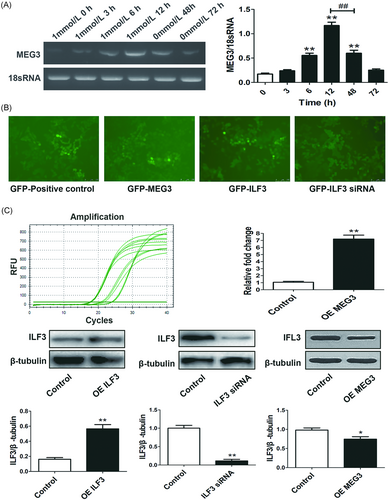
Adenosine-induced-MEG3 expression and MEG3, ILF3, and ILF3 siRNA lentivirus transduction A, MEG3 mRNA was increased in a time-dependent manner by adenosine in HepG2 cells, markedly increased MEG3 was detected after treated with adenosine for 6 hours (**P < 0.01 vs 1 mmol/L Ado 0 hours). Adenosine was discarded after treatment for 12 hours, and then MEG3 expression gradually decreased (##P < 0.01, 0 mmol/L Ado 48 hours vs 1 mmol/L Ado 12 hours). B, MEG3, ILF3, and ILF3 siRNA lentiviruses were successfully transduced into HepG2 cells, green fluorescence could be observed in HepG2 cells. C, The expression of synthesized MEG3 gene measured by RT-qPCR was significantly up to seven fold compared with the Control group in HepG2 cells, OE ILF3 and downregulated ILF3 were confirmed by Western blot analysis (**P < 0.01 vs Control). In addition, OE MEG3 downregulated ILF3 expression (*P < 0.05 vs Control). mRNA, messenger RNA; RT-qPCR, quantitative real-time polymerase chain reaction; siRNA, small interfering RNA
3.5 OE MEG3 synergistically enhanced adenosine-induced cytotoxicity
Viability of HepG2 cells was decreased after OE MEG3 treatment as early as 12 hours (P < .05), and the viability decreased gradually with the extension of treating time. Notably, compared with adenosine alone, cell viability was markedly decreased in the combined adenosine and OE MEG3 group (P < 0.05) (Figure 5A). For cell migration assay, compared with control (23.67 ± 3.06), the results revealed that the number of migrated HepG2 cells was markedly reduced after treated with OE MEG3 (8.00 ± 1.73) (P < 0.01) (Figure 5B). Compared with adenosine alone, the migrated HepG2 cells were markedly reduced in combined adenosine and OE MEG3 group (6.00 ± 1.73) (P < 0.05) (Figure 5B). Moreover, the percentage of apoptotic cells was also increased by OE MEG3 (8.69% ± 1.58%), however, which was markedly increased in the combined adenosine and OE MEG3 group (31.69% ± 3.37%) (P < 0.01) (Figure 5C).
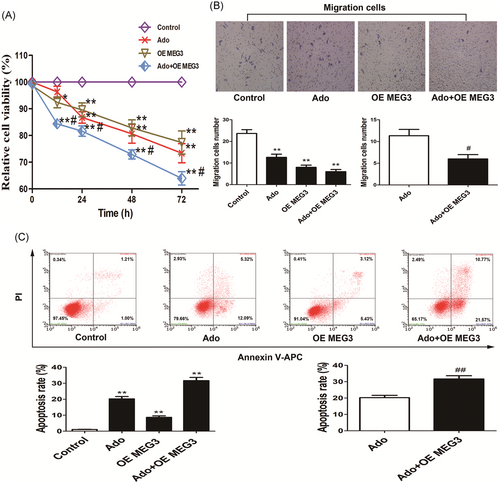
OE MEG3 synergistically enhanced adenosine-induced cytotoxicity. A, Reduced viability of HepG2 cells were measured in adenosine, OE MEG3 and combined adenosine and OE MEG3 treatments at 12 to 72 hours (*P < 0.05, **P < 0.01 vs Control). OE MEG3 remarkably enhanced adenosine-induced loss of viability (#P < 0.05 vs Ado). B, HepG2 cells migration was notably impaired after the OE MEG3 treatment (**P < 0.01 vs Control). OE MEG3 significantly synergized adenosine-induced impairment of migration capability (#P < 0.05 vs Ado). C, Apoptosis of HepG2 cells were dramatically induced by OE MEG3 (**P < 0.01 vs Control), although the apoptosis rate of HepG2 cells was lower than that in adenosine group. Combination use of OE MEG3 markedly augmented adenosine-induced apoptosis (##P < 0.01 vs Ado)
3.6 Not OE ILF3, but ILF3 siRNA and OE MEG3 synergistically enhanced adenosine-induced autophagy inhibition by activating the PI3K/AKT/mTOR pathway and inactivating beclin-1
Now that OE MEG3 increased the cytotoxicity of adenosine to HepG2 cells, we wonder whether autophagy is involved in the cytotoxicity regulation. Excitingly, OE MEG3 decreased the ratio of LC3-II/LC3-I, and reduced autophagosomes in HepG2 cells (P < 0.01) (Figure 6A and 6B). The results indicated that OE MEG3 could also inhibit autophagy to some extent. Moreover, OE MEG3 markedly synergized adenosine-induced autophagy inhibition, and decreased the expression of beclin-1 (P < 0.01) (Figure 6A and 6B). As mentioned above, the PI3K inhibitor 3-MA synergized adenosine to inhibit autophagy, which encouraged us to hypothesize the PI3K/AKT/mTOR signaling pathway might be associate the synergistic regulation of autophagy inhibition. The Western blot analysis results demonstrated that the ratio of p-PI3K/PI3K, p-AKT/AKT, and p-mTOR/mTOR were all augmented in adenosine group, the OE MEG3 group, especially in the combined adenosine and OE MEG3 group (Figure 6C). Compared with adenosine alone, the combined OE MEG3 and adenosine markedly enhanced the ratio of p-PI3K/PI3K, p-AKT/AKT, and p-mTOR/mTOR. Unexpectedly OE ILF3 was found to enhance the LC3-II/LC3-I and beclin-1, which indicated ILF3 increased autophagy via upregulated beclin-1, although beclin-1 was decreased after adding adenosine in the OE ILF3 treatment group, however, the autophagy was also promoted compared with control. Interestingly, ILF3 siRNA induced the autophagy inhibition, and synergized adenosine to inhibit autophagy in HepG2 cells (P < 0.01). Notably, more remarkably autophagy inhibition was found after combined adenosine and ILF3 siRNA treatment than adenosine treatment alone (P < 0.01).
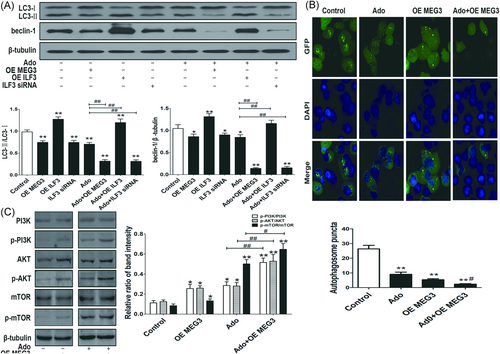
OE MEG3, downregulated ILF3, PI3K/AKT/mTOR, and beclin-1 were involved in adenosine-induced autophagy inhibition A, The ratio of LC3-II/LC3-I and the beclin-1 protein were decreased by adenosine, OE MEG3 and downregulated ILF3, respectively, and increased by OE ILF3 (*P < 0.05, **P < 0.01 vs Control). Markedly decreased autophagy was in adenosine combined with OE MEG3 or downregulated ILF3 group (##P < 0.01 vs Ado). In combined adenosine and OE ILF3 group, although adenosine decreased beclin-1 to normal, the ratio of LC3-II/LC3-I was still higher than that in Control group (**P < 0.01 vs Control, ##P < 0.01 vs Ado). B, Autophagosomes reduced in adenosine or OE MEG3 group, respectively, markedly decreased autophagosomes were observed in the combined adenosine and OE MEG3 group (**P < 0.01 vs Control, #P < 0.05 vs Ado). C, The ratio of p-PI3K/PI3K, p-AKT/AKT, and p-mTOR/mTOR were all increased in adenosine, OE MEG3 group, respectively, and remarkable increased in combined treatment of adenosine and OE MEG3 group (**P < 0.01 vs Control, #P < 0.05 vs Ado)
4 DISCUSSION
Hepatoma is in high morbidity and mortality around the world. To date, chemotherapy is the most common and available intervention to help most of hepatoma patients survive. Because of lacking efficient chemotherapeutic drugs, together with drug resistance, the hepatoma chemotherapy is not desired and survivals of these patients are often poor. The appetite of pursuing new effective reagents with lower chemical toxicity but larger specificity pushes the development of research. Adenosine, a nucleotide analog, previously has been proved to induce hepatoma cell apoptosis in a concentration (0.1-20 mmol/L) dependent manner,22 apoptosis in hepatoma. Our former studies also indicated adenosine-induced hepatoma HepG2 cells via NF-kappaB activation23 or endoplasmic reticulum stress.24 In the present study, marked autophagy inhibition was induced by 1 mmol/L adenosine, therefore, we lowered the concentration of adenosine to 1 mmol/L, and explored the cytotoxicity in hepatoma cells, tried to illustrate the possibility of low concentration of adenosine as antihepatoma drug and search for more optimized chemotherapy regimen.
Formation of autophagosomes is the hallmark of autophagy, which requires many proteins to form vesicle-like structure then fused with lysosome for degradation. Autophagy-related protein LC3-I conjugates to phosphatidyl ethanolamine to develop the lipidated LC3 protein termed LC3-II, the latter is recruited and aggregated to autophagosomes.25 Therefore, LC3-II and autophagosomes are considered as specific biomarkers of autophagy. Autophagy occurs at low level in normal cells, however, which is aberrantly activated in tumor tissue and cells.26 In spite of the reports that autophagy promoted cancer cell death,27 more studies revealed that autophagy contributes to chemoresistance in cancer including hepatoma,12, 14 thus drugs facilitating to inhibit autophagy could theoretically reverse the chemoresistance.28 In lung cancer resistance to cisplatin, combination of cisplatin with chloroquine, an inhibitor of autophagy, was more potent than cisplatin alone to inhibit cell proliferation and increase cisplatin-induced apoptosis.14 Chloroquine also enhances the cytotoxicity of cisplatin in hepatoma cells.28 In this study, adenosine downregulated LC3-II and the ratio of LC3-II/LC3-I, and reduced autophagosomes, which demonstrated adenosine could trigger remarkable autophagy inhibition. More importantly, low concentration of adenosine markedly induced apoptosis, inhibited viability, and migration of HepG2 cells as well. Our results demonstrate inhibition of autophagy by adenosine facilitates the cytotoxicity of adenosine in hepatoma, suggest the cytotoxicity of low concentration of adenosine is specific and effective for hepatoma therapeutic application, and encourage us for further study to elucidate the underlying mechanisms. Subsequently, upregulation of mTOR and downregulation of beclin-1, another two key factors in autophagy regulation, were found in hepatoma cells after adenosine treatment. With expectation in combined treatment with another autophagy inhibitor 3-MA, the adenosine-induced cytotoxicity was increased markedly, our findings further confirmed targeting the autophagy inhibition would contribute to the enhanced cytotoxicity of adenosine.
Low level of MEG3 exist in advanced or later stage of various tumors, as well as contributed to chemotherapy resistance and poor prognosis.29, 30 Of note, OE MEG3 has been reported to reverse resistance and enhance sensitivity of certain chemotherapeutic drugs.20, 31 To better understand whether MEG3 contributes to adenosine-induced cytotoxicity in HepG2 cells, we analyzed the MEG3 expression in the case of adenosine treating, especially focus more on OE MEG3-induced apoptosis, proliferation, and migration of HepG2 cells by means of lentivirus transduction. Consistent with our hypothesis, the data in our study showed adenosine could increase MEG3 expression in time-dependent manner. Importantly, after successful OE MEG3 in HepG2 cells, there was marked cellular cytotoxicity reflected in increased cell apoptosis and inhibition of cell viability and migration, furthermore, combined use of adenosine and OE MEG3 showed markedly synergic cytotoxicity in HepG2 cells. All of above indicate MEG3 could act as a potential target and serve as adenosine chemosensitizer for hepatoma treatment.
The relationship between lncRNAs and autophagy regulation has been intensively studied, increasing data indicated autophagy was regulated by MEG3 in various aspects.16 We here would like to disclose the possible crosstalk between MEG3 and autophagy inhibition, as both could be induced by adenosine and attributed to its cytotoxicity. ILF3, a ubiquitous protein, was reported to be involved in tumorigenesis.32 Knockdown of ILF3 led to inhibition of cell growth, migration, and invasion in breast cancer cells.33 In our previous study, ILF3 was confirmed as a MEG3-binding protein, decreased ILF3 was found under the condition of OE MEG3 in HepG2 cells.34 In the present study, we confirmed OE MEG3 decreased the ILF3 expression once again, and OE ILF3 enhanced autophagy, however, downregulated expression of ILF3 by siRNA-ILF3 led to autophagy inhibition in HepG2 cells. Excitingly, after treated by OE MEG3, autophagy in HepG2 cells could be remarkably inhibited, especially in the case of combined use adenosine. Analyzing for the underlying mechanism showed MEG3, adenosine and downregulated ILF3 decreased beclin-1, furthermore, MEG3 upregulated p-PI3K/PI3K, p-AKT/AKT, and p-mTOR/mTOR as well. Adenosine combined with OE MEG3 markedly activated PI3K/AKT/mTOR and beclin-1 signaling pathway than OE MEG3 alone, the results demonstrated that two signaling pathway are crucially involved in adenosine-induced cytotoxicity and autophagy inhibition in HepG2 cells. Considering adenosine promotes MEG3 expression and MEG3 decreases the expression of ILF3, we speculate MEG3 and adenosine inhibit autophagy partly via downregulated ILF3 to activate specific PI3K/AKT/mTOR and inactivate beclin-1 signaling pathway. These newly discovery enrich our understanding of the anticancer mechanisms of adenosine, help to better understand the multiple targets and regulations exerted by adenosine in HepG2 cells, and would provide potential value for hepatoma chemotherapy.
Taken together our findings, firstly demonstrated MEG3 synergistically enhances the cytotoxicity of adenosine in hepatoma, autophagy inhibition, and downregulated ILF3 are involved, and the PI3K/AKT/mTOR and beclin-1 signaling pathway attribute partly to cytotoxic effect of adenosine. Besides, we disclosed adenosine could upregulate the level of MEG3 and then downregulate ILF3 to augment its cytotoxic effects. Our study innovatively crosslinks the lncRNA MEG3 and autophagy pathway regulation in adenosine treating hepatoma cells, furthermore, extends the pharmacological knowledge of adenosine. Our results may provide further values of chemotherapeutic drugs design and targets, and suggest that low concentration of adenosine combined with OE MEG3 may be a good strategy for the hepatoma treatment.
ACKNOWLEDGMENTS
The authors thank Professor Enmin Li, Dongyang Huang, and Yucai Fu for excellent technical support. This study was supported by Guangdong Science and Technology Planning Project of China (No. 2014A020212284) and the Guangdong Natural Science Foundation of China (No. 2014A030313470).
CONFLICT OF INTERESTS
The authors declare that they have no conflict of interests.
AUTHOR CONTRIBUTIONS
Experiments were designed and the manuscript was written by ZP and LW. Cell culture, RT-qPCR, lentivirus transduction, and gene knockdown assay were completed by LL and YG. Western blot analysis was performed by XZ and HT. Flow cytometry assay and statistics were fulfilled by GL. GFP-LC3 assay was completed by YG. CCK-8 and transwell assay were detected by MX and HZ.


