Matrix stiffness mediates stemness characteristics via activating the Yes-associated protein in colorectal cancer cells
Abstract
Matrix stiffness is an essential physical microenvironment in solid cancer. However, its influence on cancer stemness still remains elusive. Colorectal cancer (CRC) cell line HCT-116 was cultured in the matrix with various stiffness. The siYAP was applied to detect the changes of stemness markers. The cancer stemness markers, Yes-associated protein (YAP), Lamin A/C and downstream protein molecules, and their activation were measured after the treatment with anti-β1-integrin and FAK inhibitors. In CRC tissue samples, collagen deposition and the expression of α-SMA and CD133 were detected. The study found that the expression level of stemness markers and Lamin A/C increased as the matrix stiffness raised and was regulated by YAP activation in CRC stem cells. Inhibition of β1-integrin and FAK activation in a high stiffness cell culture medium significantly decreased the activation of YAP, PI3K, and AKT. Collagen was highly deposited in the CRC invasive tumor front (ITF), and the expression of CD133 was higher in ITF compared with normal tissue and the tumor cells. Moreover, the expression level of α-SMA was positively correlated with CD133 expression level. Together, our results suggest that activation of YAP in CRC plays an important role in the promotion of cancer stem cell properties by extracellular matrix stiffness in CRC.
1 INTRODUCTION
Colorectal cancer (CRC) is one of the most common gastrointestinal malignancies. Although patients with CRC receive comprehensive treatment, recurrence, and metastasis are still the key factors leading to the failure of treatment.1 The tumor microenvironment, as a key element in the regulation of cancer stem cells (CSC), regulates intracellular signaling pathways by transmitting its own molecular, physical, and chemical signals to tumor cells.2 Studies have shown that extracellular matrix (ECM) stiffness is part of the physical microenvironment of tumor cells. The extracellular physical signals are transformed into intracellular biological signals through the “extracellular matrix-cell membrane receptor-intracellular molecule” pathway, also called the “mechanical-biological” signal transduction pathway, and this transformation plays an important role in screening and maintaining the CSC phenotype.3 It has been proven that the integrin family acts as a switch, and Yes-associated protein (YAP) is a key molecule in this pathway.4
Previous studies have claimed that stiffness of CRC tumor tissue is higher than peritumor and normal tissue (NT).5 CRC tumor cells can not only recruit cancer-associated fibroblasts (CAFs), but also secrete and activate lysyl oxidase, enhancing deposition of collagen fibers, cross-linking, and shrinking to increase matrix stiffness. As a result, increases in matrix stiffness enhance CRC cell proliferation through the FAK/SRC signaling pathway.6 Barbier and colleagues introduced a magnetic simulation around normal intestinal epithelial cells to mimic ECM stiffness, and found that increasing the magnetic force can promote β-catenin migration into the nucleus through integrin-dependent pathway, which promotes malignant transformation and proliferation of epithelial cells.7 At the same time, researchers found that high stiffness of the cell culture matrix can not only promote the invasion and metastasis of tumor cells,8 but also induce the expression of CSC biomarkers in solid cancers.9 However, the pathway through which ECM stiffness regulates CRC stem cell remains unclear. Therefore, exploration of the regulatory pathway affecting the CSC and its mechanism may provide new ideas for the prevention and treatment of CRC.
We aimed to use cell matrix with different levels of stiffness to culture CRC cells and observe the effects on the expression of CSC biomarkers and YAP activation. Gene editing techniques and inhibitor molecule were also used to study the role of integrin, FAK, and YAP in the pathway.
2 MATERIALS AND METHODS
2.1 Polyacrylamide gels
Polyacrylamide gels of different stiffness were prepared on glass coverslips by applying a modification of the method initially reported by Pelham and Wang.10 In brief, fresh glass coverslips were activated by dipping them in 0.1 M NaOH and air drying. A small aliquot of 3-aminopropyltrimethoxysilane was spread across each coverslip, and the coverslips were extensively washed in distilled water and then soaked in 0.5% glutaraldehyde in phosphate buffered saline (PBS) and then washed twice in distilled water for 10 minutes to produce a coating of aldehyde functional groups. The coverslips were then coated in a thin layer of gel containing a mixture of 3% to 10% acrylamide and 0.01%-0.3% bis-acrylamide, which produced gels of 2.0, 5.0, 12.0, 16.0, and 20.0 kPa stiffness.11 Polyacrylamide gel polymerization was promoted by the addition of 10% ammonium persulfate (1/100 volume) and TEMED (3/1000 volume). Coverslips were washed in PBS on a rocker for 20 minutes and then sterilized in fresh PBS for 30 minutes with ultraviolet light. A total of 50 µL of heterobifunctional sulphosuccinimidyl 6-(4′-azido-2′-nitrophe-nylamino) hexanoate was added and photoactivated for 5 minutes with ultraviolet light. After washing with PBS, coverslips were coated with 10 μL/mL fibronectin solution for 1.5 hours and washed before cell seeding. Gels were soaked in serum-free culture media for 24 hours before usage.
2.2 Cell culture and antibodies
The human CRC cell line HCT-116 (ATCC Cat# CCL-247, RRID:CVCL_0291), LS174T(ATCC Cat# CL-188, RRID:CVCL_1384), RKO (ATCC Cat# CRL-2577, RRID:CVCL_0504), and SW480 (ATCC Cat# CCL-228, RRID:CVCL_0546) was purchased from the Cell Centre of Xiang Ya Medicine College of the Central South University. The cell line was cultured in 1640 (Biological Industries, the Northern Kibbutz Beit Haemek, Israel) at 37°C in humidified air with 5% CO2. All media were supplemented with 10% fetal bovine serum (Biological Industries, Israel). Cells were harvested for next experiment after 48 hours plated and confluence reach about 70%. The HCT-116 cells were preincubated with an antibody against integrin β1 (50 μg/mL, Abcam, ab24693) and control IgG immunoglobulin for 2 hours to block the integrin β1 subtype.12 Subsequently, the cells were seeded on the polyacrylamide gels to assess the changes in function and molecules. The chemical FAK inhibitor PF573228 (Selleck, S2013) was solubilized in dimethyl sulfoxide and used for cell experiments at a concentration of 1 µM.13
2.3 Real-time qRT-PCR
Total RNA was extracted from cells and tissues using TRIzol Reagent (TAKARA, Japan), and equal amounts of RNA were used for real-time quantitative polymerase chain reaction (qRT-PCR) analysis (TAKARA, Japan) according to the manufacturer's instructions. β-actin was used as an internal control. The following are the sequences of the primers: β-actin, forward primer, 5′-GCACCACACCTTCTACAATGAGC-3′, reverse primer, 5′-GGATAGCACAGCCTGGATAGCAAC-3′; ALDH1, forward primer, 5′-GTTGTCAAACCAGCAGAGCA-3′, reverse primer, 5′-CTGTAGGCCCATAACCAGGA-3′; Lgr5, forward primer, 5′-CTTCCAACCTCAGCGTCTTC-3′, reverse primer, 5′-TTTCCCGCAAGACGTAACTC-3′; CD133, forward primer, 5′-GGACCCATTGGCATTCTC-3′, reverse primer, 5′-CAGGACACAGCATAGAATAATC-3′; CD44, forward primer, 5′-GGCTTTCAATAGCACCTTGC-3′, reverse primer, 5′-ACACCCCTGTGTTGTTTGCT-3′; connective tissue growth factor (CTGF), forward primer, 5′-ACCGACTGGAAGACACGTTTG-3′, reverse primer, 5′-CCAGGTCAGCTTCGCAAGG-3′; and Ankyrin repeat domain 1 (ANKRD1), forward primer, 5′-CGTGGAGGAAACCTGGATGTT-3′, reverse primer, 5′-GTGCTGAGCAACTTATCTCGG-3′; and YAP, forward primer, 5′-AGGAGAGACTGCGGTTGAAA-3′, reverse primer, 5′-CCCAGGAGAAGACACTGCAT-3′. The 2−ΔΔCT method was used to calculate the relative abundance of RNA for each gene compared with β-actin expression. Each reaction was performed in triplicate.
2.4 Immunoblotting and antibodies
Total protein was isolated from HCT-116 cells using a total protein extraction kit (Beyotime, China). An inhibitor was added when required during extraction of protein. A nuclear and cytoplasmic extraction kit was applied for protein extraction from these compartments separately (ComWin Biotech, China). Approximately 40-μg samples of the cell lysate were separated by SDS-PAGE and transferred onto a PVDF membrane. Immunoblot analyses were performed using the following primary antibodies: anti-CD133 (1:600, 18470-1-AP, Proteintech), anti-ALDH-1 (1:800, 18470-1-AP, Proteintech), anti-Lgr-5 (1:1000, ab75732, Abcam), anti-β-actin (1:1000, Cat #4970, CST), anti-Lamin B (1:1000, AF5161, Affbiotech, China), anti-phospho-YAP S127 (1:800, ab 76252, Abcam), anti-YAP (1:25000, ab 52771, Abcam), anti-p-PI3K (1:800, Cat #4228, CST), anti-PI3K (1:800, Cat #13666, CST), anti-AKT (10176-2-AP, Proteintech), anti-pAKT ser473 (Cat #9271, CST) and anti-Lamin A/C (Cat 10298-1-AP, Proteintech). The anti-rabbit IgG secondary antibodies were obtained from Vazyme (China). The proteins were visualized using an ECL detection kit (Bio-Rad).
2.5 Immunofluorescence
Samples were fixed with 4% paraformaldehyde for 15 minutes and then permeabilized with 0.1% Triton X-100 for 10 minutes. After washing with PBS three times, the samples were blocked with normal goat serum (Invitrogen Life Technologies) for 30 minutes to prevent nonspecific binding and then were incubated with the indicated antibodies for CD133(1:100), Lamin A/C(1:200), and YAP(1:500) at 4°C overnight and. The cells were stained with DAPI (4,6-diamidino-2-phenylindole) to visualize the nuclei, and the images were acquired with a fluorescence microscope.
2.6 Transient transfection of small interfering RNA
Cells were seeded in 24-well plates at a density of 1.5 × 10⁵ cells/mL and allowed to reach approximately 50% confluence before transfection. Cells were transfected with 100 nmol/L of each small interfering RNA (siRNA) duplex for 6 hours using Lipofectamine 2000 reagent (Invitrogen, Carlsbad, CA) following the manufacturer's protocol. The scrambled control RNA (siScr) and siYAP were purchased from Guangzhou RiboBio (Guangzhou, China).
2.7 Colony formation assay
Cells were seeded at a density of 500 cells per 6-well plate (Corning) in triplicate and cultured for 14 days. During colony growth, the culture medium was replaced every 3 days. Colonies with more than 50 cells were counted. The cells were counted under a light microscope.
2.8 Sphere formation assay
Cells were cultured in plates with noncoated dishes in serum-free medium containing 5 μg/mL insulin, 0.4% bovine serum albumin, 10 ng/mL basic fibroblast growth factor, and 20 ng/mL human recombinant epidermal growth factor for seven days. For passaging primary spheres (day 10) were treated with 0.05% trypsin/0.02% EDTA and dissociated into single cells, after which the cells were added to 24-well culture plates at a density of 1 × 10⁴ cells/mL in serum-free medium. The cells were cultured for a further 10 days in serum-free medium to obtain secondary spheres. The spheres in the suspension cultures were counted on a widefield light microscope.
2.9 Patient and samples
These tissues were removed by surgery from 97 patients with CRC at Xiangya Hospital of Central South University between 2009 and 2015. The samples were embedded in paraffin for staining. The histomorphology of all tissues was confirmed by pathologists. The invasive tumor front (ITF) was defined as the deepest region in a given histological section.14 The normal mucosa was excised 5 cm away from the tumor and confirmed to have an absence of tumor cells. All procedures of this study were approved by the Medical Ethics Committee of XiangYa Hospital, and all patients provided written informed consent. All procedures were in compliance with the ethical guidelines of XiangYa Hospital. Tumor stage was classified according to the 7th edition of the AJCC TNM staging system for CRC.
2.10 Masson's trichrome and immunohistochemistry
Collagen fibers were stained using the Masson's trichrome protocol. Immunohistochemical staining was performed on the 4-µm paraffin-embedded sections to detect α-SMA and CD133. The following primary antibodies were utilized: anti-α-SMA (1:1200, Abcam) and anti-CD133 (1:200, 18470-1-AP, Proteintech). Briefly, the sections were scored using a Foutier scale according to the percentage of positive cells and staining intensity: (−), tissue specimens without staining or weak staining (0%–25%), and (+), tissue specimens with moderate staining or strong staining ( ≥ 25%).15 Quantitative analysis of collagen fibers16: under a microscope, the collagen fibers were blue-green. For each specimen 5 (×400) visual fields were randomly selected for photography. Using Image-ProPlus 6.0 image processing software, an analysis of each visual field of the percentage of collagen fiber area and the average value of all values accumulated was performed.
2.11 Scanning electron microscope
The specimens from three patients were selected randomly for scanning electron microscope (SEM) to investigate the morphology of the collagen. The specimens were fixed for 24 hours at 4°C in SEM fixation buffer and then were washed in SEM buffer for 30 minutes. For secondary fixation, 4 hours in osmium tetroxide and a series of ethanol washes were performed. The specimens were rinsed in acetone, transferred to a critical point chamber and dried with acetone and CO2. The dried specimens were transferred to the sputter coater, and their surfaces were coated with gold for the final analysis using a JSM-7500F electron microscope (Hitachi s-3400N, Japan).
2.12 Statistical analysis
Statistical analysis of differences in the expression level of collagen fibers of paired tissues was analyzed by paired t tests. The association between target protein expression and clinicopathological factors was estimated by a the chi-square test. The statistical differences among ≥ 2 groups were analyzed with one-way analysis of variance followed by post hoc pairwise comparisons. The correlation between the α-SMA and CD133 expression levels was determined by Spearman's correlation analysis. All data values are expressed as means ± SEM. The P < 0.05 was considered statistically significant. The statistical software programs used were Prism Graphpad 7.0 (Graph Pad Software Inc., La Jolla, CA) and SPSS 13.0 for Windows (SPSS Inc., Chicago, IL).
3 RESULTS
3.1 Matrix stiffness regulated the stemness of HCT-116 cells
To investigate the influence of matrix stiffness on the stemness of the CRC cancer cell line HCT-116, we seeded cells on collagen-coated polyacrylamide gel with a stiffness ranging from 2 kPa (soft) to 20 kPa (stiff). Meanwhile, the expression level of CD133 mRNA of CRC cell lines with different genetic backgrounds was detected. The result showed that stiffness could increase the CD133 expression of SW480, but had the more milder effect on LS174T and RKO cell line as shown in Supporting Information S-Figure-2. To determine whether matrix stiffness regulates stem-cell-associated genes and proteins, we measured a panel of stem cell markers including CD133, ALDH-1, and Lgr-5 using real-time PCR and Western blots (Figure 1A,B). HCT-116 cells cultured on the gel were associated with an increased expression of stem-cell-associated genes and proteins compared with a higher stiffness matrix. We further performed immunofluorescence analyses for the stem cell marker CD133 in HCT-116 cells cultured on various stiffness gels. Figure 1C demonstrates upregulation of the CSC marker CD133 in HCT-116 cultured on increasing levels of stiffness gels. These results suggested that matrix stiffness induces stemness markers in HCT-116 cells.
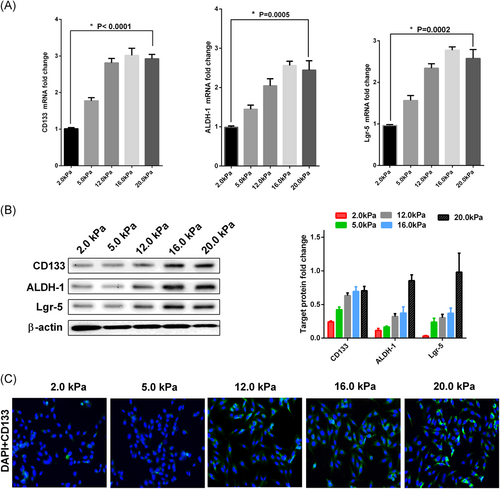
Higher matrix stiffness enhances the stemness markers of HCT-116 cells. The HCT-116 cells were plated on the matrix with various stiffness for three days. The values represent mean ± SD. Experiments have been repeated three times. A, Increasing matrix stiffness enhances the mRNA expression level of CSC markers CD133, ALDH-1, and Lgr-5 in HCT-116 cells. Expression levels were normalized to those of β-actin (2−ΔΔCT); B, Higher matrix stiffness remarkably upregulates the protein expression level of CSC markers CD133, ALDH-1, and Lgr-5 in HCT-116 cells. Densitometry values for these markers were normalized to β-actin; C, Immunofluorescence demonstrated that CD133 expression level increased with the rise of matrix stiffness. The cells were probed with CD133 (green) and overlaid with nuclear DAPI stain (blue) and images were captured with a fluorescence microscope at ×200 magnification. CSC, cancer stem cells; mRNA, messenger RNA
3.2 Matrix stiffness regulated YAP activation in HCT-116 cells
Initial studies have shown that YAP dephosphorylation in the coupled pathway is an important molecular event of matrix stiffness regulating CSC. Therefore, we detected the expression level of YAP and phosphorylated YAP. The results showed that with the increase in matrix stiffness, the YAP mRNA levels tended to increase (Figure 2A), while the phosphorylated level of YAP protein decreased gradually (Figure 2B) and the ratio of YAP protein phosphorylation to total YAP protein also decreased gradually (Figure 2C).
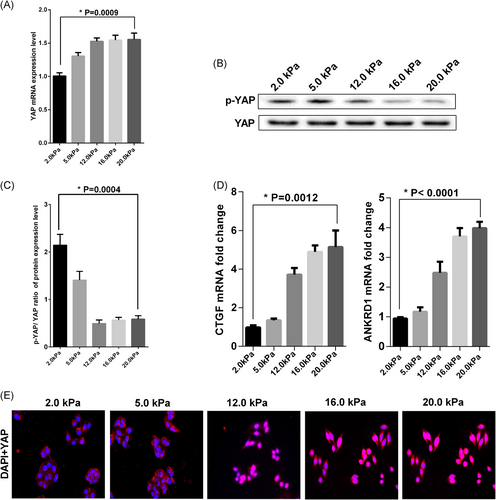
Matrix stiffness promoted YAP dephosphorylation and transferred into the nucleus. The HCT-116 cells were plated on a matrix with distinct stiffness for three days. The values represent mean ± SD. Experiments have been repeated three times. A, YAP mRNA level was detected by qRT-PCR. Expression levels were normalized to those of β-actin (2−ΔΔCT); B, Western blot analysis was used to analysis p-YAP and YAP protein expression level. The p-YAP represents phosphorylation of YAP; C, The densitometry values ratio of p-YAP to YAP was calculated; D, The mRNA expression level of YAP target genes CTGF and ANKRD1 were analyzed by qRT-PCR. Expression levels were normalized to those of β-actin (2−ΔΔCT); E, Immunofluorescence was applied to detected the YAP protein subcellular localization. The cells were probed with YAP (red) and overlaid with nuclear DAPI stain (blue) and images were captured with a fluorescence microscope at ×200 magnification. mRNA, messenger RNA; qRT-PCR, real-time quantitative polymerase chain reaction; YAP, Yes-associated protein
To further test the relationship between the activation level of YAP and matrix stiffness, we used real-time PCR to investigate the expression level of two target genes regulated by YAP, namely CTGF and ANKRD1, and the expression of these two genes increased as the matrix stiffness increased (Figure 2D). Regulation of subcellular localization of YAP by ECM stiffness is thought to be involved in the regulation of YAP activation. We examined whether ECM stiffness affected the subcellular localization of YAP in HCT-116 cells. YAP was mainly localized in the nucleus when cells were seeded on a rigid ECM. This phenomenon was markedly opposite to that observed in HCT-116 cells seeded in soft ECM (Figure 2E). Thus, these findings suggest that YAP sublocalization was regulated by ECM stiffness. Simultaneously, according to the results of our experiments that stiff culture medium increased expression levels and nuclear localization of Lamin A/C in Supporting Information S-Figure-3.
3.3 YAP activation plays a crucial role in the regulation of HCT-116 cell stemness by matrix stiffness
To further demonstrate the role of YAP activation in matrix stiffness regulation of HCT-116 cell stemness, we chose 2.0 kPa and 20.0 kPa as the soft and stiff matrix for the next experiment.17, 18 The efficacy of YAP knockdown was confirmed by real-time PCR analyses in the HCT-116 cell line (Figure 3A). At the same time, Western blot analysis was applied to detect the expression levels of nuclear YAP (dephosphorylated status) and cytosolic YAP (phosphorylated status) in these cells (Figure 3B). We observed proliferation and self-renewal ability of HCT-116 cells by colony formation and sphere formation, respectively. In the clone sphere assay, YAP knockdown resulted in a significant reduction of clone formation number in HCT-116 cells cultured on 20.0 kPa matrix, but the reduction of clone formation number was not obvious in cells cultured on 2.0 kPa matrix (Figure 3C). As shown in Figure 3D, cells transfected with SiYAP resulted in more small and less secondary spheres than cells with SiScr on the 20.0 kPa matrix, but the ability of secondary spheres from cells transfected with SiYAP did not show an apparent change compared with cells transfected with SiScr cultured on 2.0 kPa matrix. Finally, we detected the expression levels of CRC stem cell markers in the four groups by Western blot. The results showed that knockdown of YAP could significantly reduce the expression level of stem cell markers in 20.0 kPa culture medium, but the expression of CSC markers was not significantly decreased after YAP was knocked down in 2.0 kPa medium (Figure 4A,B).
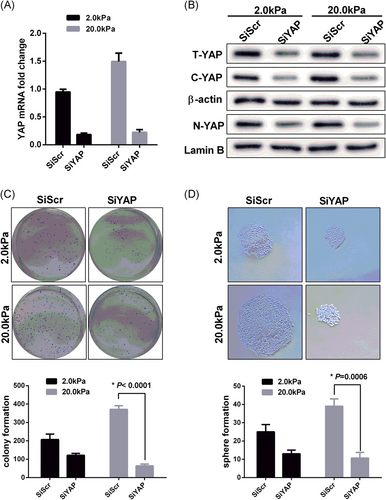
Matrix stiffness-mediated effects on stemness characteristics through accelerated YAP nuclear localization. We chose 2.0 kPa and 20.0 kPa represented soft and stiff matrix respectively. The HCT-116 cells were plated on the matrix for three days. The values represent mean ± SD. Experiments have been repeated three times. The SiSrc and SiYAP represented empty vector and knockdown group respectively. A,B, Inhibition of YAP expression level in HCT-116 cells was testified by qRT-PCR and Western blot analysis. The T-YAP, C-YAP, and N-YAP represented total YAP, cytoplasmic YAP, and nuclear YAP respectively. The β-actin and Lamin B as internal reference; C, The colony formation was significantly repressed by SiYAP in HCT-116 cells cultured with 20.0 kPa matrix; D, The secondary spheres of HCT-116 cells with a diameter > 100 μm were counted, Sphere numbers were standardized as sphere number/104 cells originally cultured in each sphere period. Original magnification ×200. qRT-PCR, real-time quantitative polymerase chain reaction; YAP, Yes-associated protein
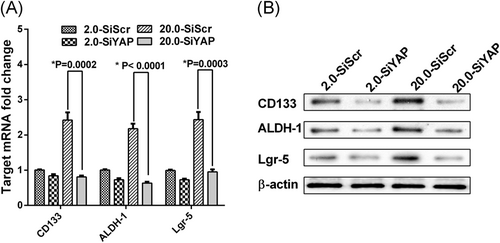
Knockdown of YAP could reduce the expression level of CSC markers. The HCT-116 cells were plated on the matrix for three days. The values represent mean ± SD. Experiments have been repeated three times. A, The mRNA levels of CSC markers in each group of HCT-116 cells were detected by qRT-PCR. Expression levels were normalized to those of β-actin (2−ΔΔCT); B, Western blot showing CSC markers expression level in each group of HCT-116 cells. CSC, cancer stem cells; qRT-PCR, real-time quantitative polymerase chain reaction; YAP, Yes-associated protein
3.4 Integrin β1/FAK was essential in the matrix stiffness regulation of CSC
Previous studies have demonstrated that integrin acts as a switch in the signaling pathway of ECM stiffness regulating CRC cell biological behavior, and FAK is an important regulator of downstream signaling pathway activation.6, 19 Integrin β1/FAK has been reported as a mechano-biological coupling pathway in regulating CSC in some solid tumors.20 However, its role in regulating colorectal cancer CSC is unclear. In this study, anti-integrin antibodies and a FAK inhibitor were used to block the coupling pathway to observe the expression level of CSC markers and to detect the activation levels of YAP and molecules in the integrin β1/FAK downstream signaling pathway. The results showed that the expression levels of the stem cell markers CD133, ALDH-1, and Lgr-5 mRNA, and protein were significantly decreased with the use of the anti-integrin β1 antibody and FAK inhibitor on stiff matrix. Nevertheless, the expression level of CSC markers was not significantly in 2.0 kPa medium (Figure 5A,B).
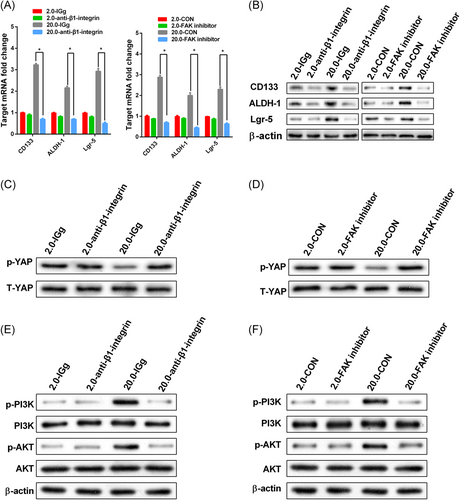
Integrin β1/FAK signaling mediated matrix stiffness regulating stemness. HCT-116 cells with or without anti-β1-integrin blocking antibody and FAK inhibitor were cultured on matrix with 2.0 kPa and 20.0 kPa for three days. The values represent mean ± SD. Experiments have been repeated three times. IGg and CON represented control groups respectively. A,B, The expression of CSC markers in the treated HCT-116 cells with an antibody anti-β1-integrin blocking and FAK inhibitor was suppressed as compared with the corresponding controls. *P < 0.05; C,D, Inhibition of T-YAP and p-YAP protein expression level in HCT-116 cells with an antibody anti-β1-integrin blocking and FAK inhibitor were examined by Western blot analysis; E,F, Moreover, the phosphorylation levels of PI3K and AKT were also all downregulated with anti-β1-integrin blocking and FAK inhibitor. The β-actin as the internal reference. CSC, cancer stem cells; YAP, Yes-associated protein
We found that dephosphorylation of YAP plays an important role in the regulation of CSC on stiff matrix. Our results showed that anti-integrin β1 antibody and FAK inhibitor could significantly increase the amount of phosphorylated YAP protein on the stiff matrix (Figure 5C,D). To elucidate the potential downstream signaling pathway through which integrin β1/FAK promotes CSC in different stiff culture media, the downstream phosphorylation of PI3K and AKT in CRC cells was detected by Western blot. Here, we found that using anti-integrin antibodies and FAK inhibitor dramatically decreased phosphorylation of PI3K and AKT compared with control cell lines in the stiff culture medium, but there was no such trend in soft culture medium (Figure 5E,F). In conclusion, we infer that the integrin β1/FAK/YAP pathway is essential in the regulation of CSCs via ECM matrix stiffness.
3.5 Collagen was abundant in the CRC IFT and correlated with CD133 expression
Previous studies have shown that tumor cells can recruit and activate normal fibroblasts into CAF,21 and CAF can promote the deposition, remodeling, and cross-linking of collagen, which increases the ECM stiffness of the tumor.22 We aimed to explore the collagen deposition in CRC tumor tissues. Collagen deposition and morphology of paired NT, ITF, and tumor center (TC) were detected by Masson staining and scanning electron microscopy (SEM) in 97 patients with CRC. The average amount of collagen deposition in NT, ITF, and TC was 12.59 ± 2.585, 17.71 ± 3.630, and 13.35 ± 2.935, respectively (Figure 6A,B; Supporting Information S-Figure-1). The amount of collagen deposition in TNM stage III was higher than that in TNM stage I/II, and the collagen deposition in the intestinal obstruction group was higher than that in the absence of obstruction group (Figure 6C,D). The results of SEM showed that collagen fibers of NT were coarse bundles, arranged regularly, and the cracks were large; collagen fibers of ITF were uneven in thickness, arranged in compact and disordered, and the cracks were small; collagen fibers of TC were coarse, arranged irregularly, and the cracks were large. The CAF marker α-SMA and CSC marker CD133 in different regions were stained with IHC, and then the correlation between the two proteins’ expression levels and clinicopathological characters were analyzed (Table 1). The staining of α-SMA and CD133 was strongest in ITF (Figure 6A; Supporting Information S-Figure-1). The level of α-SMA expression was significantly correlated with the depth of invasion and intestinal obstruction status. The correlation between α-SMA expression and lymph node status came close to achieving statistical significance. CD133 expression was significantly correlated with depth of invasion and lymph node involvement. The correlation between CD133 expression and intestinal obstruction status was also close to statistical significance. In addition, the expression level of CD133 was positively correlated with the expression level of α-SMA (Table 2, Figure 6E). Based on these findings, we can conclude that collagen deposition was abundant in ITF and correlated with the CSC marker expression level.
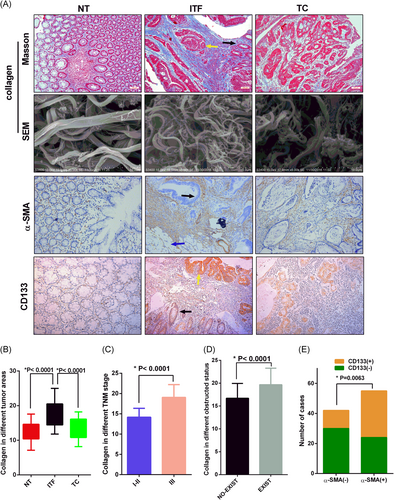
The expression and correlation of collagen, α-SMA, and CD133 in CRC. Scanning and staining different regions of CRC tissues from the clinical specimen. NT, ITF, and TC represented the normal tissue, invasion tumor front, and tumor center, respectively. The cancer tissues (yellow arrows) and normal epithelial tissues (black arrows) or serosal surface (blue arrows) were visible in the same section. A, The first line represented collagen stained by Masson. The second line represented SEM image of collagen bundles wrapping around the cell in multiple cells and directions (bar = 10 μm). The third and fourth line represented Immunohistochemical detection of α-SMA and CD133 expression in different regions of CRC tissues. Magnifications: The first, third, and fourth line x100, scale bar, 100 μm; B, Quantitative analysis of collagen expression in different regions of CRC. The values represent mean ± SD. Experiments have been repeated three times; C, The TNM III stage CRC tissues had stronger staining of collagen than TNM I and II stage CRC tissues; D, There was stronger collagen staining in obstructive CRC tissues; E, The CD133 expression level was positively correlated with α- SMA expression level. CRC, colorectal cancer; SEM, scanning electron microscope
| Clinicopathological features | α-SMA expression | CD133 expression | ||||||
|---|---|---|---|---|---|---|---|---|
| n | Low (n = 43) | High (n = 54) | P value | Low (n = 54) | High (n = 43) | P value | ||
| Age (y) | < 60 | 46 | 23 | 23 | 0.312 | 26 | 20 | 1.000 |
| ≥ 60 | 51 | 20 | 31 | 28 | 23 | |||
| Gender | Male | 57 | 25 | 32 | 1.000 | 23 | 17 | 0.837 |
| Female | 40 | 18 | 22 | 31 | 26 | |||
| Tumor location | Left colon | 28 | 15 | 13 | 0.506 | 16 | 12 | 0.356 |
| Right colon | 27 | 11 | 16 | 12 | 15 | |||
| Rectum | 42 | 17 | 25 | 26 | 16 | |||
| Tumor differentiation | G1 | 61 | 24 | 37 | 0.425 | 33 | 28 | 0.921 |
| G2 | 24 | 13 | 11 | 14 | 10 | |||
| G3 | 12 | 6 | 6 | 7 | 5 | |||
| Gross morphology | Infiltrate | 9 | 1 | 8 | 0.103 | 4 | 5 | 0.483 |
| Ulcer | 32 | 16 | 16 | 16 | 16 | |||
| Upheaval | 56 | 26 | 30 | 34 | 22 | |||
| Depth of invasion | T1-T2 | 12 | 9 | 3 | 0.030* | 10 | 2 | 0.006* |
| T3-T4 | 85 | 34 | 51 | 44 | 41 | |||
| Lymph node | N0 | 26 | 16 | 10 | 0.064 | 19 | 7 | 0.041* |
| N1-N2 | 71 | 27 | 44 | 35 | 36 | |||
| Intestinal obstruction | NO | 63 | 34 | 29 | 0.011* | 40 | 23 | 0.053 |
| YES | 34 | 9 | 25 | 14 | 20 | |||
| CEA | < 5 ng/mL | 72 | 30 | 42 | 0.484 | 42 | 30 | 0.484 |
| ≥ 5 ng/mL | 25 | 13 | 12 | 12 | 13 | |||
| Tumor embolus | NO | 50 | 18 | 32 | 0.105 | 27 | 23 | 0.838 |
| YES | 47 | 25 | 22 | 27 | 20 | |||
- P < 0.05 was considered statistically significant. The P values of the chi-square test. CRC, colorectal cancer.
| CD133(%) | ||||
|---|---|---|---|---|
| (−) | (+) | r | P value | |
| α-SMA | 11.002 | 0.001 | ||
| (−) | 32 (33.0%) | 11 (11.3%) | ||
| (+) | 22 (22.7%) | 32 (33.0%) | ||
- CRC, colorectal cancer.
4 DISCUSSION
In the process of embryonic development and normal tissue repair, the mechanical stiffness of the cell growth microenvironment promotes the directional differentiation of stem cells and plays an important role in maintaining the integrity of organ function. The tumor microenvironment factors, such as hypoxia, inflammation, and therapeutic drugs,23 promote deposition of collagen and remodeling of ECM, which could increase the stiffness of ECM. The stiff ECM modulates stemness, epithelial-mesenchymal transition, drug resistance, and immune tolerance of tumor cells by mechanical-biological signal transduction.21 Biophysical cues in the tumor microenvironment are considered to be key and novel regulators of CSC maintenance and tumorigenic potential. In breast cancer cells3 and hepatocellular carcinoma cells,20 increasing the matrix stiffness of tumor cells can upregulate the expression of CSC biomarkers and self-renewal ability. We cultured the CRC cell line HCT-116 in a stiffness gradient of culture matrix and found that the mRNA and protein levels of the CSC biomarkers increased with the increased stiffness of culture matrix.
According to the literature, collagen deposition is an important cause of the formation of ECM stiffness,24 and CRC with intestinal obstruction is a high risk for the recurrence of stage II patients with CRC. In our study, collagen deposition and morphology in clinical specimens were examined. It was found that the deposition of collagen fibers was most abundant and compact in ITF. Also, the amount of collagen deposition correlated with tumor stage and intestinal obstruction. In this case, we hypothesize that collagen deposition is an important tumor-promoting factor. Collagen deposition and colonization and activation of CAF are closely related.25 We found that the expression levels of α-SMA and CAF markers in collagen-rich IFT were significantly higher than in the lower collagen deposition environments of NT and TC. Further analysis showed that the expression of the CSC marker CD133 was positively correlated with the expression level of α-SMA. The in vitro cell experiment results were indirectly verified from clinical specimens. Therefore, we can conclude that the high stiffness microenvironment can promote CSC properties, but the underlying mechanism remains to be further studied.
Studies have shown that YAP is a key molecule in regulating and maintaining CRC cancer stem cell properties,26 and YAP is mainly regulated by the tumor suppressor LATS1/2 and others. YAP enters the nucleus after dephosphorylation and then interacts with TEAD1-4 and other transcription factors. Dephosphorylation of YAP is a key step in the regulation of tumor cell biological behavior by ECM stiffness,27 but the role of this signal transduction step in regulating the CRC properties remains unclear. Our results showed that the increase in stiffness can increase both the expression of total YAP protein and dephosphorylated YAP, which was the lowest in high stiffness culture matrix, indicating that ECM stiffness can promote YAP dephosphorylation and its entry into the nucleus. We also found that high stiffness culture substrate can upregulate mRNA expression of CTGF and ANKRD1, indicating activation of YAP. These results are consistent with research on non-small-cell lung cancer from Yuan et al.28 Meanwhile, Matrix stiffness is thought to be transduced via cellular mechanotransduction promoted expression level, dephosphorylation, and nuclear localization of Lamin A/C and translocation of mechano-sensitive proteins YAP1.29 Our data indicated that the same molecular biological process existed in CRC cell lines also. These results indicate that ECM stiffness regulates YAP dephosphorylation and entry into the nucleus and is common in solid tumors. Inhibition of YAP in different stiffness culture substrates significantly suppressed the proliferation and self-renewal ability of CRC cells and the expression of CSC markers significantly decreased, which was most obvious in the highest stiffness culture substrate.
Based on our data, we conclude that ECM stiffness regulates the CRC stem cell phenotype by promoting the dephosphorylation of YAP, which further reveals the signal regulatory network of the mechanical microenvironment on CRC tumor stem cells. Cells sense mechanical inputs from the ECM through adhesion receptors, which trigger mechanotransductive signaling events and transmit these inputs to the cellular cytoskeleton. Engagement and clustering of integrins incudes formation of focal adhesions and related structures, which can modulate signaling through a variety of mechanotransductive and canonical mitogenic pathways, including through MAPK, PI3K, and the Rho GTPases.30 We used anti-integrin β1 antibody and FAK inhibitor to block the signal transduction of integrin/FAK and found that both of them can inhibit the expression of CSC markers and affect the dephosphorylation of YAP and its entry into the nucleus. Moreover, the phosphorylation levels of PI3K and Akt were also downregulated. These findings suggest that integrin β1 specifically transduces the stimulation signal from matrix stiffness into CRC cells and influences intracellular PI3K/AKT activation. To the best of our knowledge, this study is the first time to report that matrix stiffness modulates CSC marker expression in CRC cells via YAP dephosphorylation.
5 CONCLUSIONS
In summary, this study provides new insights into the mechanism by which matrix stiffness regulates stemness in CRC cells via dephosphorylation of YAP and the integrinβ1/FAK pathway. This study reveals the crucial role of matrix stiffness in mediating CRC stemness. Mechanotransductive signaling pathways within CSCs may represent promising new therapeutic targets. However, the generalizability of our findings is limited because of a lack of experiments in vivo and in 3D cell culture.
CONFLICTS OF INTEREST
The authors declare that there is no conflict of interest regarding the publication of this paper.
FUNDING
1, Contract grant sponsor: the Nature Scientific Foundation of China; Contract grant number: 81702956; 2, Contract grant sponsor: the Beijing CSCO Fund; Contract grant number: Y-MX2014-002; 3, Contract grant sponsor: The Strategy-Oriented Special Project of Central South University in China; Contract grant number: ZLXD2017003.


