Metabolic Suppression of a Drug-Resistant Subpopulation in Cancer Spheroid Cells
ABSTRACT
Inhibition of metabolic features which distinguish cancer cells from their non-malignant counterparts is a promising approach to cancer treatment. Energy support for drug extrusion in multidrug resistance (MDR) is a potential target for metabolic inhibition. Two major sources of ATP-based metabolic energy are partial (glycolysis) and complete (mitochondrial oxidative phosphorylation) oxidation of metabolic fuels. In cancer cells, the balance between them tends to be shifted toward glycolysis; this shift is considered to be characteristic of the cancer metabolic phenotype. Numerous earlier studies, conducted with cells cultured in a monolayer (2-D model), suggested inhibition of glycolytic ATP production as an efficient tool to suppress MDR in cancer cells. Yet, more recent work challenged the appropriateness of the 2-D model for such studies and suggested that a more clinically relevant approach would utilize a more advanced cellular model such as a 3-D model. Here, we show that the transition from the 2-D model (cultured monolayer) to a 3-D model (cultured spheroids) introduces essential changes into the concept of energetic suppression of MDR. The 3-D cell organization leads to the formation of a discrete cell subpopulation (not formed in the 2-D model) with elevated MDR transport capacity. This subpopulation has a specific metabolic phenotype (mixed glycolytic/oxidative MDR support) different from that of cells cultured in the 2-D model. Finally, the shift to the oxidative phenotype becomes greater when the spheroids are grown under conditions of lactic acidosis that are typical for solid tumors. The potential clinical significance of these findings is discussed. J. Cell. Biochem. 117: 59–65, 2016. © 2015 Wiley Periodicals, Inc.
Aberrant behavior of cancer cells is supported by their aberrant metabolism; therefore, targeting cancer metabolism is becoming an important tool in the tumor-treatment arsenal [Zhao et al., 2013]. In particular, targeting metabolism is considered a potential remedy for multidrug resistance (MDR)—the ATP-dependent efflux of a wide range of anticancer drugs, rendering the drugs harmless to the cell [Scatena et al., 2008]. Modulating metabolic processes to suppress MDR in cancer cells can thus improve the efficiency of cancer chemotherapy.
The significant energy dependence of MDR transport suggests that the cell's energy supply is a promising target to inhibit MDR. ATP, the main cell energy carrier, is produced in two pathways: partial oxidation (glycolysis) and/or complete oxidation (oxidative phosphorylation or OXPHOS for short) of metabolic fuels (Fig. 1). Cells relying predominantly on glycolysis or OXPHOS for energy production are said to have a glycolytic or oxidative phenotype, respectively. One of the fundamental hallmarks of cancer cells is a shift in the balance between these two energy-production pathways in favor of partial oxidation (i.e., from an oxidative to a glycolytic phenotype) [Gogvadze et al., 2010; Zhao et al., 2013]. For this reason, glycolytic inhibitors have attracted significant interest as potential agents for sensitization of cancer cells to chemotherapeutic treatment. Indeed, a large body of data obtained in different cancer types demonstrates efficient suppression of MDR by glycolytic inhibitors [Kaplan et al., 1990; Shoshan, 2013]. Typically, these data were obtained by studying 2-D cell models: cells grown in a classical monolayer. However, it is known that cells cultured in a monolayer are characterized by simplified phenotypic diversity and, therefore, are not representative of variations in MDR known to occur across tumor cell populations in vivo [Lee et al., 2007]. 3-D cell models appear to be more suitable for adequate elaboration of the metabolic influence on MDR in cancer cells [Kim et al., 2004].
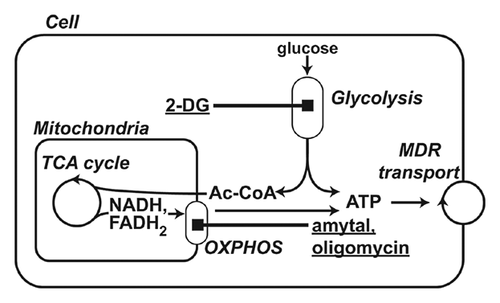
In this work, we examined breast cancer cells grown in 3-D spheroids for their MDR function and MDR susceptibility to metabolic inhibition. Human breast cancer cell line MCF-7 was used throughout this study as its bioenergetic metabolism has been well studied [Hall et al., 1999; Blanquer-Rossello et al., 2015; Otto et al., 2015]. Flow cytometric studies revealed a bimodal distribution of MDR capacity within spheroid-derived cells, while there was a unimodal distribution in cells grown in a monolayer. The 3-D environment promoted the formation of a cell subpopulation with a capacity for high drug efflux and distinctive bioenergetic dependency. We refer to these cells as “high drug efflux cancer cells” (HDECC), a term previously coined for such cells in high-content screens for MDR inhibitors [Xia et al., 2010; Xia and Wong, 2012]. In contrast to cells grown in 2-D, the HDECC MDR in spheroid cultures was dependent on both glycolytic and oxidative energy supplies. This dependence was further modulated by lactic acidosis, a condition typical in cancers. Acidosis made MDR more dependent on the oxidative type of energy. These data suggest that personalized chemotherapy regimens can be created that target energy support of MDR according to the heterogeneity and microenvironments within a particular tumor.
MATERIALS AND METHODS
CULTURING AND TREATING CELLS
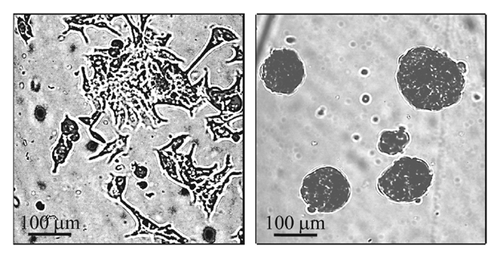
MCF-7 human breast cancer cells were purchased from the American Type Culture Collection (ATCC, Manassas, VA) and grown in monolayers as recommended by ATCC. The 3-D culture was based on protocols designed for generation of small cell spheroids [Olea et al., 1992; Chandrasekaran et al., 2012; Ho et al., 2012]. Briefly, cells grown in a monolayer where harvested and seeded into 6-well plates coated with 1% (w/v) agar (3 × 10⁵ cells/well) and cultured for 2 days in MammoCult basal medium with supplements (cat # 05621 and 05622, STEMCELL Technologies, Inc., Vancouver, BC, Canada). For single cell assays and experimental treatments spheroids were dissociated to single cells using a trypsin/EDTA mixture. Typical images of monolayers and spheroids are shown in Fig. 2.
FLOW-CYTOMETRY ANALYSIS OF MDR ACTIVITY
Overall, MDR transport activity was estimated by assaying accumulation of a general MDR probe, mitoxantrone (a fluorescent dye) in the presence or absence of a general MDR inhibitor cyclosporine A; both the dye and the inhibitor recognize all major types of ATP-binding cassette (ABC) transporters [Lebedeva et al., 2011]. Cells were loaded with mitoxantrone (5 μM, Sigma–Aldrich, St. Louis, MO) for 30 min at 37°C in the presence or absence of cyclosporine A (5 μM CsA, Sigma–Aldrich) and washed twice at 4°C. KRB buffer (115 mM NaCl, 5.9 mM KCl, 2.5 mM CaCl2, 1.2 mM MgCl2, 1.2 mM NaH2PO4, 15 mM NaHCO3, 10 mM glucose, pH 7.3) was used for loading, washes, and assays. The intracellular dye content was measured by flow cytometry using a BD FACSCanto II flow cytometer (BD Biosciences, San Jose, CA) with 635 nm excitation and 670 nm long pass (FL3) emission filters. Fluorescence of unstained cells was within the first log decade, and dead cells were excluded by propidium iodide staining.
FLOW-CYTOMETRY COMBINED ANALYSIS OF MDR ACTIVITY AND EXPRESSION
Mechanisms of MDR heterogeneity found in spheroids were explored to a greater depth using the combined assay of MDR activity and MDR transporter expression [Chaudhary and Roninson, 1991; Chaudhary et al., 1992; Leith et al., 1995]. For this, after dye loading, the cells were washed and resuspended in ice-cold PBS containing 0.1% BSA. To prevent alteration of mitoxantrone content, further manipulations were performed at 4°C. In our [Koshkin et al., 2013] and others' [Kars et al., 2006; Zhang et al., 2009] previous studies, it was found that intrinsic MDR in MCF-7 cells is supported by the MRP1 transporter. Therefore, loaded cells were incubated for 60 min with an antibody for the extracellular domain of MRP1 (IU2H10 1:100 50 μg/mL, Novus Biologicals, Littleton, CO) [Binyamin et al., 2004; Chen et al., 2014]. Fluorescence labeling of the transporter was achieved by addition of the secondary antibody, FITC-labeled anti mouse IgG (R1253F from Acris Antibodies, San Diego, CA), according to manufacturer's instructions. Dye accumulation and expression of the MRP1 transporter were measured with FL3 and FL1 channels of the flow cytometer and displayed as bivariate plots of [dye] versus [transporter].
METABOLIC INTERVENTIONS IN DRUG-TRANSPORTING CELLS
Metabolic interventions were performed by the application of glycolytic inhibitor 2-deoxyglucose (10 mM) and/or mitochondrial ATP synthesis inhibitor, oligomycin (2 μM) and a pharmacological agent, amytal (1 mM) for 6 h. Lactic acidosis was created by the application of growth medium containing 10 mM lactate at pH 6.8 for 12 h. The loading concentration of mitoxantrone was doubled in this case to compensate for the reduced drug uptake.
CELL VIABILITY ASSAY
Cell viability was determined using a standard colorimetric MTT (3-4,5-dimethylthiazol-2-yl-2, 5-diphenyl-tetrazolium bromide) assay. As previously described [Koshkin et al., 2013], cells were seeded at 104 cells/well in 96-well plates and grown for 48 h at 37°C, with or without cytotoxic agent, then supplemented with MTT (0.5 mg/mL) and incubated for 4 h. Redox activity in viable cells converted the oxidized form of MTT into the reduced formazan form. Formazan crystals were released from cells and dissolved using SDS (3% final content). Redox activity/cell viability was estimated from formazan absorbance measured at 550 nm and expressed as percentage of absorbance relative to cells untreated with cytotoxic agent.
RESULTS
FORMATION OF THE HDECC SUBPOPULATION
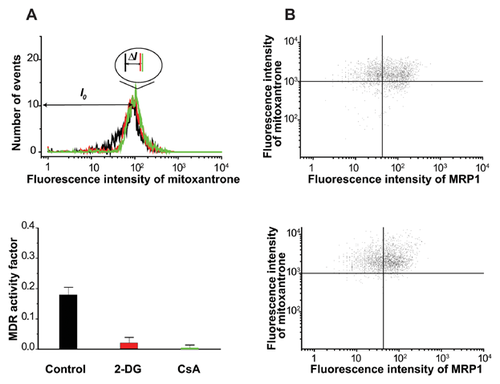
The influence of 3-D organization of breast cancer cells on the distribution of MDR transport activity within cell populations is evident from Figures 3 and 4. Cells grown in monolayer or spheroid culture conditions were stained with mitoxantrone in the presence or absence of cyclosporine. The distribution of mitoxantrone fluorescence was then assessed using flow cytometry. Monolayer-derived cells demonstrate a unimodal distribution of mitoxantrone content both in the MDR-active (mitoxantrone alone) and MDR-blocked (mitoxantrone plus cyclosporine A) state (Fig. 3A). Unimodality of monolayer cells is confirmed by a uniform response of the entire population on MDR blocking observed in a combined activity/expression assay (Fig. 3B). A normalized difference between mean dye fluorescence intensity in MDR-active and MDR-blocked states ((I0–IMDR)/I0) was taken as a quantitative measure of MDR (MDR activity factor [Sarkadi, 2001; Lebedeva et al., 2011]). It was at a moderate level of 0.15–0.20 which is quite typical for intrinsic (not induced) MDR in cancer cells [Sarkadi, 2001]. In contrast, cells derived from spheroids showed a bimodal distribution, which converted into a unimodal one upon addition of an MDR inhibitor (Fig. 4A, top panel). The mechanism of MDR heterogeneity in spheroid cells was tested to a greater depth by using a parallel MDR activity/transporter expression approach. The parallel measurement of mitoxantrone content and expression of transporter MRP1 showed that low dye content is associated with the elevated expression of MRP1 (Fig. 4B).
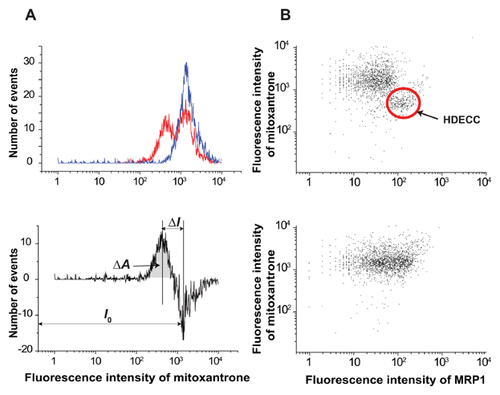
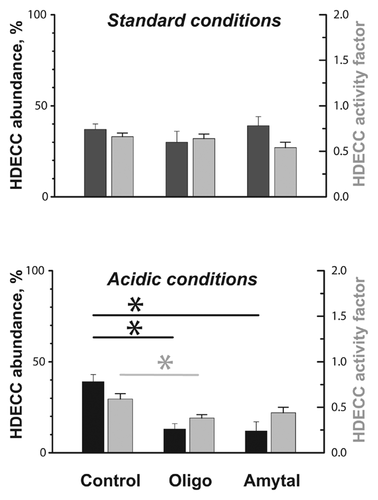
Cells with low dye content (left peak) can be designated as HDECC. The HDECC subpopulation can be characterized comprehensively by its abundance and MDR activity factor determined by the “differential histogram” technique (bimodal histogram of MDR-active sample minus unimodal histogram of MDR blocked sample). As illustrated in the bottom part of Fig. 4A the histogram subtraction procedure produced a differential histogram showing adjacent positive (left, low mitoxantrone content) and negative (right, high mitoxantrone content) peaks. The peaks reflect the rise in the HDECC subpopulation (low drug content, positive peak) cells with the corresponding drop in the main subpopulation (negative peak), caused by the functioning of MDR transporters. The abundance of HDECC was determined from the area of the positive peak (very close to that of the negative one), while the intensity of drug efflux was estimated by the normalized difference between mean fluorescence intensities of the two peaks (both parameters are presented in Fig. 6).
ENERGY DEPENDENCE AND SUPPRESSION OF HDECC
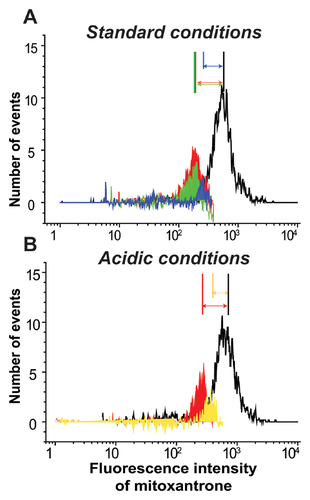
The efficiency of glycolytic inhibitors in overcoming drug efflux was reported in multiple 2-D-grown cancer cell types [Kaplan et al., 1990; Maschek et al., 2004], including the MCF-7 breast cancer cell line used in the present work [Wu et al., 2014]. Therefore, we compared effects of glycolytic inhibition on MDR in 2-D and 3-D cell culture systems. In our experiments, application of glycolytic inhibitor 2-deoxyglucose to monolayer cells caused dramatic suppression of mitoxantrone efflux in monolayer cells (Fig. 3A, red trace and red vertical marker in inset), but had only a moderate effect on the abundance (peak area) of the HDECC subpopulation in spheroid cells (Fig. 5A, green histogram and vertical marker). The combination of glycolytic (2-deoxyglucose, 2-DG) and OXPHOS (oligomycin) inhibitors, however, brings about a major reduction of the HDECC subpopulation accompanied by the decreased intensity of the dye efflux (Fig. 5A, blue histogram and vertical marker). Oligomycin alone had insignificant effects on drug efflux in the spheroid (Fig. 6A) and monolayer (data not shown) cells. The need for combined OXPHOS and glycolytic inhibition for suppression of HDECC subpopulation is in line with the known ability of many cancer cell species to exploit both glycolytic and oxidative energy sources [Jose et al., 2011].
LACTIC ACIDOSIS MODULATED ENERGY DEPENDENCE AND SUPPRESSION OF HIGH DRUG EFFLUX CELLS
To put metabolic inhibition of the HDECC subpopulation into a more clinical perspective, we tested its efficiency under conditions mimicking the intratumoral microenvironment. A characteristic feature of many tumors is lowered pH in the interstitial space, caused by enhancement of glycolysis (and thus production of lactic acid) as well as H+ export, that is typical in cancer cells [Peppicelli et al., 2014]. Therefore, we examined the effect of bioenergetic inhibitors on the HDECC subpopulation under conditions of lactic acidosis. We found that the acidic environment strengthens the OXPHOS dependency of HDECC, so that OXPHOS inhibition suppresses the HDECC subpopulation as efficiently as the combination of OXPHOS and glycolytic inhibitors at standard pH (Fig. 5B, red and yellow histograms and vertical markers). This observation agrees with the recently discovered metabolic shift characteristic for acid-exposed cancer cells, the central part of which is the prevalence of oxidative ATP production in the cellular energy balance [Lamonte et al., 2013].
These observations are of immediate interest from a clinical point of view. Toxic effects of 2-DG as well as other glycolytic inhibitors are well known [Dwarakanath et al., 2009; Ehrke et al., 2015; Qian et al., 2014; Raez et al., 2013]; therefore, introduction of these agents only into specific patients' treatment protocols would allow clinicians to avoid unnecessary side effects and optimize chemotherapeutic regimens.
USE OF A VITAL OXPHOS INHIBITOR FOR SUPPRESSION OF THE HDECC SUBPOPULATION
With respect to the clinical potential of mitochondrial inhibition, oligomycin itself is a highly toxic antibiotic with limited clinical use [Samuels et al., 2014]. Thus, we were interested in testing more tolerable mitochondrial modulators capable of exploiting the high bioenergetic vulnerability of cancer cells in an acidic environment. From mitochondrial targeting agents currently used in clinical practice we chose amytal, commonly applied as a sedative and anti-ischemic agent [Chen et al., 2006]. Amytal is known to supress OXPHOS ATP synthesis through inhibition of complex I in the mitochondrial respiratory chain [Slater, 1967]. When applied to spheroid cells, amytal had a minor effect on the HDECC subpopulation under standard conditions, but under acidic stress it caused significant reduction in HDECC abundance and tended to lower the efficiency of dye efflux (Fig. 6). Importantly, amytal at the concentration applied did not compromise cell viability in a longer time scale (data not shown), which is in line with its known properties [Smith et al., 1959].
DISCUSSION
The present study revealed that advancing from 2-D to 3-D cancer cell models causes significant modifications of MDR in cancer cells. The first modification is the formation of separate subpopulation of cells with elevated MDR capacity (HDECC). The second modification is the strengthening of energetic support for drug extrusion in these cells which rely on energy supply from both glycolysis and OXPHOS. The third feature is a modulation of energetic support of MDR in HDECC by extracellular pH. Specifically, lactic acidosis observed in many tumors makes drug extrusion in HDECC mainly dependent on OXPHOS energy. Clinical significance of these findings stems from the emerging importance of metabolic approach to cancer treatment.
In recent years, new cancer treatment strategies that target the metabolism of cancer cells have emerged [Zhao et al., 2013]. In particular, inhibitors of glycolysis attracted attention as potential anti-MDR agents due to the frequently observed glycolytic phenotype of cancer cells [Kaplan et al., 1990; Shoshan, 2013]. At the same time, our data suggest that specific targeting of highly drug-resistant cells (HDECC) may require inhibition of OXPHOS energetic support of MDR. Importantly, our experiments with the vital OXPHOS inhibitor, amytal, demonstrate the feasibility of clinically relevant metabolic suppression of the HDECC subpopulatin of breast cancer cells.
- Acidic modulation of MDR energy dependence reported here may have a clinical perspective. pH in the interstitial space is characterized by high intra- and inter-tumoral heterogeneity, in particular, pronounced acidosis is typical for metastatic tumors. Recent data suggest a correlation between the acidity of a primary tumor and its metastatic potential [Estrella et al., 2013]. Therefore, techniques for examination of intratumoral pH have gained clinical importance and are rapidly progressing. The lactic-acidosis-induced enforcement of metabolic HDECC suppression reported here can help to optimize chemotherapy according to the tumor acidity.
- Intrinsic origin of the HDECC subpopulation makes it a model of basal MDR which is less understood than induced/transduced MDR [Monti, 2006]. Our data show that an intrinsic HDECC subpopulation can be efficiently suppressed by limiting the metabolic energy supply. This suggests a benefit of the incorporation of bioenergetic inhibition into first line chemotherapeutic regimens, along with its modulation according to tumor acidity.
- Potential biomarker application of MDR parameters is associated with the fact that metabolic features of cancer cells are becoming important functional biomarkers [Ramanujan, 2014]. Phenotypic and functional biomarkers provide the basis for classification of cancers into subtypes with different prognoses and responses to treatment, which are required for the development of personalized therapy [Kelloff and Sigman, 2012]. Reported here, features of HDECC suggest that metabolic characterization of MDR may form a part of cancer metabolic profiles.
The significance of MDR capacity and its energy dependence as a clinically important biomarker is being extended with the growing knowledge of tumorigenic mechanisms. In recent years, multiple reports have demonstrated reversibility within cancer cell hierarchies [Chaffer et al., 2011; He et al., 2011]. Specifically, besides classical unidirectional conversion of tumor-initiating cells into bulk differentiated tumor cells, the reverse transformation of bulk tumor cells into tumor-initiating cells can occur spontaneously. This fact increases the importance of identifying HDECC. Such cells are able to survive chemotherapeutic treatment and, even if they did not show properties of tumor-initiating cells at the time of therapy, they can acquire them afterwards. Indeed, chemotherapy may apply selection pressure for such events.
CONCLUSIONS
The 3-D cell growth environment promotes the formation of an HDECC subpopulation of breast cancer cells with bioenergetic dependence different from that of monolayer cells. These cells depart from the typical glycolytic dependence of MDR and require the combined application of glycolytic and respiratory inhibitors for efficient suppression of the HDECC subpopulation. Lactic acidosis causes further shift of HDECC bioenergetic dependence to the oxidative phenotype. As a result, a vital OXPHOS inhibitor alone is able to cause a major suppression of the HDECC subpopulation under these conditions.
Overall, our data help to understand the discrepancy between the pre-clinical success of glycolytic suppression of MDR and poor results in clinical trials [Dwarakanath et al., 2009]. They suggest that MDR-based cell subtyping combined with appropriate metabolic interventions can help to choose a necessary and sufficient chemotherapy with minimal side effects.


