Caveolin-1 Mediates Inflammatory Breast Cancer Cell Invasion via the Akt1 Pathway and RhoC GTPase
ABSTRACT
With a propensity to invade the dermal lymphatic vessels of the skin overlying the breast and readily metastasize, inflammatory breast cancer (IBC) is arguably the deadliest form of breast cancer. We previously reported that caveolin-1 is overexpressed in IBC and that RhoC GTPase is a metastatic switch responsible for the invasive phenotype. RhoC-driven invasion requires phosphorylation by Akt1. Using a reliable IBC cell line we set out to determine if caveolin-1 expression affects RhoC-mediated IBC invasion. Caveolin-1 was down regulated by introduction of siRNA or a caveolin scaffolding domain. The ability of the cells to invade was tested and the status of Akt1 and RhoC GTPase examined. IBC cell invasion is significantly decreased when caveolin-1 is down regulated. Activation of Akt1 is decreased when caveolin-1 is down regulated, leading to decreased phosphorylation of RhoC GTPase. Thus, we report here that caveolin-1 overexpression mediates IBC cell invasion through activation Akt1, which phosphorylates RhoC GTPase. J. Cell. Biochem. 116: 923–933, 2015. © 2015 Wiley Periodicals, Inc.
Abbreviations
-
- IBC
-
- inflammatory breast cancer
-
- IDC
-
- intraductal cancer
-
- NB
-
- normal breast
-
- HMEC
-
- human mammary epithelial cell
-
- Cav1
-
- caveolin-1
-
- CSD
-
- caveolin scaffolding domain
-
- MβCD
-
- methyl-β-
-
- siRNA
-
- small inhibitor RNA
Inflammatory breast cancer (IBC) is arguably the most aggressive and deadly form of locally advanced breast cancer (Woodward and Cristofanilli, 2009). One distinctive feature of IBC is the presence of tumor emboli in the dermal lymphatic vessels of the skin overlying the breast (Woodward and Cristofanilli, 2009), thus nearly all patients have axillary lymph node involvement and ∼1/3 have gross distant metastasis (Woodward and Cristofanilli, 2009).
Our laboratory has demonstrated that caveolin-1 and -2 (Cav1 and Cav2) are over expressed in IBC (Van den Eynden et al., 2005). Caveolins are suggested as potential novel targets for anti-metastatic therapy (van Golen, 2006). Cav1 is a plasma membrane-associated protein typically located in invaginated cholesterol-rich lipid rafts called caveolae (Rothberg et al., 1992). Cav1 has a hairpin-like structure with both amino and carboxy terminal end and a domain termed the caveolin scaffolding domain (CSD) facing the cytoplasm (Rothberg et al., 1992). The CSD interacts with a variety of signaling molecules such as G-protein coupled receptors, small GTPases and growth factor receptors and regulates a variety of signaling pathways (Pol et al., 2000; Jang et al., 2001; Lin et al., 2005; van Golen, 2006).
RhoC GTPase is a small GTP-binding protein that dynamically controls nearly all aspects of cellular motility (Kjoller and Hall, 1999; Ridley, 2001; Sahai and Marshall, 2002), drives invasion and metastasis of several cancers including IBC (Suwa et al., 1998; Clark et al., 2000; van Golen et al., 2000; Yao et al., 2006; Hall et al., 2008;). RhoC shares 91% identity on the protein level with RhoA GTPase but is functionally distinct (Ridley, 2001; Etienne-Manneville and Hall, 2002; Wheeler and Ridley, 2004). Studies show that the Ras and Rho proteins contain a putative caveolin-binding domain that allows the GTPase to interact with Cav1 via the CSD (Song et al., 1996; Gingras et al., 1998; Lin et al., 2005). Introduction of a soluble CSD domain interferes with the interaction of Cav1 with proteins that have a putative CSD. In pancreatic cancer cells, we demonstrate that interaction of Cav-1 with RhoC GTPase results in decreased tumor cell invasion. In contrast, loss of Cav1 expression results in increased RhoC GTPase activation and p38 MAPK-mediated invasion of pancreatic cancer cells (Lin et al., 2005).
In the current study, we set out to determine if IBC cell invasion is affected by Cav1 expression, specifically the interaction of Cav1 with RhoC GTPase. Here, we show that depletion of Cav1 or introduction of a CSD leads to a significant decrease in Akt1 activation and a subsequent decrease in RhoC GTPase phosphorylation and IBC cell invasion.
MATERIALS AND METHODS
CELL CULTURE AND TREATMENTS
All cell lines were verified for authenticity by the Johns Hopkins Genetics Resource Core Facility. Cell lines were propagated under defined, well-maintained culture conditions optimal for growth (Ethier et al., 1996). The SUM149 IBC cell line is grown in Ham's F12 medium (Mediatech, Inc., Manassas, VA) supplemented with 5% Fetal bovine serum (Atlanta Biologicals, Lawrenceville, GA), 1% Penicillin/Streptomycin (Mediatech, Inc.), antibiotic/antimycotic (Mediatech, Inc.), Hydrocortisone (Invitrogen, Carlsbad, CA), l-glutamine (Mediatech, Inc.), and an insulin/transferring/selenium cocktail (Gibco, Carlsbad, CA) as previously described (van Golen et al., 2000; Van den Eynden et al., 2005; Lehman et al., 2012). Briefly, E6/E7 immortalized human mammary epithelial cells (HMECs) are grown in 5% FBS (Life Technologies, Gaithersburg, MD)- supplemented Ham's F12 medium (Life Technologies) containing insulin, hydrocortisone, epidermal growth factor and cholera toxin (Sigma Chemical, Co., St. Louis, MO) as previously described (Van den Eynden et al., 2005). MDA-MB-435 cells (verified breast cancer; a gift from Dr. Janet Price) are grown in MEM medium (Mediatech) with 5% FBS (Atlanta Biologicals), 1% Penicillin/Streptomycin, l-glutamine, sodium pyruvate, and MEM non-essential amino acids (Mediatech). Mouse fibroblast NIH3T3 cells were purchased from ATCC and grown in DMEM medium (Mediatech) supplemented with 10% bovine calf serum (Atlanta Biologicals) and 1% Penicillin/Streptomycin (Mediatech). All cell lines were grown at 37°C in 95% air and 5% CO2.
SUM149 IBC cells were treated with 5 μM of control peptide or CSD peptide (GenScript, Piscataway, NJ) fused to the antennapedia internalization sequence (AP) for 6 h prior to invasion assay. CSD sequence (amino acids 82–101, DGIWKASFTTFTVTKYWFYR) was synthesized as a fusion peptide to the C terminus of the antennapedia (AP) internalization sequence (RQIKIWFQNRRMKWKK). The control peptide sequence was a scrambled version of the CSD. In a different set of experiments cells were treated with 5 mM methyl-β-cyclodextrin (MβCD) for 2 h at 37 °C in 95% air and 5% CO2 as previously described (Lin et al., 2005). For inhibition of Rho GTPases (RhoA, -B, and -C), cells were treated with C3 exoenzyme (Cytoskeleton, Inc., Denver, CO) as previously described (van Golen et al., 2000; Sequeira et al., 2008). For pharmacologic inhibition of Akt, cells were treated with either 10 μM of Akt Inhibitor II (Calbiochem, Gibbstown, NJ) or the phosphatidylinositol-3 kinase (PI-3K) inhibitor 10 μM LY294002 (Selleckchem, Houston, TX) for 24 h at 37°C as previously described (van Golen et al., 2002; Lehman et al., 2012).
IN VITRO TRANSFECTION EXPERIMENTS
For Cav1 depletion SUM149 IBC or MDA-MB-435 intraductal carcinoma cells were transfected with a SmartPool siRNA specific for Cav1 or a control siRNA targeted to bacterial LacZ (Santa Cruz Biotechnology, Inc., Santa Cruz, CA) using FuGeneHD transfection reagent (Roche, Branchburg, NJ). SUM149 were transfected with siRNA directed against either Akt1 or a siRNA control (Santa Cruz Biotechnology, Inc.) for 48 h using GeneSilencer siRNA transfection reagent (Genlantis, Inc., San Diego, CA, Lehman et al., 2012). Transfected cells were kept at 37°C in 5% CO2 for 48 h prior to their use in functional assays.
SUM149 IBC cells were transfected with plasmid DNA constructs of GFP tagged Cav1 as previously described (Lin et al., 2005) and RFP tagged RhoC (made in house). Transfected cells were kept at 37°C in 95% air and 5% CO2 for 24 h prior to confocal imaging.
SUM149 cells were transfected with RhoCS73A, RhoCS73D, RhoAS73D, or pcDNA6-His-LacZ using FuGeneHD transfection reagent (Roche). Transfection efficiency was 38–74% as determined by β-galactosidase staining of the LacZ-transfected cells after 16 h incubation at 37 °C with X-gal staining solution (20 mg/ml X-gal, 5 mM potassium ferricyanide, 5 mM potassium ferrocyanide, and 2 mM magnesium chloride-hexahydrate in 1× PBS, pH 7.4 (Life Technologies, Inc.). Transfected cells were allowed to incubate at 37°C for 48 h. RhoCS73D and RhoAS73D constructs were previously developed using the Quick Change Site-Directed Mutagenesis Kit (Stratagene, La Jolla, CA, Lehman et al., 2012).
MATRIGELTM INVASION ASSAY
Invasion assays were performed using a MatrigelTM Invasion Chamber (BD Biosciences, San Jose, CA) with 8 μ pore filters as previously described (Lehman et al., 2012). Briefly, 1.25 × 10⁵ cells in serum-free medium were added to rehydrated invasion chambers and allowed to migrate toward normal growth medium for 24 h at 37°C. The media was aspirated and inserts gently wiped with a cotton swab. Crystal violet was added into each insert for 30 min, washed with water and allowed to dry at RT for 16 h. Cells were counted in continuous (10×) magnification fields. Data are expressed as the percent invasion of the treated cells relative to the untreated control cells.
CELL VIABILITY ASSAY
SUM149 IBC cells were transfected with Cav1-specfic or control siRNA for 48 h as described above, harvested and seeded (500 cells/well) in triplicate in 96-well plates. One plate was seeded for each time points. Fresh MTT (3-(4, 5-dimethylthiazolyl-2)-2, 5-diphenyltetrazolium bromide) (Invitrogen) solution was prepared fresh for each trial experiment at a concentration of 5 mg/ml in phosphate buffered saline (PBS); 50 μl of MTT solution was added directly to the medium at the appropriate time point, incubated at 37°C for 3 h The media was aspirated and 100 μl of dimethyl sulfoxide (DMSO) added to each well to dissolve the formazan crystals and absorbance read at 562 nm. Data were represented as ratio of absorbance of Cav1 siRNA treated cells and control cells for each time point.
CELL PROLIFERATION ASSAY
SUM149 cells were plated on coverslips in 6-well plates and transfected with Cav1-specific siRNA or control siRNA for 48 h. At the end of transfection, cells were fixed with 4% paraformaldehyde and incubated with mouse anti-Ki-67 (Lifespan Biosciences, Seattle, WA) and DraqV (Cell Signaling Technology, Boston, MA) nuclear stain. For Ki-67 staining an AlexaFluor 555 goat anti-mouse IgG (Invitrogen Molecular Probes, Carlsbad, CA) secondary antibody was used. Immunofluorescence was performed on a Zeiss LSM5 High-speed Live confocal microscope housed in Delaware Biotechnology Institute. Cells were counted in four random non-overlapping areas per plate and data were expressed as ratio of Ki-67 expressing cells and DraqV expressing cells.
SUCROSE GRADIENT FRACTIONATION
SUM149 IBC cells and NIH3T3 cells were grown at 80% confluence, lysed in 2 ml of ice-cold 500 mM Na2CO3 followed by sonication. A total 4 ml of cell lysate was mixed with equal volume of 90% sucrose solution in MES buffered saline (25 mM MES, pH 6.5, 0.15 M NaCl). This mixture was placed in the bottom of an ultracentrifuge tube. This mixture was overlaid with 2 ml of 35 % and 5 % sucrose in MES buffered saline containing 250 mM Na2CO3. This assembly was centrifuged at 39,000 rpm for 18 h. Fractions (1 ml) were collected from top of the gradient and then subjected to TCA precipitation. Fractions were mixed with 1× Laemelli buffer containing 20 nM dithiothreitol, heat denatured for 5 min by boiling, separated by SDS–PAGE on Criterion pre-cast 4–20% Tris–HCl gels (BioRad, Hercules, CA) followed by immunoblotting.
IMMUNOPRECIPITATION AND IMMUNOBLOTTING
Proteins were harvested from cell cultures using RIPA buffer and 5 μl/ml protease inhibitor cocktail (Calbiochem) and/or phosphatase inhibitor (Thermo Scientific, Waltham, MA). Protein concentration was evaluated using a BCA Protein Assay kit (Pierce Scientific, Rockford, IL) at a wavelength of 562 nm. For immunoblot analysis, aliquots of 30 μg were mixed with Laemelli buffer. For immunoprecipitation, whole cell lysates (300 μg) were incubated on at 4°C with primary antibodies specific for RhoC GTPase (developed in house) (Lehman et al., 2013, 2012; Chatterjee and van Golen, 2011) or Akt1 (Cell Signaling, Beverly, MA). Antibody-bound proteins were incubated with Protein A/G PLUS-Agarose (Santa Cruz Biotechnology) or donkey anti-chicken IgY-agarose (Gallus Immunotech, Inc., Cary, NC) at 4°C for 3 h. Samples were washed 5× with PBS.
All protein samples were heat denatured, separated by SDS–PAGE on pre-cast 4–20% Tris–HCl gels (BioRad), transferred to nitrocellulose, blocked with 3% powdered milk (Nestle Carnation) in PBS with 0.05% Tween-20 (Sigma Chemical, Co.). For immunoblot analysis, immobilized proteins were probed using antibodies specific for total Akt1 (Cell Signaling) Cav1 (BD Transduction Laboratories, San Jose CA), and β-actin (Cell signaling), α-tubulin (Abcam, Cambridge, UK). Akt1 immunoprecipitates were incubated with a phospho-Akt (S473) antibody (Santa Cruz Biotechnology). RhoC GTPase immunoprecipitates were immunoblotted with a anti-phospho-Serine or anti- RhoGDIα (Cell Signaling). Protein bands were visualized by ECL (Millipore, Co., Billerica, MA) and intensities measured with ImageJ v1.46.
Rho GTPase ACTIVATION ASSAY
Levels of active RhoC GTPase were determined as previously described using a GST-Rho Binding Domain and detected using a chicken anti-RhoC developed by our laboratory (van Golen et al., 2000; Chatterjee and van Golen, 2011; Lucey et al., 2010).
TRANSMISSION ELECTRON MICROSCOPY
SUM149 IBC cells were grown on coverslips at 70–80% confluence. Cells were fixed using 4% paraformaldehyde in 0.1 M phosphate buffer for 1 h. Cells were washed and residual aldehyde groups were further removed by 0.1% NaBH4 in 0.1 M phosphate buffer. Cells were blocked in AURION Goat blocking solution (Electron Microscopy Sciences, Hatfield, PA) containing 0.05% saponin for 1 h. Specimens were then incubated overnight at 4°C in caveolin-1 antibody (BD Transduction Laboratories) in BSA-c (Electron Microscopy Sciences) containing 0.05% saponin followed by incubation in secondary antibody ultra small goat anti-rabbit gold conjugate reagent, 1:100 in BSA-containing 0.05% saponin for 3 h at RT. These labeled specimens were post-fixed in 2% glutaraldehyde in 0.1 M phosphate buffer for 30 min and then in 1% aqueous osmium tetroxide for 45 min. Samples were incubated in silver enhancement mixture for 30–40 min at RT followed by dehydration in ascending ETOH (25, 50, 75, 95, 100%) 15 min each. Samples were subjected to series of infiltrations using different ratios of Embed-812 resin and 100% anhydrous ETOH. Each filtration was carried out for 1 h in permanox dishes. Lastly samples were embedded in fresh resin and polymerized at 60°C for 48 h.
Samples were then sectioned and examined using Transmission Electron Microscope: Zeiss LIBRA 120 at Delaware Biotechnology Institute, Delaware.
RNA EXTRACTION, REVERSE TRANSCRIPTION, AND PCR ANALYSIS
Total RNA was harvested from cells using Trizol reagent (Invitrogen) and converted to cDNA using AMV-RT kit (Promega, Madison, WI) per the manufacturer's instructions. The caveolin-1 transcript was amplified using 10 μM concentration of Cav1 forward and reverse primers (Integrated DNA Technologies, Inc., Coralville, IA) in total 25 μl reaction volume as previously described (Lin et al., 2005). GAPDH was used as a loading control. PCR products were separated on 1% TAE agarose gel and visualized by ethidium bromide staining. Band intensities of ethidium bromide stained PCR products were measured with ImageJ v1.46. Band intensities were normalized to GAPDH for comparison purposes.
For quantitative (q)PCR, RNA was isolated from the cell lines using Trizol Reagent (Invitrogen) and cDNA was synthesized from the RNA using the Promega Reverse Transcription kit (Promega) per manufacturer's recommendations. Caveolin-1 and GAPDH primers (Integrated DNA Technologies, Inc.) were diluted to a final concentration of 10 μM. The cDNA synthesized from the isolated RNA was diluted to a final concentration of 4 ng/μl. Reactions were prepared as a bulk “master mix” using the ABI SYBR Green PCR Master Mix (Applied Biosystems Inc., Foster City, CA) for each target gene/primer pair used. A 5 μl aliquot of cDNA was pipetted into each well of the ABI 96-well plate, and 20 μl of the reaction master mix was added. Plates were covered with ABI adhesive cover, centrifuged at 1,000 rpm to mix the contents, and PCR performed on an ABI 7000 real-time qPCR machine housed in the Center for Translational Cancer Research (University of Delaware).
RhoGAP AND RhoGEF ACTIVITY ASSAYS
To determine RhoGAP activity, SUM149 IBC cells were plated in 6-well tissue culture dishes and allowed to reach 75% confluence. Cells were transfected using FuGeneHD transfection reagent with a scrambled control siRNA, Akt1-specific siRNA, RhoCS73A, or RhoCS73D plasmid. The Akt pharmacologic inhibitor was added directly to the cells. The untreated cells were used as a control. Treatments were allowed to incubate for 24–48 h and protein was harvested. Protein was harvested using RIPA buffer as previously described. The entire biochemical reaction was carried out in a 96-well tissue culture plate at room temperature. Twenty-five micrograms of each protein sample was added to 1× RhoGAP assay reaction buffer. An 800 μM GTP solution was added to each reaction mixture, the plate was shaken for 5 s, and the reaction was incubated at room temperature for 20 min. Immediately after the incubation, CytoPhos reagent (Cytoskeleton, Inc., Denver, CO) was added into each well and a green color was allowed to develop for approximately 6 min, indicating inorganic phosphate production. The absorbance of the plate was read at a wavelength of 650 nm. In addition to the protein samples of interest, control reactions included His-tagged RhoC GTPase protein only (Cytoskeleton, Inc.) or p50 RhoGAP, and reaction buffer only.
To determine RhoGEF activity, SUM149 IBC cells were plated in 6-well tissue culture dishes and allowed to reach 75% confluence. Cells were transfected as described above. Ten micromolar of Akt pharmacologic inhibitor was added directly to the cells. The untreated cells were used as a control. Treatments were allowed to incubate for 24–48 h and protein was harvested. Protein was harvested using RIPA buffer as previously described. The entire biochemical reaction was carried out in a black flat-bottom 96-well half plate at RT. Twenty-five micrograms of each protein sample was added to 2× exchange assay reaction buffer (Cytoskeleton, Inc.), which contains 1.5 μM mant-GTP (the florescent nucleotide analog N-methylanthraniloyl-GTP). Distilled water was added to adjust the volume to 90 μl in each well. The fluorescence of the reaction mixture immediately read (ex: 450 nm, em: 460 nm) for 150 s (five readings). After five readings, 10 μl of either GEF, hDbs protein (8 μM), or distilled water (intrinsic control) was added to in respective wells and immediately after pipette up and down twice, fluorescence was read (ex: 450 nm, em: 460 nm) for 30 min (60 readings). In addition to the protein samples of interest, control reactions included His-tagged RhoC GTPase protein only (Cytoskeleton, Inc.), hDbs-His protein, and reaction buffer only.
DATA ANALYSIS
In vitro data were analyzed using a GraphPad software package for Windows (Prism 4.0). A P ≤ 0.005 was considered statistically significant. Experiments were performed in at least triplicate with multiple replicates per experiments. Error bars represent standard deviation.
RESULTS
Our original Cav1 study did not include a comparison of normal breast with IBC and non-IBC. We began by extending our original observations comparing Cav1 expression levels in normal breast (NB), non-IBC intraductal carcinoma (IDC), and IBC from a publicly available database (www.oncomine.org). Figure 1A is Whisker plots for Cav1 expression compiled from multiple array analyses. Since NB, IDC, and IBC were not represented on single array, data from multiple arrays were analyzed. A significant decrease in Cav1 expression is observed in IDC as compared to NB. Cav1 expression is significantly higher in IBC versus IDC. Although it is not a direct comparison, a trend is suggested for Cav1 expression. Consistently, IDC is observed to have significantly lower expression than IBC, with reported loss of expression in many cases. Similar results are observed in those studies comparing NB with IDC. NB is found to have slightly, yet, significantly higher expression of Cav1 than IDC. Although the data from multiple array experiments are not directly comparable, a gradient trend of expression is suggested with Cav1 expression in IDC<NB<<IBC (Fig. 1A).
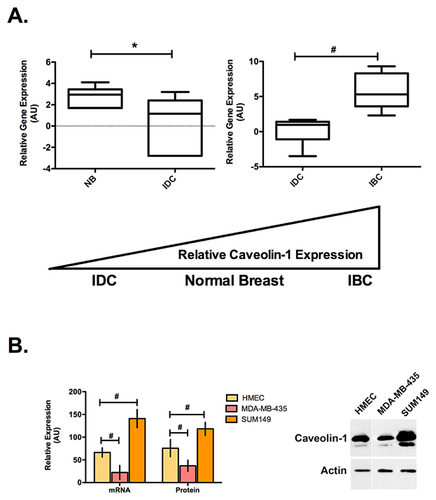
The trend of Cav1 expression observed in the patient samples was also observed in the cell lines on both the mRNA and protein level. Figure 1B is a comparison of Cav1 mRNA and protein expression in immortalized human epithelial cells (HMECs), the MDA-MB-435 IDC and the SUM149 IBC cell lines. Although the SUM149 IBC cell line was the only cell line tested in this study, it is reported to accurately mirror what is observed in patient tumors and has been successfully used to study IBC biology (Van Laere et al., 2013). Cav1 message levels were determined by qPCR and protein by immunoblotting. Cav1 expression is significantly lower in the MDA-MB-435 IDC cells compared with the HMECs, while the SUM149 IBC cells have significantly higher expression.
We next set out to determine where Cav1 localizes in IBC cells. Figure 2A is representative immunofluorescence staining images. Punctate Cav1 expression appears to be localized to both the plasma membrane and in the cytoplasm.
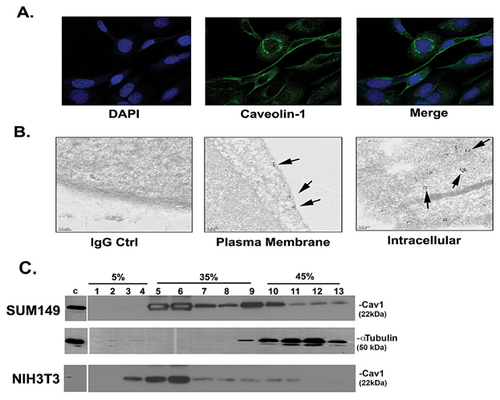
Cytoplasmic Cav1 expression was further examined by transmission electron microscopy (TEM). Figure 2B is representative sections of cells showing Cav1 along several vesicular bodies, potentially represent abundant caveosomes. At the plasma membrane, Cav1 appears to form clusters in caveolae.
We next fractionated the SUM149 IBC cells and as controls, NIH3T3 cells. The majority of Cav1 localized to fractions 5 onwards (Figure 2C), representing caveolae associated Cav1 expression at the plasma membrane.
Using SmartPool siRNA to deplete Cav1 levels in the SUM149 cells, we empirically determined the amount of siRNA used to approach levels comparable to the HMECs. Figure 3A is the results of a qPCR demonstrating an average twofold decrease in Cav1-specific siRNA transfected compared with untransfected control (−) SUM149 cells. Figure 3B is a representative Western blot with corresponding quantitation comparing untransfected (−), a non-specific siRNA control for bacterial LacZ and siRNA for Cav1 transfected SUM149 cells. Cav1 depletion results in an average 1.7-fold decrease in protein levels, which is comparable with the HMECs.
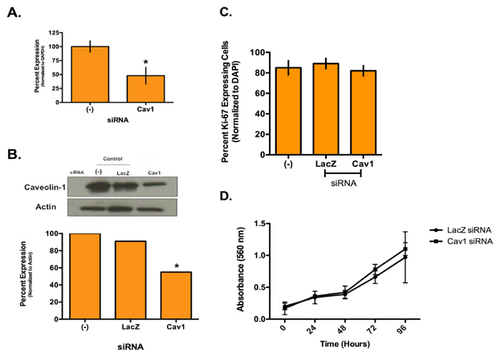
To determine if Cav1 expression affects IBC cell proliferation, we performed Ki-67 staining and an MTT assay (Fig. 3C,D). No difference in the number of proliferating cells after Cav1 depletion compared with controls was observed.
We next set out to determine if Cav1 depletion affected IBC invasion. Figure 4A is the results of Matrigel→ invasion assays performed after altering Cav1 levels in the SUM149 cells. Depletion of Cav1 siRNA leads to a significant 90% decrease in invasion. We also treated the IBC cells with methyl-β-cyclodextrin (MβCD), which chelates cholesterol thereby displacing Cav1. MβCD treatment is less efficient than siRNA depletion but still results in a significant 45% decrease in invasion. Lastly, use of a caveolin scaffolding domain (CSD) disrupts interactions of proteins with Cav1. Introduction of the CSD results in a significant 85% decrease in IBC cell invasion. Conversely, depletion of Cav1 in the IDC MDA-MB-435 cells lead to an approximate 25% increase in tumor cell invasion (Supplemental Fig. S1).
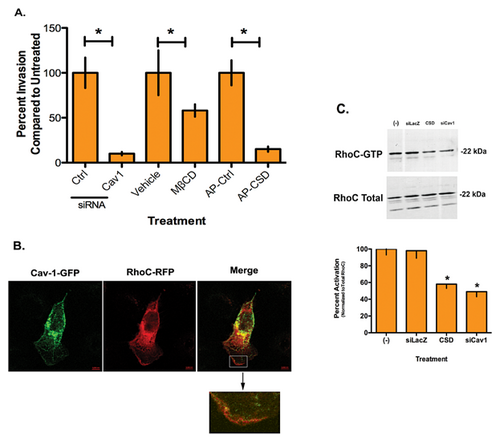
We previously demonstrated that RhoC GTPase is required to drive the IBC invasive phenotype and inhibition or depletion of RhoC leads to loss of the cells ability to invade (van Golen et al., 1999, 2000; Lehman et al., 2012). Our previous work in pancreatic cancer demonstrated that interactions between Cav1 and RhoC GTPase-regulated signaling and cell invasion (Lin et al., 2005). To determine if an interaction between Cav1 and RhoC GTPase mediates invasion of the SUM149 IBC cell line, we transfected the IBC cells with a Cav1-GFP and RhoC-RFP. Figure 4B is a representative image demonstrating apparent co-localization of the two proteins on the periphery of the cell, mostly at the leading edge of the lamellipodia. The inset shows detail of RhoC GTPase (red) expression, which appears to be co-localized with Cav1 (yellow) along the leading edge of the lamellipodia. Since immunofluorescence has limitations in actually determining co-localization of proteins, we performed immunoprecipitation experiments but were unable to confirm a direct physical interaction between RhoC GTPase and Cav1 by immunoprecipitation (Fig. 4B).
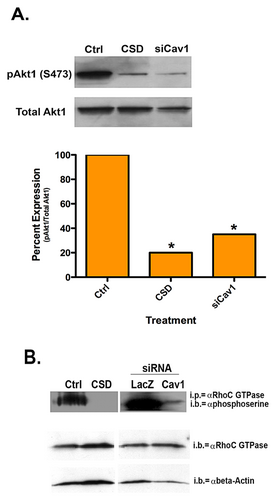
To determine whether Cav1 affects RhoC GTPase activity outside of a direct interaction between the two molecules, we performed a Rho activation assay. Figure 4C is representative activation assay with corresponding quantitation. RhoC GTPase is active in the control SUM149 cells. Introduction of CSD, which disrupts Cav1 function in general or Cav1 depletion with siRNA significantly decreased RhoC GTPase activity in the IBC cells by 42 and 48%, respectively, while total RhoC protein levels were not affected.
Although RhoC GTPase activity was significantly decreased, greater than 50% of RhoC activity remained. Thus, we questioned whether Cav1 could be affecting another functional aspect of RhoC GTPase. Previously, we demonstrated phosphorylation of RhoC GTPase by Akt1 was required for IBC cell motility (Lehman et al., 2012). Evidence suggests a role for Cav1 activation of the phosphatidylinositol 3-kinase (PI3K)/Akt pathway (Shack et al., 2003). Introduction of the CSD or depletion of Cav1 with siRNA led to a significant decrease in active phosphorylated Akt1 (Fig. 5A). RhoC GTPase has a putative Akt phosphorylation consensus sequence at serine 73 (Lehman et al., 2012). Previously, we observed that a decrease in active Akt1 led to a decrease in serine phosphorylation on RhoC GTPase and subsequently decreased IBC cell invasion (Lehman et al., 2012). Figure 5B demonstrates that introduction of the CSD or depletion of Cav1 leads to a significant decrease in serine phosphorylated RhoC GTPase.
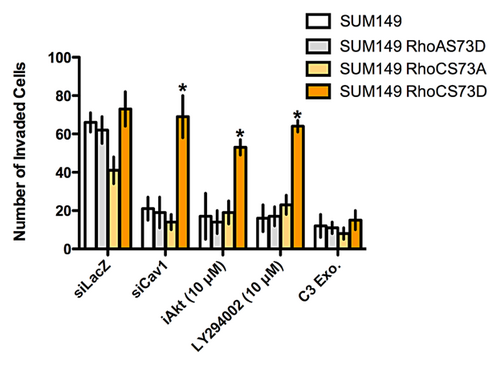
Finally, to demonstrate a direct link from Cav1 through the Akt1 pathway to RhoC GTPase, we transfected SUM149 cells with a RhoC serine 73 phosphomimetic mutant (RhoCS73D). As a control, we transfected IBC cells with an identical mutant of RhoA GTPase (RhoAS73D) and a RhoC mutant that cannot be phosphorylated at serine 73 (RhoCS73A). We then introduced a control siRNA, siRNA for Cav1 or treated the cells with pharmacologic inhibitors of Akt or the phosphatidylinositol-3 kinase (PI-3K) pathway. As shown in Figure 6, when parental SUM149 cells are transfected with siRNA to Cav1 or treated with pharmacologic inhibitors to either the PI-3K pathway or Akt, cell invasion is significantly reduced. Identical results are obtained when the IBC cells are transfected with RhoAS73D and RhoCS73A. In contrast, expression of RhoCS73D into the SUM149 cells rescues the invasive capabilities of the cells. As a control cells were treated with C3 exoenzyme, a potent inhibitor of RhoA, -B, and -C. Treatment of cells with C3 inhibited the invasive capabilities of the IBC cells. Phosphorylation of RhoC GTPase by Akt1 does not affect the interaction of RhoC with upstream effector proteins that control GTPase activity (Supplemental Fig. S2). Specifically, phosphorylation does not affect the interaction of RhoC with RhoGDIs (Supplemental Fig. S3). The exchange of GDP for GTP by RhoGEFs is also unaffected (Supplemental Fig. S4). Similarly, the rate of GTP hydrolysis by RhoC interacting with RhoGAPs is unaltered (Supplemental Fig. S5).
DISCUSSION
Inflammatory breast cancer (IBC) is a highly invasive and metastatic form of breast cancer that is phenotypically and molecularly distinct from other forms of breast cancer (Joglekar and van Golen, 2012). Expression and activation of RhoC GTPase is known to drive the invasive and metastatic phenotype of IBC cells (van Golen et al., 1999, 2000, 2002). Further, we demonstrated that RhoC is a substrate for Akt1 and phosphorylation of RhoC by Akt1 is required for IBC cell invasion (Lehman et al., 2012). Previously, we demonstrated a role for a direct interaction of RhoC GTPase with Cav1 in pancreatic cancer cells (Lin et al., 2005). A direct interaction of RhoC GTPase with Cav1 prevented pancreatic cancer cell invasion thus, loss of Cav1 during pancreatic cancer progression results in activation of RhoC and acquisition of an invasive phenotype.
IBC patient and tumor samples express high levels of Cav1 (Van den Eynden et al., 2006). The role of Cav1 in non-inflammatory breast cancers has been a matter of speculation for several years with evidence to suggest that Cav1 has roles as both a tumor and metastasis suppressor in breast and other cancers (Fiucci et al., 2002; Sloan et al., 2004; Williams et al., 2004). Recent evidence suggests that it is a breast tumor suppressor with a significant role in regulating estrogen signaling and proliferation (reviewed in Mercier and Lisanti [2012]). A role for Cav1 in the stroma of breast tumors, specifically in cancer-associated fibroblasts, is suggested (reviewed in Folgueira et al. [2013]). Increased expression of Cav1 in cancer-associated fibroblasts was associated with a decreased nodal involvement. Recent evidence demonstrates hypermethylation of the Cav1 promoter in breast cancer patient stromal cells correlates with nodal metastasis (Aleviszos et al., 2014). Differential methylation of regions that flank CpG islands (termed CpG shores) regulate Cav1 expression in non-IBC (Rao et al., 2013). We previously observed that the caveolin promoter was hypomethylated in IBC tumors and cells lines (Davies et al., 1998; Van den Eynden et al., 2006). Analysis of IBC patient samples suggest that increased Cav1 protein expression is primarily associated with basal-like breast cancers (Elsheikh et al., 2008). By its very nature, IBC is fast growing, highly invasive and by definition, metastatic. Thus, Cav1 likely would not act as a tumor or metastasis suppressor in IBC as suggested for non-inflammatory breast cancers, which is what is reflected in our survey of publicly available array data.
The SUM149 IBC cells express high levels of Cav1 relative to the MDA-MB-435 IDC (confirmed breast cancer cells) and immortalized human mammary epithelial cells. Although the SUM149 was the only IBC cell line tested, it has been used successfully in a number of studies of IBC biology. Further, similar what was observed in patient samples (Van den Eynden et al., 2006), Cav1 is expressed both at the membrane and in the cytoplasm of the IBC cells. To determine the role of Cav1 overexpression in IBC, we attempted to reduce Cav1 expression to a level similar to human mammary epithelial cells. We purposely did not attempt to decrease Cav1 expression to what is observed in IDC cells. Decreasing Cav1 levels did not affect IBC cell growth or increase apoptosis (data not shown). However, we did observe a significant decrease in the ability of IBC cells to invade across a Matrigel coated filter in response to a chemoattractant. The opposite effect was shown for the MDA-MB-435 IDC cells, which is consistent with previous reports (Williams et al., 2004).
Cav1 overexpression has a role in melanoma cell motility, invasion, and metastasis. Interestingly, melanoma and IBC share several phenotypic similarities such as lymphatic invasion forming intralymphatic emboli the propensity to form skin metastases and the requirement for RhoC GTPase to drive metastasis (Clark et al., 2000; Rose et al., 2011; Lehman et al., 2013). Melanoma metastasis is regulated by interaction of Cav1 with RhoC GTPase leading to the activation of downstream signaling cascades and integrin expression (Arapaia et al., 2012).
Cav1 is known to scaffold several different types proteins including G-protein coupled receptors, non-receptor tyrosine kinases and small GTPases such as RhoC and RhoA GTPases. Thus, introduction of a CSD interferes with Cav1 function by disrupting its interaction with a number of proteins. RhoC GTPase has 91% homology to RhoA GTPase, yet is functionally distinct. Both RhoC and RhoA GTPases have a common Cav1 binding motif (Lin et al., 2005; Gingras et al., 1998). Immunofluorescence data suggests co-localization of RhoC with Cav1 in IBC cells. However, we were unable to confirm a physical interaction between RhoC GTPase and Cav1 by immunoprecipitation suggesting an actual lack of physical interaction of RhoC GTPase with Cav1. The apparent co-localization of RhoC with Cav1 by immunofluorescence may have been due to the limitations of the technique, namely performing a two dimensional visualization of a three dimensional cell. Activation of RhoC was decreased by ∼40% with Cav1 depletion. SUM149 IBC cell migration and invasion is dependent upon RhoC signaling (van Golen et al., 1999, 2000, 2002). Our previous studies demonstrate that phosphorylation of serine 73 on RhoC GTPase by Akt1 is essential for IBC cell invasion (Lehman et al., 2012). Positive and negative regulation of PI-3K signaling by Cav1 is reported for different cell types (Shack et al., 2003; Matthews et al., 2008). Our data suggests that phosphorylation of RhoC does not alter the interaction of the GTPase with RhoGEFs, RhoGAPs, or GDIs, nor does it affect activity. Since serine 73 lies within the hinge region of RhoC GTPase, which is able to uniquely undergo two conformational changes (Dias and Cerione, 2007), we are currently determining if phosphorylation affects the interaction of RhoC with downstream effectors. The decrease in RhoC activity may be due to an indirect interaction of a RhoGEF or RhoGAP with Cav1 and RhoC GTPase since this was not observed when the PI- 3K pathway or Akt was inhibited.
Data from this study suggest that Cav1 expression in IBC cells affects the PI-3K pathway and Akt1 activation, which in turn leads to the phosphorylation of RhoC GTPase, mediating IBC cell invasion. These data furthers our understanding of the mechanisms underlying IBC migration and may also shed light on the current observation that women using cholesterol-lowering drugs have a better prognosis (Brewer et al., 2013). Cav1 is shown to potentiate Akt1 activation in growth factor stimulated prostate cancer cells and also through mechanotransduction in vascular smooth muscle cells (Sedding et al., 2005; Li et al., 2003). Cav1 could potentiate Akt1 activation in IBC cells by either sequestering and inactivating proteins involved in the inactivation of Akt1. Alternatively, high levels of Cav1 could lead to the assembly of signaling complexes to activate Akt1. Finally, as described in endothelial cells, cholesterol-lowering statins could lead to a decrease in Cav1 levels and subsequently decreased Akt1 activation and reduced metastasis (Brouet et al., 2001). The possible mechanisms of how overexpressed Cav1 affects Akt1 activation will be further discerned as the role of statins in IBC is studied.
ACKNOWLEDGEMENTS
The authors would like to thank Min Lin, M.D., Galina Radunsky, M.D., Kate Groh, M.D., and Jeff Caplan, Ph.D. for expert technical assistance. This work was supported in part by the Congressionally Directed Medical Research Program, Breast Cancer Research Program, DAMB-17-03-1-0728 (KLvG), W81WXH-06-1-00495 (KLvG), and W81XWH-08-1-0356 (KLvG). This study is communicated on behalf of the Inflammatory Breast Cancer International Consortium.


