Raf Kinase Inhibitory Protein Role in the Molecular Subtyping of Breast Cancer
ABSTRACT
In this study, we examined the association between the RKIP expression and the molecular subtypes of breast cancer. Microarray gene expression data of 2,333 human breast cancer from 26 different cohorts performed on Affymetrix U133A or U133Plus2 platforms were downloaded from Array Express and Gene Expression Omnibus and the molecular subtype of breast cancer for the samples was determined by single sample Gene Set Enrichment Analysis. Differences in recurrence-free survival (RFS) were tested using the Log-rank test in univariate analysis and displayed using Kaplan–Meier curves. Cox proportional-hazards model was used to calculate the hazard ratio using univariate and multivariate analysis. Loss or reduced RKIP expression was associated with reduced RFS in breast cancer using univariate and multivariate analyses, which was independent of lymph node (LN) metastasis status. Basal-like, Claudin-low, and Her-2-enriched tumors had significantly lower RKIP levels compared to other subclasses (P < 0.0001). Conversely, the Luminal subclass exhibited the highest expression levels of RKIP (P < 0.0001 for Luminal A and P = 0.0005 for Luminal B subtype), while in normal-like breast cancer subtype, RKIP expression was not informative. RKIP expression was prognostic in ER+ and ER− subgroups. RKIP expression had no significant prognostic power within Basal-like, Claudine-low, Luminal B, or Her-2-enriched breast cancer subtypes. However, its expression pinpointed excellent from intermediate-poor Luminal A survivors, in both ER+ (P = 0.035) and ER− (P = 0.012) subgroups, especially in LN negative breast cancers. In conclusion, RKIP expression adds significant value to the molecular subclassification of breast cancer especially for the Luminal A subtype. J. Cell. Biochem. 115: 488–497, 2014. © 2013 Wiley Periodicals, Inc.
Breast cancer is one of the most common cancers in women. Microarray-based expression profiling has established five major breast cancer intrinsic subtypes and a normal breast cancer-like group that appear to have significant impact on prognosis and treatment [Perou et al., 2000; Sorlie et al., 2001; Parker et al., 2009; Voduc et al., 2010]. In addition, the existence of these subtypes has been recently validated at multiple “OMICS” levels. At its basic level, the Luminal subtypes, express ER, are low-grade tumors, and have generally good prognosis, especially Luminal A subtype, while Luminal B subtype is characterized by poorer prognosis and higher proliferation rate compared to Luminal A. Like the Luminal B, the HER-2-enriched subtype cancers are high-grade tumors, have poor prognosis but overexpress the Her-2 gene. The basal-like breast cancer constitutes 10–20% of all breast cancers, are mostly triple negative (ER, PR, HER-2 negative) tumors that express cytokeratin 5, 6, or 17 and the vast majority have mutations in the TP53 tumor-suppressor gene or can be associated with breast cancers harboring BRCA1 gene mutations [Perou, 2010]. Finally, the Claudin-low subtype is characterized by low expression of tight junction proteins (Claudin 3, 4, 7, and E-cadherin) that characterizes their stem-cell like and intense EMT phenotypic features. This subtype expresses ZEB1, twist and Snail, which are markers for EMT and poor survival [Carey et al., 2007; Prat et al., 2010].
RKIP is a well-known inhibitor of the Raf-MEK-ERK signaling pathway and appears as a master modulator of metastasis in almost all epithelial cancers [Al-Mulla et al., 2013].
Here, we shed light on the role of RKIP in the molecular subclassification of breast cancer. Particularly, we aim to illuminate its prognostic value among different subtypes, and within each molecular subtype of breast cancer.
MATERIALS AND METHODS
PATIENTS
The Research Ethics Committees of National University of Singapore and Kuwait University approved the use of human data in this study.
DATA PREPROCESSING OF AFFYMETRIX MICROARRAY GENE EXPRESSION
Microarray gene expression data of 3,992 patients with breast cancer from 26 publicly available cohorts (Array Express and Gene Expression Omnibus), performed using the Affymetrix U133A or U133Plus2 platforms were used in this study. The cohorts included the following datasets: E-TABM-158 (n = 130), GSE11121 (n = 200), GSE12276 (n = 204), GSE1456 (n = 159), GSE1561 (n = 49), GSE19615 (n = 115), GSE20181 (n = 176), GSE2034 (n = 286), GSE21653 (n = 266), GSE23177 (n = 116), GSE23593 (n = 50), GSE23988 (n = 61), GSE25066 (n = 508), GSE26639 (n = 226), GSE31519 (n = 67), GSE3494 (n = 251), GSE3744 (n = 47), GSE4922 (n = 40), GSE5327 (n = 58), GSE5460 (n = 127), GSE5764 (n = 10), GSE6532 (n = 414), GSE6596 (n = 24), GSE7390 (n = 198), GSE9195 (n = 77), and HESS cohort (n = 133) [Hess et al., 2006].
Robust Multichip Average normalization was performed on each dataset. The normalized data were combined and subsequently standardized using ComBat [Johnson et al., 2007] to remove batch effect.
IDENTIFICATION OF BREAST CANCER SUBTYPES
Single sample Gene Set Enrichment Analysis (ssGSEA) [Verhaak et al., 2013] was used to compute for each sample, enrichment scores of breast cancer subtype signature (Basal, Claudin-low, Luminal-A, Luminal-B, HER2+, or normal-like) [Prat et al., 2012a]. Each sample was then assigned to the subtype it has the highest enrichment scores.
DIFFERENTIALLY EXPRESSED GENES IN RKIP+ AND RKIP− BREAST CANCER TUMORS
To identify genes induced or under-expressed in RKIP+ and RKIP− breast cancer, the top 10% of breast cancers with highest or lowest expression of RKIP for each subtype were subjected to SAM and ROC analysis. Thresholds selected were SAM q-value < 0.1, and ROC >0.75 or <0.25 to identify genes significantly induced or under-expressed, respectively. These significant differentially expressed genes were then input to DAVID 6.7 [da Huang et al., 2009] to identify pathways potentially involved.
STATISTICAL ANALYSIS
Recurrence or relapse-free survival (RFS) indicates the time period, the operation date and disease reappearance in the form of local or distant metastatic recurrence. Differences in RFS were tested using the Log-rank test in univariate analysis and displayed using Kaplan–Meier curves. Cox proportional-hazards model was used to calculate the hazard ratio using univariate and multivariate analysis. Analysis was performed with SPSS version 17 (SPSS, Chicago, IL). Two-sided Chi-square (Yates' correction) or Fisher's exact tests were employed for statistical associations. This study complies with the reporting recommendations for tumor marker prognostic studies (REMARK) criteria [McShane et al., 2005]. A level of P ≤ 0.05 was considered to be significant.
RESULTS AND DISCUSSION
CLINICOPATHOLOGICAL CHARACTERISTICS OF THE MICROARRAY DATASETS
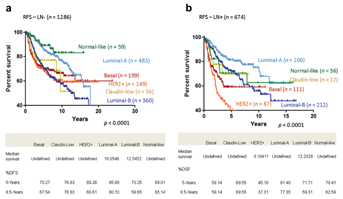
The full microarray datasets were compiled from 26 cohorts comprising 3,992 clinical samples. As our discussion centered on RFS, we limited our analyses to 2,333 samples where RFS information was available (mean survival = 5.6 years). Clinicopathological data were extracted from original publications or repository where the microarray datasets were obtained. The available data included age, grade, lymph node (LN) status, ER-α, PR, and HER2 status, as well as RFS information (Table I). Out of the 2,333 samples, 656 samples had all the clinicopathological data listed in Table I available. Patients had an average age of 53.8 years, with 37.8% younger than 49 years old (Table I). The majority of samples were ER+ (71.8%), PR+ (60.6%), and HER-2 negative (92.37%). HER-2+ breast cancers constituted 7.6% of the dataset. Sixty-five percent of the breast cancers had LN negative status. Tumor grade distribution was skewed towards higher grade (43.1% grade 2, 42% grade 3) in this dataset (Table I). The molecular subtypes of the clinical breast cancer samples were predicted using ssGSEA [Verhaak et al., 2013] (Material and Methods Section). Luminal breast cancers (63.95%) were the most prevalent molecular subtype (Table I). Figure 1a and b shows, as predicted, that the Luminal A subtype had the longest RFS among all other breast cancer subtypes regardless of nodal status with 5 years RFS of 85.68% and 8.5 years of 80.1% in node negative patients and 5 years RFS of 81.4% and 8.5 years of 77.35% in node positive patients. A tendency for worse prognosis was observed in patients harboring HER-2-enriched and LN positive tumors compared to HER-2-negative and LN negative cases (Fig. 1). Overall, these data are highly consistent with the PAM50 intrinsic subtyping panel reported previously [Prat et al., 2012b].
| Clinicopathological characteristics | Number of patients (n = 2,333) | Percentage |
|---|---|---|
| Age | ||
| <49 years | 537 | 37.84 |
| ≥49 years | 882 | 62.16 |
| Missing | 914 | — |
| ER-α | ||
| + | 1,218 | 71.82 |
| − | 478 | 28.18 |
| Missing | 637 | — |
| PR | ||
| + | 624 | 60.6 |
| − | 415 | 39.94 |
| Missing | 1,294 | — |
| HER2 | ||
| + | 53 | 7.63 |
| − | 642 | 92.37 |
| Missing | 1,638 | — |
| Lymph node | ||
| Positive | 674 | 34.39 |
| Negative | 1,286 | 65.61 |
| Missing | 373 | — |
| Grade | ||
| 1 | 252 | 14.89 |
| 2 | 730 | 43.14 |
| 3 | 710 | 41.96 |
| Missing | 641 | — |
| Predicted subtype | ||
| Basal | 381 | 16.33 |
| Claudin-low | 63 | 2.70 |
| Luminal-A | 815 | 34.93 |
| Luminal-B | 677 | 29.02 |
| HER-2-enriched | 286 | 12.26 |
| Normal-like | 111 | 4.76 |
| Relapse-free survival | ||
| Censored | 1,525 | 65.37 |
| Relapse | 808 | 34.63 |
RKIP EXPRESSION IS PROGNOSTIC IN BREAST CANCER AND ITS LEVELS ASSOCIATE WITH DIFFERENT MOLECULAR SUBTYPES
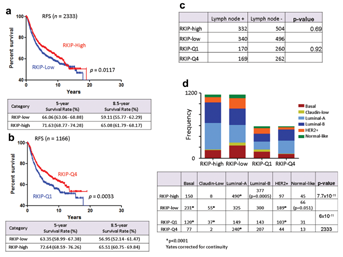
The molecular classification of breast cancer has improved our understanding of the complex biology and diversity of this disease. Originally, breast cancer was subclassified into different molecular subtypes using microarray gene profiling technology [Sorlie et al., 2001; van't Veer et al., 2002; Sotiriou et al., 2006; Loi et al., 2008]. Currently, ever-increasing classifiers are being employed to differentiate “Good” from “Bad” prognostic signatures in breast cancer [Paik et al., 2004, 2006; Parker et al., 2009]. Figure 2a shows that by utilizing RKIP expression alone, breast cancer may be classified into two groups with significantly different RFS. In univariate analysis, the RFS improved further when RKIP expression levels were limited to extreme values (Q1) and (Q4), representing lowest and highest quartiles, respectively (Fig. 2b and Tables II and III). In multivariate Cox regression analysis, ER− status (HR 0.5, 95% CI, 0.3–0.8, P = 0.005), LN metastasis (HR 3.2, 95% CI, 2.1–4.8, P = 8 × 10⁻⁸), and RKIP expression (HR 0.7, 95% CI, 0.47–0.98, P = 0.039) were independent prognostic factor in this cohort (Table II).
| Breast cancer RFS (n = 656, event = 142) | ||||||
|---|---|---|---|---|---|---|
| Clinical variable | Sample sizes | Univariate (HR, 95% CI) | P-value | Multivariate (HR, 95% CI) | Beta | P-value |
| Age (years) | ||||||
| <49 | 302 (46.04%) | 1 | ||||
| ≥49 | 354 (53.96%) | 0.99 (0.7–1.4) | 0.95 | 0.997 (0.7–1.4) | −0.003 | 0.98 |
| Grade | ||||||
| ≤2 | 300 (45.73%) | 1 | ||||
| >3 | 356 (54.27%) | 1.566 (1.1–2.2) | 0.0098 | 0.9 (0.6–1.3) | −0.1 | 0.6 |
| ER status | ||||||
| Negative | 259 (39.48%) | 1 | ||||
| Positive | 397 (60.52%) | 0.424 (0.3–0.6) | 4.12 × 10⁻⁷ | 0.504 (0.3–0.8) | −0.6 | 0.005 |
| PR status | ||||||
| Negative | 321 (48.93%) | 1 | ||||
| Positive | 335 (51.07%) | 0.484 (0.3–0.7) | 3.02 × 10⁻⁵ | 0.756 (0.5–1.2) | −0.2 | 0.2 |
| HER2 status | ||||||
| Negative | 610 (92.99%) | 1 | ||||
| Positive | 46 (7.01%) | 1.135 (0.63–2.) | 0.674 | 1.077 (0.6–1.9) | 0.07 | 0.8 |
| Lymph node status | ||||||
| Negative | 242 (36.89%) | 1 | ||||
| Positive | 414 (63.11%) | 3.028 (1.9–4.6) | 2.35 × 10⁻⁷ | 3.173 (2.1–4.8) | 1.1 | 8.2 × 10⁻⁸ |
| RKIP | ||||||
| ≤10.413 (average from normal) | 324 (49.39%) | 1 | ||||
| >10.413 | 332 (50.61%) | 0.637 (0.4–0.8) | 0.008 | 0.7 (0.47–0.98) | −0.3 | 0.039 |
- Numbers in bold indicate statistical significance.
| Category (RFS) | Category (RKIP) | Median survival (years) | Ratio | Lower 95% (ratio) | Upper 95% (ratio) | HR | 95% CI | Log-rank | |
|---|---|---|---|---|---|---|---|---|---|
| Lower | Upper | ||||||||
| All (n = 2,333) | RKIP-low (n = 1,166) | 15.94 | 0.8091 | −0.0609 | 1.679 | 1.2 | 1.04 | 1.37 | 0.012 |
| RKIP-high (n = 1,167) | 19.07 | ||||||||
| All (Q1 vs. Q4) (n = 1,166) | RKIP-Q1 (n = 583) | 15.43 | Undefined | Undefined | Undefined | 1.34 | 1.1 | 1.6 | 0.003 |
| RKIP-Q4 (n = 583) | Undefined | ||||||||
| ER+ (n = 1,218) | RKIP-low (n = 609) | 15.93 | 0.8355 | 0.0299 | 1.641 | 1.28 | 1.034 | 1.591 | 0.024 |
| RKIP-high (n = 609) | 19.07 | ||||||||
| ER+ (Q1 vs. Q4) (n = 609) | RKIP-Q1 (n = 304) | 18.05 | Undefined | Undefined | Undefined | 1.45 | 1.06 | 1.97 | 0.019 |
| RKIP-Q4 (n = 305) | Undefined | ||||||||
| ER− (n = 478) | RKIP-low (n = 239) | 10.56 | 0.7856 | 0.0438 | 1.527 | 1.299 | 0.96 | 1.75 | 0.085 |
| RKIP-high (n = 239) | 13.44 | ||||||||
| ER− (Q1 vs. Q4) (n = 239) | RKIP-Q4 (n = 119) | 8.474 | 0.6305 | −0.0244 | 1.285 | 1.75 | 1.15 | 2.66 | 0.009 |
| RKIP-Q1 (n = 120) | 13.44 | ||||||||
| Basal (n = 381) | RKIP-low (n = 190) | 8.551 | 0.6277 | −0.1007 | 1.356 | 1.125 | 0.82 | 1.54 | 0.47 |
| RKIP-high (n = 191) | 13.62 | ||||||||
| Claudin-low (n = 63) | RKIP-low (n = 31) | 9.667 | Undefined | Undefined | Undefined | 1.168 | 0.47 | 2.9 | 0.74 |
| RKIP-high (n = 32) | Undefined | ||||||||
| Luminal-A (n = 815) | RKIP-low (n = 407) | 15.93 | Undefined | Undefined | Undefined | 1.47 | 1.11 | 1.95 | 0.007 |
| RKIP-high (n = 408) | Undefined | ||||||||
| Luminal-B (n = 677) | RKIP-low (n = 338) | 10.4 | 0.9107 | 0.1237 | 1.698 | 1.028 | 0.81 | 1.31 | 0.824 |
| RKIP-high (n = 339) | 11.42 | ||||||||
| HER2+ (n = 286) | RKIP-low (n = 143) | 10.17 | 1.69 | 0.9772 | 2.402 | 0.86 | 0.612 | 1.21 | 0.38 |
| RKIP-high (n = 143) | 6.016 | ||||||||
- Numbers in bold indicate statistical significance.
Since RKIP has been shown repeatedly as an avid metastasis suppressor [Al-Mulla et al., 2013], we rationalized, that the difference in RFS may reflect a possible bias of having more breast cancers with LN metastasis enriching the low RKIP expressing group and vice versa. Figure 2c shows that the number of tumors with LN metastasis were similar in both the high-RKIP and the low-RKIP arms. Although these data do not exclude the possibility of distant metastasis as a discriminatory factor in the two RKIP groups, we next tested whether breast cancer subtyping may be a significant source for the witnessed differences in RFS. Indeed, low RKIP expression group was significantly enriched for basal-like, Claudin-low, and Her-2-enriched breast cancer subtypes, which are known for their aggressive propensities, while the luminal subtype constituted the major population in the high-RKIP group (Fig. 2d). Previously, using a proteome-based approach, Zhang et al. [2008], have documented an inverse relationship between Her-2 gene overexpression/amplification and RKIP expression.
RKIP EXPRESSION IS PROGNOSTIC IRRESPECTIVE OF ER STATUS
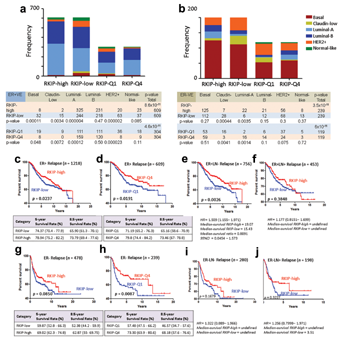
We examined the impact of RKIP expression on RFS after stratifying the dataset into ER+ and ER− groups. Figure 3a shows that within the ER+ group 88%, 80%, and 76% of the Claudin-low, Basal-like, and Her-2-enriched breast cancers, respectively, clustered in the RKIP low or Q1 group compared to high-RKIP expressing tumors, which mainly harbored the luminal tumor subtype. As expected, although the ER+ group contained all breast cancer subtypes, the Luminal subtype constituted the major tumor type (47%) in ER+ breast cancer (Fig. 3a). Conversely, the Basal-like subtype was the prevalent tumor in the ER− group (Fig. 3b). However, in the ER− group only Claudin-low subtype was significantly associated with low RKIP expression, while luminal A tumors were more likely to be found in the RKIP-high group (Fig. 3b). Our data suggest that estimating RKIP level in breast cancer may aid in the further classification of breast cancer. Next, we explored the influence of RKIP expression on ER-stratified RFS. RKIP expression was prognostic in the ER+ group with median survival of 19.07 years in high RKIP expressors versus 15.93 years in patients whose tumors express low RKIP (P = 0.024) (Fig. 3c and d). This demarcating significance was maintained in LN negative patients (Fig. 3e). However, it was lost in node positive patients (Fig. 3f). In the ER− subgroup, high versus low RKIP expression, showed a trend for longer RFS in the high RKIP group (Fig. 3g). However, this trend was only statistically significant in extremely polarized RKIP expression (Fig. 3h). The median survival was 13.4 years in very high (Q4) RKIP expressing tumors versus 10.6 years in very low (Q1) RKIP patients (P = 0.009) (Fig. 3g and h). In this group, nodal-status stratification abolished the prognostic power of RKIP (Fig. 3i and j). Our data suggest that RKIP expression level is prognostic irrespective of ER− status. However, its prognostication power is most discriminatory in the ER+ and LN negative group.
THE PROGNOSTIC POWER OF RKIP WITHIN EACH BREAST CANCER SUBTYPE
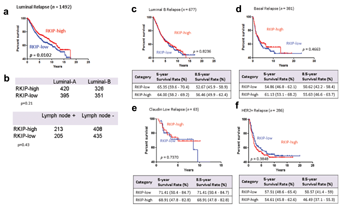
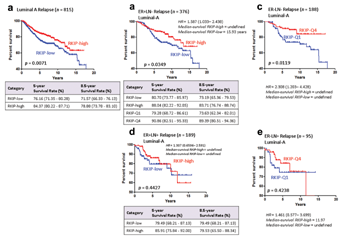
Next, we asked whether RKIP expression was prognostic within each breast cancer subtype. Figure 4a shows that RKIP expression was prognostic within the Lumina subtype, regardless of the Luminal subdivision or nodal status (Fig. 4b). However, it was of no prognostic value in luminal B alone (Fig. 4c), Basal-like (Fig. 4d), Claudin-low (Fig. 4e), and Her-2-enriched breast cancers (Fig. 4f). Intriguingly, in Luminal A subtype, 84.37% of patients whose tumors expressed high levels of RKIP survived for 5 years compared to 76.16% in low RKIP expressing tumors (Fig. 5a). More intriguingly, in ER+ and LN negative Luminal A tumors, 88.04% and 83.71% of patients survived for 5 and 8.5 years respectively, compared to 80.7% and 73.19% of low RKIP expressors (Fig. 5b). These values were enhanced when extreme polarized RKIP expression values (Q1 vs. Q4) were used in the RFS analysis (Fig. 5b). For example, 90.86% and 89.39% of very high RKIP expressors (Q4) had RFS for 5 and 8.5 years, respectively, compared to 79.28% and 73.63% of patients whose tumors lacked RKIP expression (Q1). Similarly, excellent RFS values were obtained in the ER−LN− Luminal A breast cancers expressing high (Q4) RKIP compared to low RKIP expressing tumors (Fig. 5c). Unlike nodal negative breast cancer, however, in node positive Luminal A breast cancer, RKIP was not prognostic (Fig. 5d and e). Our data suggest that RKIP profiling may aid in the identification of excellent performers in node-negative luminal A subtype. Conversely, its low-expression level may be used to direct treatments toward the intermediate-poor performers in the luminal A subtype. Future studies are required to test this proposition.
Currently, the 21-gene recurrence score provided by Oncotype DX [Gianni et al., 2005], the 70-gene profile (NKI70) of MammaPrint [Straver et al., 2010], the Rotterdam (ROT76), a 76-gene signature [Wang et al., 2005] or the risk of relapse score illuminated by the PAM50 subtyping assay [Parker et al., 2009] are being increasingly used to differentiate “good” from “bad” breast cancer gene-expression signatures. Importantly, the aforementioned prognostic tests depend for their output on profiling of a large set of genes using advanced molecular technologies that may largely be beyond the reach of standard pathology laboratories. Moreover, at their most basic level, they provide comparable outcome prediction in that they can differentiate between Luminal A (good prognosis) and all other subtypes with bad prognostic signatures [Goldhirsch et al., 2011]. In node-negative Luminal A disease, ROT76, PAM50, and other tests proved useful in selecting patients with excellent prognosis [Prat et al., 2012a, 2012b]. These data give credence to our findings. Surprisingly, in all the aforementioned tests, RKIP or PEBP1 gene has not been included in the list of genes selected for each assay. Therefore, having a single, and easily implementable, prognostic factor with a significant power to discriminate between Luminal A versus not, and one that is capable of identifying Luminal A tumors with intermediate–poor prognosis may prove valuable. Further work, however, is required to directly compare RKIP prognostic efficacies to the other classifying tests. Combining results from different tests has been shown to improve their predictive power [Prat et al., 2012a]. However, their combination could prove economically unpractical, given the high cost of each classifier. Therefore, the addition of RKIP to the existing tests, given its relative low-cost, may alleviate such dilemma. In aggregates, our findings harmonize with the premise that in breast cancer, RKIP perturbation plays more prominent role in the pathology of breast cancer than previously thought.
GENE-BASED SIGNATURES OF RKIP− VERSUS RKIP+ BREAST CANCER
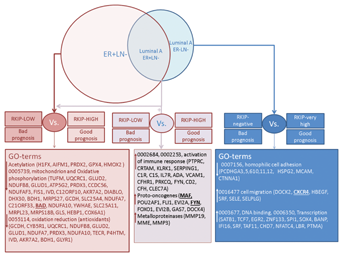
Silencing of RKIP induces cellular proliferation, motility and heighted-state of oxidative stress in HEK-293 cells [Al-Mulla et al., 2011a,2011b]. In an attempt to understand reasons behind the poor prognostication witnessed in negative-low RKIP versus high-RKIP breast cancer, we compared the microarray expression profiles of ER + LN− (RKIP-high) with ER + LN− (RKIP-low). Gene ontology (GO) analysis shows that in the ER + LN− (RKIP-low) group (n = 378), 133 genes involved in the mitochondria, oxidative phosphorylation, and oxidative reduction were downregulated compared to the ER + LN− (RKIP-high) group (n = 378; Fig. 6 and Supplementary Excel Files). Our data are consistent with previous reports demonstrating that RKIP silencing induced an intense oxidative stress in cells [Al-Mulla et al., 2011a,2011b], which may be associated with aggressive phenotype and therapeutic resistance in cancer [Al-Mulla et al., 2012]. Of particular interest is the downregulation of BAD in the RKIP-low group, which has been shown to be an independent prognostic factor in non-small cell lung cancer [Huang et al., 2012] and to play pivotal role in apoptosis resistance in breast cancer [Aranovich et al., 2012]. Consistently, Luminal A, ER + LN−, that express low RKIP levels also showed largely identical expression profile to the ER + LN− (RKIP-low) group (Fig. 6 and Supplementary Excel Files). However, in addition, the Luminal A (ER + LN−/RKIP-low) group (n = 188), overexpressed 173 genes involved in the immune response activation, proto-oncogenes, and metalloproteinases compared to the luminal A (ER + LN−/RKIP-high) group (n = 188; Fig. 6 and Supplementary Excel File). Intriguingly, Luminal A tumors characterized by ER−, LN−, and low RKIP level, underexpressed 393 genes associated with the GO term hemophilic cell adhesion and overexpressed genes involved in transcriptional control and enhanced cellular motility (Fig. 6 and Supplementary Excel Files). These data give credence to our previous work associating loss of RKIP with enhanced cellular motility [Al-Mulla, 2012]. Among the upregulated motility-enhancing genes, CXCR4 is of particular interest because elevated levels of this chemokine receptor have been associated with poor prognosis in a variety of cancer types [Mukherjee and Zhao, 2013]. In breast cancer, CXCR4 acts as a homing receptor in organs that secrete its ligand CXCL12, like lung and bone [Muller et al., 2001, 2006], which may explain the propensity of low-RKIP expressing breast cancer to metastasize to distant organs. Our data harmonize with a previous report showing that Luminal B breast cancer overexpressed genes involved in the immune response and conversely, underexpressed genes belonging to the GO term cell adhesion compared to Luminal A tumors [Prat et al., 2013]. Therefore, potentially more aggressive Luminal A breast cancers, characterized by lower RKIP expression attained an expression profile that may be similar, at particular GO terms, to Luminal B breast cancers. Together, these data support the premise that RKIP loss or diminution may be involved in the transcriptional reprograming of breast cancer and that this phenomenon may be not only subtype specific but can be prognostic within the Luminal A subtype. Future studies will be needed in order to verify our RKIP-related data at the protein level. Nevertheless, one may envision a therapeutic intervention aimed at enhancing the expression of RKIP as a new avenue in the treatment of aggressive breast cancer.
