Artificial Intelligence in Musculoskeletal Imaging: A Paradigm Shift
ABSTRACT
Artificial intelligence is upending many of our assumptions about the ability of computers to detect and diagnose diseases on medical images. Deep learning, a recent innovation in artificial intelligence, has shown the ability to interpret medical images with sensitivities and specificities at or near that of skilled clinicians for some applications. In this review, we summarize the history of artificial intelligence, present some recent research advances, and speculate about the potential revolutionary clinical impact of the latest computer techniques for bone and muscle imaging. © 2019 American Society for Bone and Mineral Research. Published 2019. This article is a U.S. Government work and is in the public domain in the USA.
Introduction
Artificial intelligence (AI), a subfield of computer science, can be broadly defined as the use of a computer to replicate human intelligence in performing tasks. Nested within this umbrella term of “artificial intelligence” is the field of machine learning. Important goals of machine learning are to impart to computers the capacity to learn without explicit programming and to make more accurate predictions from data. Although machine learning algorithms in general do progressively improve with experience at performing tasks, they still may need some human input or guidance to improve performance.
Computer analysis of images has a long history in musculoskeletal radiology. The last 5 years have seen a dramatic improvement in such analyses. In particular, recent developments in artificial intelligence have caused a paradigm shift in the ability of computers to detect, characterize, and measure complex pathologies in the musculoskeletal system.
These advances have arisen in large measure because of improvements in the field of computer vision, a branch of computer science. The computer scientists in this field have developed a suite of technologies loosely called deep learning that are able to recognize objects in natural world images like the photographs we take while on vacation.1 It turns out that these same technologies are highly effective at detecting abnormalities on medical images, including radiology, pathology, and ophthalmologic images.2-5
For this review, we will focus on musculoskeletal radiology images. We performed a search of PubMed for papers with the following key word set: (machine learning OR deep learning OR convolutional OR neural network) AND (musculoskeletal OR skeletal OR bone OR skeleton OR muscle) AND (X-ray OR xray OR radiography OR computed tomography OR CT OR magnetic resonance OR MRI). This search yielded more than 800 results as of this writing, the majority (71%, 581/821) from 2013 and later. Clearly this field is growing rapidly. In this review, we focus on the authors' experience with the application of artificial intelligence in musculoskeletal imaging and how we believe this represents a paradigm shift in this field.
Background
Although deep learning has only been applied to radiology over the past few years, radiology researchers have been developing computer tools for automated detection and characterization of musculoskeletal disease on radiologic images for decades. Three generations of development are loosely defined centered about the parallel evolution of medical imaging technology and computer hardware and software, and availability of very large labeled data sets.
First-generation development was inhibited by primary image acquisition on analog photographic film, with ad hoc digital conversion, and the markedly slower speeds of available computers. Some early examples in musculoskeletal radiology include classifying bone tumors on radiographs (Lodwick and colleagues6), segmenting the femur and tibia on AP knee radiographs (Ausherman and colleagues7), and assessing bone mineral density on hand and wrist radiographs (Geraets and colleagues8).
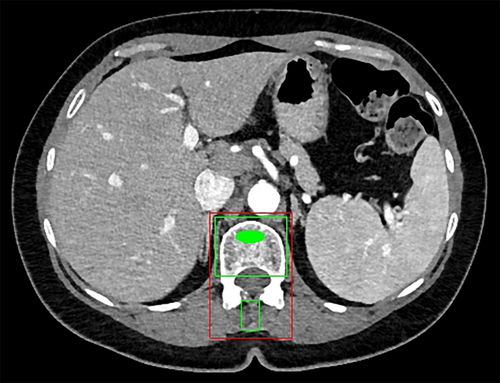
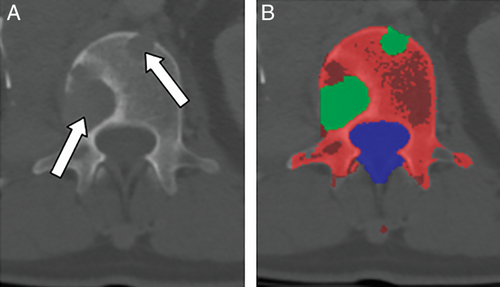
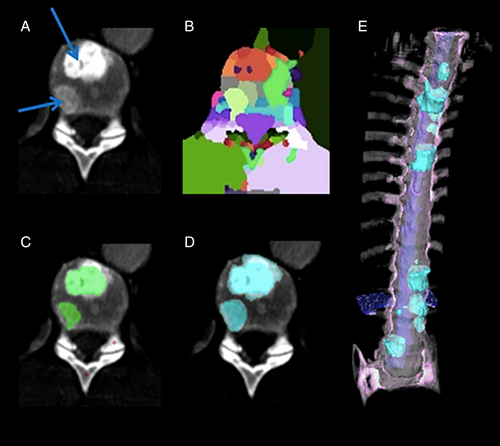
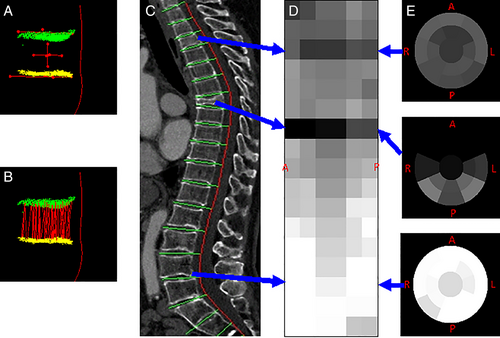
Second-generation development is characterized by increasingly prevalent primary digital image acquisition, more capable computers, and new algorithms. This generation continued until the early to mid-2010s. Some examples include texture-based morphometry of osteoporosis on CT (Mundinger and colleagues9), estimation of skeletal age on radiographs (Pietka and colleagues10; Frisch and colleagues11), assessment of bone trabeculae on MRI and CT (Link and colleagues12), measurement of bone mineral density on CT (Lang and colleagues13; Summers and colleagues14) (Fig. 1), and detection of lytic and sclerotic metastases on CT (O'Connor and colleagues15; Burns and colleagues16) (Fig. 2 and Fig. 3). More examples can be found in a recent review.17
In these first two generations, researchers attempted to replicate human perception and cognition in the interpretation of medical images. They did so by handcrafting computer models to mimic human perception of the features of the anatomy or pathology of interest. While neural networks were available at this time, use was inhibited because of CPU (rather than graphics processing unit or GPU) based computation and inability to train deep networks. Consequently, other analytical techniques such as support vector machines (SVMs) rose in prominence. Unfortunately, those other techniques were insufficient to achieve clinician-level performance.
Recent advances have led to the third generation of development. These advances include faster and cheaper GPUs, the ability to train deep (as opposed to shallow) neural networks with many layers, and the increasing availability of very large labeled data sets. These deep learning systems can learn features from medical images without being specifically designed to assess these features (ie, handcrafted features are no longer necessary). The third-generation techniques are more accurate and rapidly developed (from years to months) than prior generations.
Imaging Modality Examples
Artificial intelligence techniques have been applied to the various modalities of musculoskeletal imaging, including DXA, radiography, CT, and MRI. In this section, we will review a number of such applications.
DXA
On DXA, applications include detection of osteoporotic vertebral compression fractures and femoral segmentation for assessment of bone density.18, 19 Using semi-automated vertebral segmentation and appearance models, Roberts et al. attained 88% sensitivity for compression fracture detection at a 5% false-positive rate.
Radiography
Kim and MacKinnon20 and Lindsey and colleagues21 used deep convolutional neural networks to assess wrist radiographs for fractures. Kim and MacKinnon attained a sensitivity of 0.9 and specificity of 0.88 in wrist fracture detection with transfer learning on a deep CNN model pretrained on non-medical images. Lindsey and colleagues showed that with deep learning, wrist fractures were correctly detected by emergency medicine clinicians with a relative reduction in misinterpretation rate of 47.0%.
Bone age analysis from pediatric hand radiographs has been performed recently using deep learning.22, 23
Computed tomography
Our group and others have focused to a great extent on musculoskeletal pathology of the central body or axial skeleton on CT. Reasons for this focus include the widespread use of body CT and the relatively infrequent use of extremity CT. For AI research, CT also has some benefits over MRI, including fewer artefacts and the direct physical meaning of the pixel intensities. For example, CT Hounsfield units (HU) are calibrated daily to a standard, but MR signal intensity is determined by a host of machine-specific parameters and characteristics.
Examples of this work include automated detection of traumatic and compression fractures, degenerative changes, epidural masses, bone metastases, and bone mineral density of the spine on CT utilizing both second- and third-generation techniques.15, 16, 24-38 The typical strategy for these applications involves vertebral level labeling and segmentation, followed by feature- or learning-based automated measurement or detection.39-42
Magnetic resonance imaging
Because MRI is widely used for assessing spinal degenerative changes in the setting of neck and back pain, significant efforts have been made toward automated delineation of spinal anatomy on MRI images.43-48 Forsberg and colleagues studied detection and labeling of cervical and lumbar vertebrae using third- and second-generation techniques, respectively, with sensitivities of 99.1% to 99.8% for detection and accuracies of 96.0% to 97.0% for labeling.44 Lu and colleagues segmented the lumbar vertebrae and assessed for spinal stenosis using a U-Net deep learning architecture.47 For vertebral detection, the Dice Similarity Coefficient, a measure of segmentation accuracy, was 0.93, and for spinal canal and foraminal stenosis grading, the accuracies were 80.4% and 78.1%, respectively.
Neoplasia detection in bone on MRI has been performed by Jerebko and Wang.49, 50 Automated detection of the fascia lata in the thigh was used to assess for fatty replacement of muscle in patients with muscular dystrophy.51 Knee cartilage defects and meniscal tears have been automatically assessed on MRI.52
In the next sections, we discuss specific applications in more detail.
Fracture detection
There has been considerable interest in developing automated tools to detect a variety of bone fractures. One such system automatically detected acute traumatic fractures of thoracic and lumbar vertebral bodies on CT24, 53, 54 (Fig. 4). The sensitivity for detection of fractures within each vertebra was 81%, with a false-positive rate of 2.7 per patient in the test-set patients. Acute pelvic fractures can also be automatically detected.55, 56
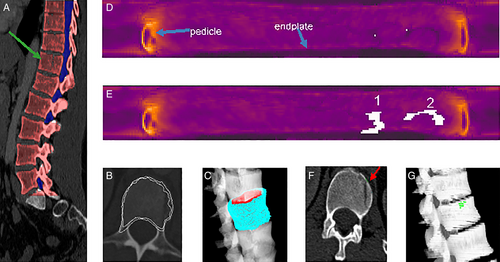
Radiologists may overlook spine compression fractures if they do not routinely review sagittal midline images on body CT.57 In response, a system was designed for the automated detection and localization of thoracic and lumbar vertebral body compression fractures on CT. In addition to detection, the system determined Genant classification of the fractures26, 58 (Fig. 5). In a set of CT scans with 210 fractured vertebrae, the sensitivity for detection of vertebrae with compression fractures was 95.7%, with a false-positive rate of 0.29 per patient.26
Bone oncology
Automated detection of lytic, sclerotic, and mixed density metastatic bone lesions of the spine and sclerotic lesions of the ribs has been developed (Figs. 2 and 3).15, 16, 59-61 In one such system, the sensitivity (and false-positive rate per patient) was 81% (2.1), 81% (1.3), and 76% (2.1) for sclerotic, lytic, and mixed lesions of the spine, respectively, using SVM classifiers.27 This system is a first step toward the quantitative analysis of metastatic spine disease for determination of tumor burden, assessment of lesion change over time, and inclusion of bone lesions into treatment response criteria such as RECIST. In other work, 185 sclerotic lesions were identified in patient ribs, and a system with 75.4% sensitivity at an average of 5.6 false-positives per case was designed and tested using an SVM classifier.59 Performance improvements will be required for such systems to be used clinically.
Osteoporosis and assessment of bone mineral density
Automated bone mineral density determination on CT may be performed with a densitometry phantom in the field-of-view or with a calibrated scanner14 (Fig. 1). Calibration curves may be constructed from the phantoms in dedicated QCT scans, mapping CT attenuation in HU to bone mineral density in mg/cc on that scanner. This calibration curve may then be used to convert the mean trabecular bone CT attenuation on this now-calibrated scanner to give a BMD estimation without the presence of the phantom. DXA and automated quantitative CT of the lumbar spine have been compared for assessment of bone mineral density on CT with an area under the ROC curve of 0.888.62
Osteoporosis and fragility fracture risk have also been assessed on dental panorex radiographs, hip radiographs, and on MRI.63-65 For example, MRI in combination with FRAX score, BMD, and patient physical characteristics has been used to predict osteoporotic bone fractures.65
Opportunistic screening
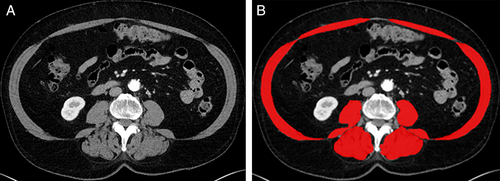
Opportunistic screening means the detection of abnormalities unrelated to the primary indication for the scan. Examples of opportunistic screening include bone mineral densitometry, visceral fat analysis, and sarcopenia assessment on CT scans obtained for colorectal cancer screening or other indications14, 62, 66-71 (Fig. 6). Such opportunistic screening does not require additional radiation exposure and provides additional information from images that already exist. It is envisioned that such opportunistic screening may lead to early detection, risk assessment, and favorable treatment outcomes in such conditions as osteoporosis, metabolic syndrome, and sarcopenia.
Other applications
Other AI applications include bone strength determination and osteoarthritis evaluation.72
Purpose-Driven Development: Putting Medicine on a Scientific Quantitative Basis
Although in many cases, the automated detection of a specific pathology is the initial goal, the ultimate goal of much of this research is quantitative characterization of the disease of interest. In this way assessment of disease can be taken from the qualitative or semiquantitative historical basis of 19th- and 20th-century medicine into the realm of other scientific disciplines using the full power of modern computing. Potential advantages of doing so include quantitative analysis of static and dynamic characteristics, reduced diagnostic variability, integration of imaging, pathology, genomic and laboratory data, and discovery of hidden correlations heretofore unknown and uninvestigated, akin to the advances made in data mining genomic data.
Challenges in Development
As alluded to previously, one of the enabling (as well as limiting) factors in AI development for musculoskeletal imaging is the public availability of well-labeled image data sets. Examples of available data sets include those for bone age assessment, knee MRI, bone radiographs, and spine imaging.41, 73-75 Data sets such as these are often used for competitive challenges typically in association with an image processing conference. Examples include SpineWeb and intervertebral disc segmentation (https://ivdm3seg.weebly.com/) at the MICCAI meeting and the Pediatric Bone Age Machine Learning Challenge at the 2017 meeting of the RSNA.41, 75
There are also many possible clinical tasks to be automated, many of which might be used only infrequently.76 This leads to development challenges such as a lack of relevant data sets and difficulties in attaining high performance. Difficulties in labeling the reference standard, such as uncertainties in lesion boundaries or diagnosis, and variabilities in human labeling accuracies, can also lead to reduced performance.
Challenges in Implementation
There have also been challenges in transitioning computer technologies from the lab bench (ideation, design, and testing) to the patient's bedside (direct clinical application). Computer-aided diagnosis has had a mixed track record in patient care, dampening enthusiasm for these technologies in clinical settings. Early CAD systems, which were FDA-approved and integrated into direct clinical patient care, predominantly for mammography, often had high sensitivities but also high false-positive rates, leading to inefficiencies and unnecessary testing in clinical practice.77 The new deep learning-based techniques may reduce the false-positive rates and provide more accurate diagnoses. Another challenge to implementing these technologies in clinical settings has been practice workflow and economic factors. For example, it is not clear how these automated tools would be paid for because there are few mechanisms for reimbursement for such practice enhancements.
Opportunities
Automated image analysis tools can have other applications that are underrecognized. For example, population analyses and epidemiologic assessments can be performed more readily when images can be converted to measurements. Automated analyses can enable triage, for example, by quickly identifying critical exam findings and alerting physicians to their presence. They can permit better integration with other quantitative clinical measures such as lab values and genomic data. They can also improve measurement reproducibility, for example, in the setting of RECIST measurements of solid tumors, which are known to demonstrate large observer variability.78
The Future
The power of the latest machine learning algorithms represents a paradigm shift over the failed promises of earlier generations of CAD. There is huge excitement about the application of machine learning to images. This has led to burgeoning investment in startup companies in this space. Consequently, we can expect to see many commercial products and much physician interest in these technologies. Potential benefits to the patient include more prompt and accurate diagnoses, more coordination with other clinical data, and more accurate disease prognoses. Better understanding of the natural progression of disease, an enlarged spectrum of epidemiologic studies, and diffusion of diagnostic technologies to underserved communities for global health improvements are other potential benefits. Whether these benefits will come to pass depends on many factors in addition to basic research progress, including clinical acceptance and means of reimbursement.
Disclosures
RMS has pending and/or awarded patents for automated image analyses, and receives royalty income from iCAD, Ping An, ScanMed, and Koninklijke Philips. His lab received research support from Ping An Technology Company Ltd. and NVIDIA. JY has pending and/or awarded patents for automated image analyses, and receives royalty income from iCAD and Ping An. He is presently an employee at Tencent Holdings.
Acknowledgments
We thank Drs Nathan Lay and Daniel Elton for software engineering. Tatiana Wiese is thanked for Fig. 3.


