Cortical Matrix Mineral Density Measured Noninvasively in Pre- and Postmenopausal Women and a Woman With Vitamin D–Dependent Rickets
ABSTRACT
Reduced bone mineral density (BMD) may be due to reduced mineralized bone matrix volume, incomplete secondary mineralization, or reduced primary mineralization. Because bone biopsy is invasive, we hypothesized that noninvasive image acquisition at high resolution can accurately quantify matrix mineral density (MMD). Quantification of MMD was confined to voxels attenuation photons above 80% of that produced by fully mineralized bone matrix because attenuation at this level is due to variation in mineralization, not porosity. To assess accuracy, 9 cadaveric distal radii were imaged at a voxel size of 82 microns using high-resolution peripheral quantitative computed tomography (HR-pQCT; XtremeCT, Scanco Medical AG, Bruttisellen, Switzerland) and compared with VivaCT 40 (µCT) at 19-micron voxel size. Associations between MMD and porosity were studied in 94 healthy vitamin D–replete premenopausal women, 77 postmenopausal women, and in a 27-year-old woman with vitamin D–dependent rickets (VDDR). Microstructure and MMD were quantified using StrAx (StraxCorp, Melbourne, Australia). MMD measured by HR-pQCT and µCT correlated (R = 0.87; p < 0.0001). The precision error for MMD was 2.43%. Cortical porosity and MMD were associated with age (r2 = 0.5 and –0.4, respectively) and correlated inversely in pre- and postmenopausal women (both r2 = 0.9, all p < 0.001). Porosity was higher, and MMD was lower, in post- than in premenopausal women (porosity 40.3% ± 7.0 versus 34.7% ± 3.5, respectively; MMD 65.4% ± 1.8 versus 66.6% ± 1.4, respectively, both p < 0.001). In the woman with VDDR, MMD was 5.6 SD lower and porosity was 5.6 SD higher than the respective trait means in premenopausal women. BMD was reduced (Z-scores femoral neck –4.3 SD, lumbar spine –3.8 SD). Low-radiation HR-pQCT may facilitate noninvasive quantification of bone's MMD and microstructure in health, disease, and during treatment. © 2018 American Society for Bone and Mineral Research.
Introduction
Dual-energy X-ray absorptiometry is a method of radiation transmission that permits quantification of areal bone mineral density (BMD) based on the attenuation of photons by mineralized bone matrix after accounting for the attenuation produced by soft tissue.1 The attenuation by mineral is determined by the matrix volume and the degree of completeness of primary and secondary mineralization of that matrix.
Thus, a deficit in BMD may be the result of 1) a deficit in the volume of normally mineralized bone matrix as observed in healthy postmenopausal women and in women with osteoporosis relative to premenopausal women; 2) incomplete secondary mineralization produced by rapid remodeling, which replaces older fully mineralized bone with younger incompletely mineralized bone; or 3) failed primary mineralization as occurs in osteomalacia.2
These alternatives cannot be distinguished using bone densitometry because it captures the three-dimensional mineralized bone matrix volume as a two-dimensional “areal” projected image. Indeed, failure of primary mineralization in osteomalacia requires demonstration of reduced matrix mineral content with increased surface extent of osteoid, increased osteoid thickness, and mineralization lag time obtained using dynamic histomorphometry.3, 4 However, this approach is not often used because bone biopsy is invasive.5
Assessment of bone matrix mineralization using conventional X-ray micro-computed tomography is feasible.6, 7 Burghardt and colleagues reported high correlations between matrix mineral density (MMD) measured using micro-computed tomography (μCT) and synchrotron micro-computed tomography or ash fraction ex vivo (R2 = 0.78 to 0.99).
Quantification of MMD has also been achieved using high-resolution peripheral quantitative computed tomography (HR-pQCT), a noninvasive approach that images bone at low-radiation exposure to quantify matrix mineral density.8, 9 For example, Tsai and colleagues quantified MMD in patients treated with teriparatide, denosumab, or both.10 Using the same method, Boutroy and colleagues reported a higher MMD in Chinese compared with white American women.11
We hypothesized that MMD will decrease after menopause because of increased bone remodeling removing older more mineralized bone and replacing it with younger, less fully mineralized bone, and that because remodeling is unbalanced, cortical porosity will be higher in post- than premenopausal women and that cortical porosity and MMD will correlate inversely. We also hypothesized that a patient with vitamin D–dependent rickets (VDDR) and proven hyperosteoidosis on bone histology will have reduced MMD and increased cortical porosity distinguishing her from age-comparable vitamin D–replete women.
Materials and Methods
Accuracy of measurement of MMD using the StrAx software
Ex vivo experiment
MMD measured using µCT correlates with that quantified using synchrotron µCT or ash fraction.12 We, therefore, assessed the accuracy of the StrAx measurement of MMD by comparing the result obtained with that using μCT as gold standard ex vivo. Nine radii from the nondominant arm from white female cadavers were imaged using VivaCT 40 µCT (19-µm voxel size, 70 kVp, 114 mA, 381 ms integration time; Scanco Medical, Bruttisellen, Switzerland). Photon attenuation produced by mineralized matrix was converted to hydroxyapatite mgHA/cc concentrations using a linear regression derived by imaging a calibration phantom containing rods of HA-resin mixtures (0, 100, 200, 400, and 800 mg HA/cm3). The radii were scanned at the same region of interest (ROI) using HR-pQCT (XtremeCT, Scanco Medical AG, 60 kVp, current of 900 μA; stacks of 110 images 9.2 mm were acquired with an isotropic voxel size of 82 μm).
In vivo experiment
For the study of MMD and porosity across age, 296 healthy pre- and postmenopausal women without fragility fractures or exposure to antiresorptive agents were recruited from the Bone Structural Study (see Results). To compare the StrAx method of measuring MMD with that obtained using the Scanco method across the range of MMD values in the community, we studied a separate cohort of 148 healthy ambulant women, mean age 57 years (range 20 to 90 years). The study was approved by Austin Health Ethics Committee (H2006/02704).
Images acquired using HR-pQCT were automatically analyzed using StrAx (StraxCorp, Melbourne, Australia).8 Bone was segmented from background into its cortical, transitional (cortico-trabecular), and trabecular compartments. Cortical porosity and MMD were quantified and the relative content of mineral in each voxel within the compact-appearing cortex was expressed as a frequency distribution curve.
To quantify porosity, we first identified voxels attenuating photons to the same extent as the attenuation produced by fully mineralized bone (∼1200 mg hydroxyapatite) and assigned a value of 100% to these voxels. Voxels with attenuation equal to that produced by background (muscle tissue) were assigned a value of 0%. Between these extremes, voxels in the cortical compartment were classified based on their relative content of mineralized versus nonmineralized tissue into categories: 0%, 1% to 50%, 51% to 70%, 71% to 95%, and 95% or above. The quantification of porosity was restricted to voxels with attenuation value equal to or less than 80% of the attenuation produced in fully mineralized bone matrix because the presence of a pore is unlikely to produce an attenuation above 80% of maximum. Porosity was calculated as the mean level of emptiness in these voxels13 (Fig. 1).
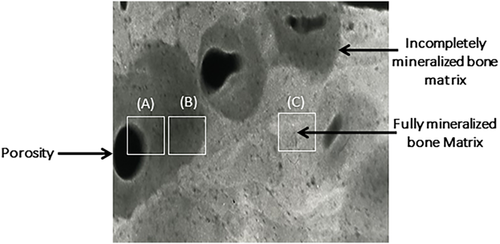
Quantification of MMD was confined to voxels attenuating photons from 80% to 100% of the attenuation of fully mineralized bone matrix because the likelihood of a pore of 25-micron diameter is less than 5% so that the variation in the attenuation is most likely to be due to variation in matrix mineralization, not porosity. The reason for the choice of threshold of 80% of the maximum for measuring MMD is reported.9 In brief, heterogeneity in mineralization was assessed in 520 consecutive random points from SEM images of trochanteric cortical bone obtained at post-mortem from 12 white females (mean age 69 years; range 29 to 85 years).9 The mean MMD was 10% below the maximum with the greatest deviation being within 20% below the maximum. Thus, heterogeneity in MMD produces voxels with attenuation within 80% of that produced by fully mineralized matrix because osteoid undergoes rapid primary mineralization, reaching ∼80% of peak matrix mineralization in days to become “bone.”13-15
Reproducibility of the measurement of MMD using the StrAx software
Fifteen women had three measurements at the distal radius using HR-pQCT. Images were co-registered by an expert (AGZ) and analyzed using StrAx to test the effect of acquisition plus repositioning, co-registration, and processing on segmentation and quantification of porosity.
Statistical analysis
Data were analyzed using SPSS version 24.0 (IBM Corp., Armonk, NY, USA) and expressed in mean and standard deviation. To validate StrAx1.0 segmentation and quantification of porosity, we determined the significance of Pearson's correlation coefficient (r2) between the gold standard and StrAx1.0 measurements. The precision error was calculated as the coefficients of variation (CV%). Significance levels (p < 0.05) were two-tailed.
Results
Accuracy and precision of the matrix mineral density measurement
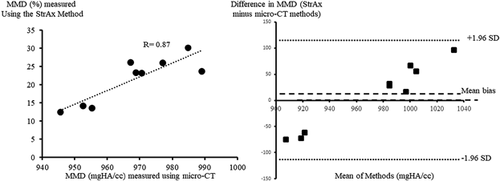
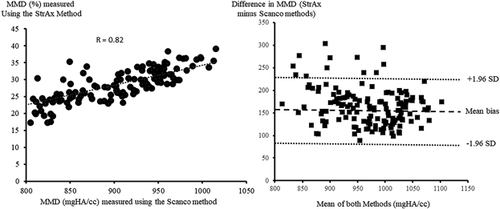
MMD measured using StrAx1.0 correlated with the gold standard µCT measurements (R = 0.87; p < 0.0001) (Fig. 2). There was agreement between MMD measured using StrAx1.0 and the manufacturer's measurements (R = 0.82; p < 0.0001) (Fig. 3). The precision error of StrAx1.0 measurement of MMD expressed as the root mean squared CV was 2.43%.
MMD and bone microstructure in vitamin D–replete pre- and postmenopausal healthy women and in a woman with vitamin D–dependent rickets
For the study of MMD and porosity across age, of the 296 healthy pre- and postmenopausal women without fragility fractures or exposure to antiresorptive agents recruited from the Bone Structural Study, 97 pre- and 28 postmenopausal women were excluded because of low 25-hydroxyvitamin D (25[OH] D) level (<50 nmol/L), leaving 94 premenopausal women (aged 41.8 ± 6.1 years), 77 postmenopausal women (aged 60.7 ± 7.4 years) with serum 25(OH) D ≥50 nmol/L, and a 27-year-old woman with vitamin D–dependent rickets proven by bone biopsy. The pre- and postmenopausal females had, respectively, serum creatinine (66.1 ± 8.5, 67.6 ± 9.3 μmol/L), calcium (2.4 ± 0.1, 2.4 ± 0.1 nmol/L), parathyroid hormone (PTH; 4.2 ± 1.3, 4.7 ± 1.3 pmol/L), 25 hydroxyvitamin D (66.1 ± 11.9, 69.9 ± 15.7 nmol/L), and femoral neck T-score (–0.16 ± 0.94, –1.04 ± 0.95).
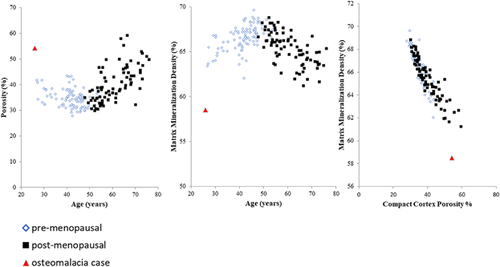
Cortical porosity and MMD were associated with age (r2 = 0.5 and –0.4, respectively, both p < 0.001) (Fig. 4) and was higher in post- than in premenopausal women (40.3% ± 7.0% versus 34.7% ± 3.5%, respectively, p < 0.001). MMD was lower in post- than in premenopausal women (65.4% ± 1.8 versus 66.6% ± 1.4, respectively, p < 0.001). Cortical porosity and MMD correlated inversely in pre- and in postmenopausal women (both r2 = 0.9, p < 0.001) (Fig. 4).
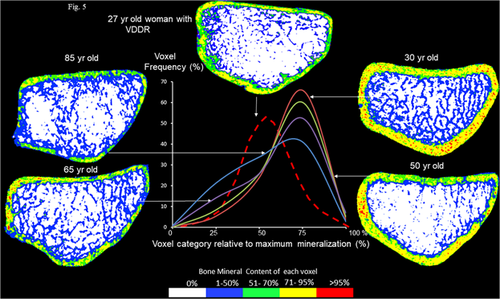
The mineral per voxel frequency distribution curves of the compact cortex varied as a function of age (Fig. 5). In the 30-year-old vitamin D–replete premenopausal woman, the curve was displaced to the right with a greater proportion of voxels containing fully mineralized matrix (red dots), whereas the left tail of the distribution had few voxels containing nonmineralized tissue (either osteoid or porosity). The trabeculae are plentiful and connected (blue). The curves for the 50-, 65-, and 85-year-old postmenopausal women are shifted to the left, reflecting fewer voxels containing fully mineralized bone. Trabeculae are thin and disconnected. In the 85-year-old vitamin D–replete postmenopausal woman, the curve was shifted left with a greater proportion of voxels containing nonmineralized bone (either porosity or osteoid volume), whereas the right tail had few voxels containing fully mineralized bone matrix.
Case report of VDDR subject
This 27-year-old Asian female presented in childhood with hypocalcemia (1.7 mmol/L, reference range 2.1–2.6), elevated alkaline phosphatase (four times the upper limit of normal), secondary hyperparathyroidism (serum parathyroid hormone seven times the upper limit of normal), and an undetectable 1, 25 dihydroxy-vitamin D level. She required regular intravenous calcium during puberty to maintain normocalcemia. In adulthood, she had multiple stress fractures and persistent hypocalcemia despite 2.25 mcg of calcitriol and 3600 mg of elemental calcium daily due to poor compliance. She had bilateral osteotomies to correct bowing deformities. After her HR-pQCT images were taken, she improved her compliance and achieved normocalcemia with the same dose of calcitriol and calcium supplements.
Peripheral leucocyte DNA analysis revealed compound heterozygosity with two mutations in the 1 alpha hydroxylase coding gene (CYP27b1) producing vitamin D–dependent rickets type 1a (VDDR1a, vitamin D 1 alpha-hydroxylase deficiency). Iliac crest bone biopsy showed increased osteoid volume, which comprised 70% of trabecular matrix volume and absence of tetracycline label.
MMD was 5.6 SD lower than the mean in vitamin D–replete premenopausal women. Cortical porosity was 5.6 SD higher than the mean in premenopausal women (Fig. 4). Bone mineral density was reduced (Z-scores femoral neck –4.3 SD, lumbar spine –3.8 SD). As can be seen from the mineral per voxel distribution curve in Fig. 5 (hatched red curve), the patient with VDDR has thin cortices with few voxels in the right tail of the distribution indicating the cortex contains little fully mineralized bone. Trabeculae are thin and disconnected. There is increased undermineralized bone matrix (blue and green voxels). The curve is shifted left, indicating the cortex is composed of more porosity and unmineralized tissue (osteoid).
Discussion
We present the results of a noninvasive method of measuring MMD in vivo using images acquired by HR-pQCT and analyzed by StrAx in healthy pre- and postmenopausal women and in a patient with biopsy-proven osteomalacia. Quantification of matrix mineral was achieved by examining the attenuation produced by the contents of voxels relative to the attenuation produced by fully mineralized bone and that produced by nonmineralized tissue. The results obtained by this method correlated with results obtained at higher resolution using VivaCT as a gold standard and with MMD measured by Scanco analysis of the same ROI.
Before menopause, remodeling is slow and balanced. Each remodeling event replaces the volume of bone removed with an equal volume of new bone so that there is no net loss of bone, no microstructural deterioration, and no change in mean MMD. After menopause, remodeling becomes unbalanced and rapid. Each remodeling transaction initiated at a point upon an intracortical canal surface removes a volume of bone and replaces it with a smaller volume of bone enlarging the canal focally. The more rapid the remodeling, the greater the numbers of remodeling transactions removing more bone than subsequently deposited, leading to increased cortical porosity.
The rapidity of remodeling also lowers matrix mineralization as older, more mineralized bone is replaced with young, less mineralized bone. The younger bone undergoes rapid primary mineralization, but secondary mineralization, the enlargement of crystals deposited during primary mineralization, takes many months to complete.13-15 Thus, healthy postmenopausal women had lower MMD and higher cortical porosity than healthy premenopausal women. The correlation between MMD and porosity was likely to be the result of the rapidity of remodeling. The higher the remodeling rate, the higher the prevailing porosity and the lower the MMD.
These changes in bone microstructure and MMD were captured by the left shift in the mineral per voxel frequency distribution curve in the postmenopausal woman compared with the premenopausal woman. In the example of a premenopausal woman, more voxels occupied the right tail of the voxel distribution as more of the cortical bone volume was fully mineralized matrix and fewer voxels contained pores. In the elderly postmenopausal woman, the curve shifted left as there were more voxels containing pores or incompletely secondarily mineralized bone matrix and fewer voxels containing mineralized bone matrix volume.
In osteomalacia, the deficit in mineralization is due to both a reduction in primary mineralization and incomplete secondary mineralization. Early in the pathogenesis of osteomalacia, the reduction in intestinal calcium absorption is compensated for by secondary hyperparathyroidism, which increases the rate of bone remodeling maintaining serum calcium.15 In the longer term, secondary hyperparathyroidism results in renal phosphate loss, a fall in serum calcium, and the calcium-phosphate product so osteoid no longer undergoes primary mineralization.16 The subsequent increased rate of remodeling leads to increased cortical porosity as observed in the woman with osteomalacia.
In osteomalacia, distinguishing porosity and unmineralized matrix in the left tail of the curve is not possible, but the paucity of voxels on the right tail of the curve reflects paucity of voxels containing fully mineralized bone matrix or voxels with matrix mineral density at 80% or more of the attenuation produced by fully mineralized bone (1200 mgHA/cc), which is unlikely to contain a pore.6
The study has several limitations. Porosity is likely to have been overestimated in the setting of failed primary mineralization because voxels containing void cannot be distinguished from voxels containing osteoid that is devoid of mineral. Nevertheless, the reduction in the frequency of voxels in the right tail of the mineral per voxel distribution curve reflects the deficit of fully mineralized bone matrix that occurs in osteomalacia, not osteoporosis. MMD was studied in the compact cortical bone, not trabecular bone, so that comparison with iliac crest biopsy cannot be made. This method has not yet been used to examine the morphological basis of varying degree of vitamin D deficiency or insufficiency. Whether collinearity contributes to the strong association between porosity and matrix mineral density requires further study.
In summary and conclusion, noninvasive, low-radiation high-resolution peripheral computed tomography allows quantification of bone's MMD and microstructure in health and disease.17 The deficit in BMD in osteomalacia measured using bone densitometry is likely to be the result of a reduction in bone matrix volume due to bone loss producing high porosity and reduced trabecular density, a reduction in secondary mineralization as secondary hyperparathyroidism and rapid remodeling replace more fully mineralized bone with new, less fully mineralized bone, and of course a failure of primary mineralization. By contrast, in postmenopausal women and women with osteoporosis, mean MMD is normal or slightly reduced compared with healthy premenopausal controls due to high remodeling, but a substantial proportion of voxels contain fully mineralized matrix. This method is safe and facilitates follow-up of patients to assess treatment efficacy in rickets or other bone diseases accompanied by changes in MMD.
Disclosures
ES has received research support, lectured at national and international meeting symposia funded by Allergan, Amgen, Asahi, Genzyme, Merck Sharp & Dohme. He is a director of the board and shareholder in StraxCorp, is remunerated by StraxCorp as chief medical officer, and is one of the inventors of the StrAx1.0 algorithm. RZ has received grant and/or research support from Amgen, Merck Sharp & Dohme, Servier, Warner-Chilcott, AKP, Genzyme, Sanofi, GSK, and Pfizer. He is a shareholder in StraxCorp, is remunerated by Strax Corp as president of R&D, and is one of the inventors of the StrAx1.0 algorithm. RZ is also a director on the board of StraxCorp. CC has received grant and/or research support from Amgen, Merck Sharp & Dohme, Servier and Sanofi. AG and JZ have nothing to declare.
Acknowledgments
Authors’ roles: CC and ES wrote and revised the manuscript, XW performed statistical analysis, RZ and AG performed and analysed the HR-pQCT images, JZ provided clinical information.


