Diffusion of Hydrogen Peroxide Through Medical Grade Poly(Ether)urethane: Analyzing Mechanisms of Sorption and Transport to Support Sterilization With Vapor Phase Hydrogen Peroxide
Funding: This study was a joint effort between Medtronic and the Center for Devices and Radiological Health.
ABSTRACT
The United States Food and Drug Administration (FDA) recently announced an update to their 510(k) medical device sterility guidance to include vapor phase hydrogen peroxide (VH2O2) as an established ‘Category A’ sterilization process. This places VH2O2 in the same category as ethylene oxide (EO or EtO), which has demonstrated user and patient safety as well as microbiocidal effectiveness through scientific literature and FDA-recognized consensus standards. For some implantable medical devices, the sterilant chemistry must diffuse through the polymers of construction to access sealed parts of the finished assembly to achieve an appropriate sterility assurance level. Diffusion of EO through materials has been well established over decades of successful use. However, the ability of VH2O2 to diffuse through materials of construction has not been demonstrated. In this work, we measured the diffusivity and permeability of VH2O2 for a series of increasing durometer poly(ether)urethanes (PEUs) commonly used in the construction of single-use medical devices. The diffusion coefficients were 1 × 10⁻⁸ cm2/s for PEU75D, 2 × 10⁻⁸ cm2/s for PEU55D, and 5 × 10⁻⁸ cm2/s for PEU80A. The permeabilities were calculated to be 4.7 × 10⁻⁶ cm2/s and 1.3 × 10⁻⁵ cm2/s for PEU55D and PEU80A, respectively. For a typical cardiac or neuromodulation lead, the PEU80A wall thickness is on the order of 0.013 cm, resulting in penetration of hydrogen peroxide into the sealed construction in less than 10 min, a timeframe that is a fraction of the total sterilization cycle time.
1 Introduction
Vapor phase hydrogen peroxide (VH2O2) has been used as an alternative sterilant to ethylene oxide (EO or EtO) for single-use medical devices since the 1990s [1]. In the hospital setting, hydrogen peroxide has been used as an effective microbiocidal agent for reusable medical devices and room decontamination since the 1970s [1]. However, over 50% of single-use medical devices continue to be sterilized using EO. The use of VH2O2 sterilization for single-use medical devices has been impeded by a variety of factors: (1) until recently, there was no recognized consensus standard for the implementation of VH2O2 sterilization; (2) large-scale chambers and processes have not been available [1, 2]; and (3) lack of familiarity with the technology among sterilization providers and manufacturers of single-use medical devices. Recent advancements have largely removed these hurdles, opening the possibility for wide-scale adoption of VH2O2 sterilization.
The United States Environmental Protection Agency (EPA) recently issued a community engagement document regarding new standards for the use and emissions of EO [3, 4]. In the event that these changes impact commercial sterilizers, limiting capacity, the Food and Drug Administration (FDA) recognized the ISO 22441 standard for VH2O2 sterilization of medical devices [5] and classified VH2O2 as a Category A sterilization process [6, 7]. Together, these regulatory changes have encouraged medical device manufacturers to evaluate reregistering devices with VH2O2 sterilization technology when feasible.
VH2O2 has several advantages as a sterilization modality. First, VH2O2 exerts potent microbiocidal effectiveness against a wide range of organisms, including vegetative and bacterial endospores, fungi, and viruses. To achieve similar microbiocidal effectiveness, the required concentration for VH2O2 is two to three orders of magnitude lower than for EO [8]. The ability to use lower concentrations helps to mitigate potential hazards associated with sterilization. Second, hydrogen peroxide has a half-life of 24 h and decomposes to nontoxic products (water and oxygen) [2]. In contrast, the half-life of EO is 70–150 days [9]. The shorter half-life of hydrogen peroxide aids in the dissipation of residual sterilant in the product. The portion of hydrogen peroxide that absorbs into the product during sterilization exposure (i.e., the residuals) dissipates from the product more readily due to concurrent diffusion and molecular decomposition. By contrast, some products, when sterilized with EO, require significant aeration time to reduce the EO concentration [10]. Third, the operational concentrations of VH2O2 are well below the explosion limit, eliminating the need for explosion-proof rooms for sterilization chambers [11]. Finally, hydrogen peroxide is not classified as a human carcinogen [12].
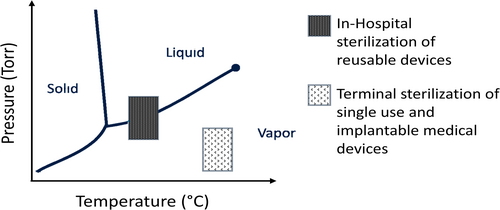
For complex medical devices such as neuromodulation and cardiac leads, which are long and thin conduits through which electrical energy is transferred to the tissue (e.g., brain or heart), the sterilant chemical must diffuse through the materials of construction because the lumens are often sealed, preventing the sterilant from traveling down the length of the lead. Due to similarity in molecular size [13-16], hydrogen peroxide and EO should theoretically have comparable diffusive and convective mobility. Despite the similar molecular dynamics, the widely held assumption in the sterilization industry is that hydrogen peroxide is predominantly a surface sterilant [17]. This assumption is largely based on hospital sterilization schemes for re-usable medical devices that operate over short exposure times (< 30 min) within the two-phase region of the phase diagram for hydrogen peroxide. Figure 1 depicts a generalized phase diagram for hydrogen peroxide sterilization, showing the region that hospital sterilization processes operate in comparison to the typical region for industrial sterilization processes (a more in-depth analysis of the phase diagram including specific operating conditions is shown in Figure S1). The processes used for VH2O2 industrial sterilization of single-use devices operate at slightly higher temperatures (~30°C vs. room temperature) and have much longer exposure times (1 h or longer) compared to in-hospital sterilization, resulting in a more uniform sterilant environment surrounding the product and ample time for diffusion to occur through sealed geometries.
The current study measured the transport of hydrogen peroxide and determined its diffusion and permeability coefficients into medical-grade poly(ether)urethanes (PEUs) of various durometers. Experiments were performed in the liquid state and in the vapor state. The results showed that diffusional transport was not conditional upon the phase state of the diffusant. The magnitude of the non-zero values for the permeability and diffusivity of VH2O2 illustrates that hydrogen peroxide can readily reach sealed areas within complex medical devices, such as cardiac and neuromodulation leads, during the timeframe of a typical VH2O2 sterilization process, thus making it an effective industrial sterilization method.
2 Materials and Methods
2.1 Materials
Three commercially available and commonly used poly(ether)urethane (PEU) polymers were analyzed. PEU80A (Pellethane, Lubrizol), PEU55D (Pellethane, Lubrizol), and PEU75D (Elasthane, DSM Biomedical) are distinguished by their durometer values on a Shore A or Rockwell D scale. The hardness differences are achieved during molecular synthesis by varying the proportions of hard segment (butanediol and methylene diphenyl diisocyanate) and soft segment (poly-tetramethyleneoxide). The polymer resins were dried at 37°C under vacuum for at least 24 h, then compression molded into films at 220°C. For the dynamic swell studies (liquid phase transport), 0.65 ± 0.3 mm thick polymer films were cut into 25 ± 5 mm diameter discs. For the membrane transport studies (vapor phase transport), 0.3 ± 0.1 mm thick polymer films were cut into 115 ± 10 mm diameter discs. All test specimens were vacuum dried to remove any absorbed water before exposure to hydrogen peroxide. Drying ensured accurate weight gain measurements and is not expected to impact the diffusional properties of the polymers studied because the hydrogen peroxide is introduced as a co-solvent with water, allowing for equilibrium quantities of water to quickly be re-established.
Three different durometers of PEU were exposed to hydrogen peroxide/water solutions, where concentrations ranged from 10% to 50% concentration. The 50 wt% (Sigma-Aldrich) and 30 wt% (Fisher Chemical) concentrations were commercially available. The 10 wt% solution was prepared by diluting the 50 wt% hydrogen peroxide with deionized water.
For the vapor phase membrane transport experiments, concentrations on both sides of the polymer membrane were measured using electrochemical sensors (Vaisala Peroxycap HPP2727). For the dynamic liquid state experiment, the weight gain of each polymer disc was monitored over time using a calibrated AX205 balance (Mettler Toledo).
2.2 Measurement of Diffusion and Permeability Coefficients via Vapor Phase Membrane Transport
A sealed chamber was constructed from 6-mm-thick clear acrylic material (Figure 2). The chamber was bifurcated into a donor and receiver chamber separated by the polymer test specimen. A door isolated the polymer membrane from hydrogen peroxide vapor until a stable concentration of hydrogen peroxide vapor was generated on the donor side. Stable hydrogen peroxide vapor was achieved by blowing a fan over a container of hydrogen peroxide (50 wt%). The receiver chamber was deliberately small to increase the signal for detection of the transported hydrogen peroxide. Experiments were performed at atmospheric pressure and room temperature (23°C ± 1°C, no heat supplied). Sensors on both sides of the polymer membrane recorded the hydrogen peroxide concentration as a function of time.

2.3 Calculation of the Diffusion and Permeability Coefficients via Vapor Phase Transport
The vapor phase permeability studies were repeated five times, where each experiment used a new polymer membrane.
2.4 Measurement of the Diffusion Coefficient via Liquid Phase Immersion Swell Studies
Vacuum-dried polymer discs were weighed (wp). Dried samples were immersed in 40 mL of hydrogen peroxide solution maintained at 22°C ± 1°C and monitored periodically for weight gain. The softest grade of PEU (PEU80A) was exposed to each of the three concentrations of hydrogen peroxide. The remaining samples (PEU55D and PEU75D) were exposed to only 50 wt% hydrogen peroxide.
The degree of swell for each polymer and hydrogen peroxide concentration was plotted as a function of time.
2.5 Calculation of the Diffusion Coefficient via Liquid Immersion
According to Fick's law, the concentration of diffusant is a function of both time and position, such that , where is the diffusion coefficient, is the concentration of the diffusant, is the time, and is the distance the diffusant has traveled into the polymer film. (Supporting Information has expanded derivations.)
To account for differences in polymer thickness, sorption plots were compared by normalizing the x-axis and plotting square root of time (t) divided by film thickness (), where film thickness was an average of several readings across the polymer disc.
3 Results
3.1 Vapor Phase Membrane Transport
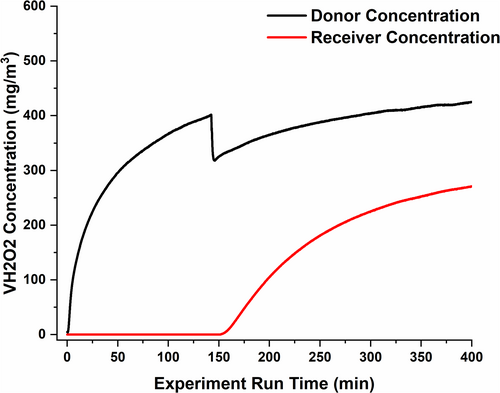
The donor and receiver VH2O2 concentrations for a representative vapor phase membrane transport experiment are plotted as a function of time in Figure 3. The hydrogen peroxide concentration on the donor side of the membrane decreased when the polymer membrane was exposed to VH2O2 by opening the receiver door. This abrupt drop was due to a small amount of additional contiguous volume in the chamber that was exposed upon opening the door.
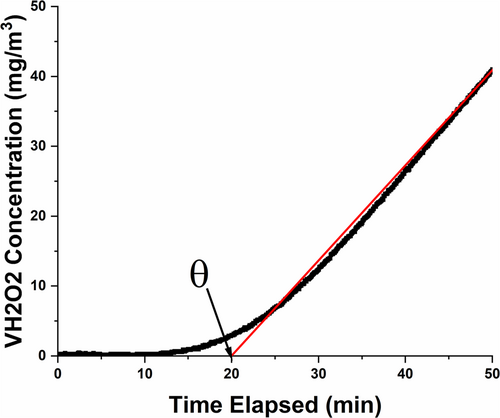
The linear portion of the receiver concentration curve was extrapolated to a hydrogen peroxide concentration of zero, as shown in Figure 4. The diffusion and permeability coefficients were calculated according to Equations 1 and 2.
The averaged values for the permeability, diffusivity, and partition coefficients from the vapor phase permeability experiments are summarized in Table 1 for PEU80A and PEU55D.
| Materials | Permeability P[=] cm2/sa | Diffusivity D[=] cm2/sa | Partition Ka |
|---|---|---|---|
| PEU80A (N = 5) | 1.3 ± 0.4 × 10⁻⁵ | 6.5 ± 1 × 10⁻⁸ | 200 ± 51 |
| PEU55D (N = 5) | 4.7 ± 1.2 × 10⁻⁶ | 2.7 ± 0.8 × 10⁻⁸ | 180 ± 49 |
- a See Supporting Information for non-averaged values.
3.2 Liquid Phase Immersion
The swell ratio as a function of time was plotted for PEU80A exposed to liquid hydrogen peroxide concentrations ranging from 0 wt% to 50 wt%, where 0 wt% hydrogen peroxide was 100% water, in Figure 5a. At equilibrium, the 50 wt% hydrogen peroxide swelled PEU80A, PEU55D, and PEU75D by 17.5 wt%, 12.5 wt%, and 9 wt%, respectively. These swell values were significantly greater than those reported for water, where the equilibrium swell for water was 2 wt% and 1.2 wt% for PEU80A [23] and PEU55D [24], respectively. The higher weight gain from incubation with hydrogen peroxide as compared to water was likely due to greater hydrogen bonding capacity, as PEU has several possible sites for hydrogen bonding. The increased hydrogen bonding capability can be intuited by the chemical structure and the higher boiling point, where a similar increase in solubility has been observed in other systems [25].
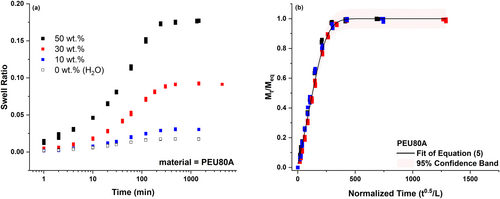
Weight gain data for PEU80A were plotted according to the solution to Fick's second law of diffusion (Equation 5), () as a function of normalized time () in Figure 5b. As expected, the data collected at varying concentrations of hydrogen peroxide collapsed to a single curve, because the diffusion coefficient is independent of solvent concentration.
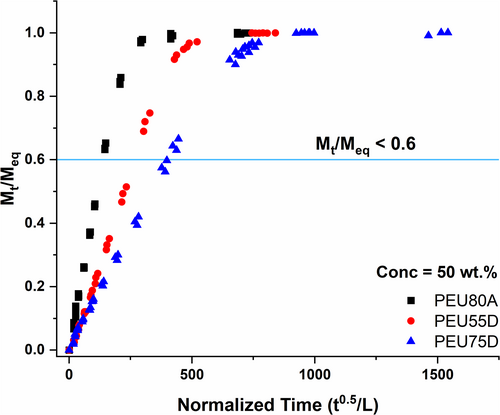
Given the improved signal-to-noise ratio for the higher concentration of hydrogen peroxide in the gravimetric measurements, the transport parameters for all additional grades of PEU were measured following exposure to 50 wt% hydrogen peroxide solutions. The sorption behavior, , was plotted for PEU80A, PEU55D, and PEU75D as a function of normalized time and adjusted for film thickness in Figure 6. Diffusion coefficients were determined from each slope using the short-time approximation, valid for < 0.6 (the indicated blue line), according to Equation 6.
The diffusion coefficients were measured using both the vapor phase and liquid phase methods. Results from both measurement methods are summarized in Table 2, and each method produced diffusion coefficients of the same order of magnitude. As expected, harder materials (PEU55D/PEU75D) showed slower transport than softer materials (PEU80A) [20, 26, 27].
| Materials | Dynamic swelling method (liquid) (22°C) D[=] cm2/s | Membrane transport (vapor) (23°C) D[=] cm2/s |
|---|---|---|
| PEU80A |
5.4 ± 1.0 × 10⁻⁸ (n = 9) |
6.5 ± 1.0 × 10⁻⁸ (n = 5) |
| PEU55D |
1.5 ± 0.1 × 10⁻⁸ (n = 12) |
2.7 ± 0.8 × 10⁻⁸ (n = 5) |
| PEU75D | 0.7 ± 0.1 × 10⁻⁸ (n = 3) | — |
Calculation of permeability from dynamic swell data sorption curves is complex. While the partition coefficient (K) can be directly calculated from the swelling data, the value will reflect equilibrium between the liquid and polymer phases, in contrast to polymer–vapor equilibrium. Moreover, at relatively high concentrations, such as those observed in the sorption experiments, K can be concentration dependent. However, we can estimate K values for polymer–vapor equilibrium based on the dynamic swell data using established thermodynamic relationships (see Supporting Information). Specifically, if we assume both the liquid and vapor phases behave ideally and the chemical potential of the hydrogen peroxide in the polymer phase can be described by the Flory–Huggins theory of mixing, we can predict K values based on the equilibrium swelling data. These values are shown in Table 3 along with the K values derived from the vapor phase membrane transport experiments.
| Materials | Dynamic swelling method (liquid) (22°C) K | Membrane transport (vapor) (23°C) K |
|---|---|---|
| PEU80A |
216 ± 42 (n = 3) |
200 ± 51 (n = 5) |
| PEU55D |
181 (n = 1) |
180 ± 49 (n = 5) |
The relative permeability is a product of the diffusion and partition coefficients. Our observations suggest substantial permeability for all PEU grades studied, which is evidence that hydrogen peroxide can readily permeate these materials to sterilize the sealed volumes of a polymeric medical device.
4 Discussion
The diffusion coefficients of hydrogen peroxide into various grades of PEU were determined from ambient vapor phase membrane transport experiments and compared with those extracted from dynamic swell experiments conducted in the liquid state. The results (Table 2) showed that both methods of measurement resulted in comparable diffusion coefficients and agreed with results previously reported by Tjell and Almdal [28] for water-swelled poly(ether)urethane membranes. The diffusion coefficients determined in this study are plotted as a function of phase state and material type in Figure 7.
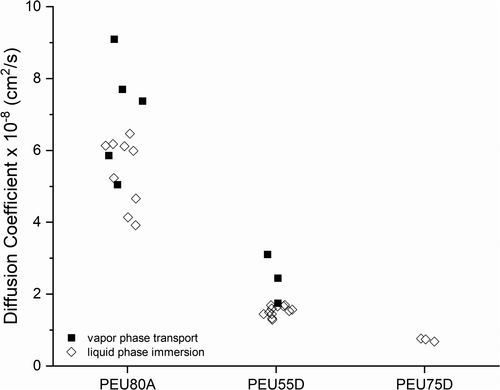
The convergence of diffusion coefficients for the vapor transport and liquid swell methods was expected. Small molecules, such as hydrogen peroxide, must adsorb onto the polymer surface, transport through the polymer bulk, and desorb from the polymer surface to permeate the material. The transport kinetics of this process are based on the movement of individual molecules, and these dynamics are not based upon the phase of the sterilant (liquid vs. vapor) prior to absorption. Furthermore, it has been shown that lower pressure, the operating condition of industrial sterilization processes, does not significantly impact the diffusion coefficient [29]. Our results showed that the use of the liquid swell method for the determination of the diffusion coefficient is a simple and straightforward method to screen materials of construction for the suitability of the VH2O2 sterilization process when device construction contains sealed volumes that require permeation.
The diffusion coefficient alone can be used to estimate transport time of hydrogen peroxide through a polymer used in the construction of a medical device. For example, a typical wall thickness of a poly(ether)urethane-covered sheath of a neuromodulation or cardiac lead is 0.013 cm. Given that the thickness is small relative to the radius of the poly(ether)urethane cylindrical structure, the surface can be approximated as a thin, flat slab for estimating hydrogen peroxide diffusion. Therefore, the time required for the sterilant chemical to reach the inner surface of the lead (Ɵ) can be calculated using Equation 1 for the measured values of the diffusion coefficient (D). For a lead constructed of PEU75D (D = 1 × 10⁻⁸ cm2/s), PEU55D (D = 2 × 10⁻⁸ cm2/s), or PEU80A (D = 5 × 10⁻⁸ cm2/s) with a wall thickness of 0.013 cm, transport times would be 45, 25, and 10 min, respectively. Given that typical VH2O2 industrial sterilization cycles include 2–4 h of sterilant exposure, the sterilant would have sufficient time to reach sealed volumes within medical devices using these materials.
5 Conclusion
Mass transport of hydrogen peroxide into PEU was studied using the vapor phase time-lag method and liquid phase swell experiments. Diffusion and permeability coefficients were determined from analytical fits using the full series expression for Fickian diffusion with good correlation. Neither hydrogen peroxide concentration nor phase state impacted the diffusion coefficient. While phase state did not impact diffusivity, it may impact the microbiocidal efficacy if the concentration of the sterilant is insufficient. Given that the diffusion coefficient is non-zero and the hydrogen peroxide swelled the PEU materials (i.e., solubility is non-zero), hydrogen peroxide will diffuse through the PEUs evaluated during a typical VH2O2 sterilization cycle. The methods herein serve as a tool to estimate the minimum contact time required for diffusional transport. The non-zero diffusion and permeability coefficients demonstrate that when PEU materials form sealed volumes within the medical device, VH2O2 can access these volumes, and as such an effective sterilization process can be developed.
Acknowledgments
This project was supported in part by an appointment to the Research Participation Program at the Center for Devices and Radiological Health administered by the Oak Ridge Institute for Science and Education through an interagency agreement between the US Department of Energy and the US Food and Drug Administration. Study design and execution, data analysis, and authorship of the manuscript were performed at the discretion of the authors of the manuscript without additional influence.
Disclosure
The mention of commercial products, their sources, or their use in connection with material reported herein is not to be construed as either an actual or implied endorsement of such products by the Department of Health and Human Services. Additionally, this manuscript is not a formal dissemination of information by the FDA and does not represent Agency position or policy.
Conflicts of Interest
The authors declare no conflicts of interest.
Open Research
Data Availability Statement
The data that support the findings of this study are available from the corresponding author upon reasonable request.


