Revealing the nexus between oil and exchange rate in the major emerging markets—The timescale analysis
Abstract
This paper investigates the interrelationship between Brent oil price and exchange rate in 10 emerging markets of East Europe, Asia, Africa, and South America. For computational purpose, we apply two innovative methodologies—wavelet coherence and phase difference that are capable of observing different frequency scales. Wavelet coherence results suggest that strong coherence is present during world financial crisis (WFC) in the oil-exporting countries and in majority of the oil-importing countries. Phase arrows as well as phase difference suggest negative coherence between oil and exchange rates in the oil-importing countries during WFC. Negative coherence is found in these countries because currency depreciation was accompanied by immense oil price drop in WFC period. In addition, phase difference has relatively stable in-phase dynamics in long term in the oil-importing countries during tranquil periods, which confirms theoretical stance that higher oil prices cause currency depreciation and vice versa. As for the oil-exporting countries, we find constant and relatively long-lasting anti-phase pattern in Russian and Nigerian cases for long-term horizons but not for Brazilian one.
1 INTRODUCTION
The extreme oil price swings in the last decade have been instigated by the changing global oil demand and supply, increased commodity financialization, global financial crises, and the behaviour of speculators (see Bein & Aga, 2016; Derviz, 2011; Mirović, Živkov, & Njegić, 2017; Novotny, 2012; Rafiq, 2011; Shamsollah & Maryam, 2011; Yildirim, Ozcelebi, & Ozkan, 2015; Zhang, Fan, Tsai, & Wei, 2008; Živkov, Njegić, & Momčilović, 2018). The oil price is one of the most important determinants for national economic performance, thus proper understanding of the interdependencies between crude oil and foreign exchange markets stands as a key interest for various market participants such as investors, arbitragers, currency traders, policymakers, risk managers, and so forth. The interconnection between oil and national exchange rate is intertwined, whereby oil prices affect both oil-importing and oil-exporting countries but in different ways. An increase in the oil price raises the cost of domestic production in the oil-importing countries, aggravates the competitiveness of domestic goods, and worsens current account, which eventually leads to exchange rate depreciation. For oil-exporting countries, the reverse scenario is valid, because raising oil revenues, due to increased oil price, provide a significant supply of foreign currency in domestic system, which eventually influences domestic currency to appreciate. Oil-exporting emerging markets are especially vulnerable when oil prices have tendency to fall, because oil is a key source of the government revenue, whereas decrease in the oil price puts a pressure on the countries' ability to meet their spending obligations. As a consequence, domestic financial markets could become more unstable as international investors commence to withdraw their capital from these countries, which pushes domestic currency to depreciate.
According to Pershin, Molero, and de Gracia (2016), oil-exchange rate research is becoming more relevant because GDP in emerging economies is increasing, as well as their oil consumption. The Energy Information Administration (2014) report is in line with this assertion, and it stated that most of the oil consumption growth happens due to the increased demand in emerging countries, whereby these economies already account for more than a half of world total oil consumption. Volkov and Yuhn (2016) contended that dramatic decrease in the oil prices in 2014 revived an interest in the interdependence between the oil prices and the exchange rates of emerging markets. Although many researchers have paid considerable attention to the linkage between oil and exchange rate, most of them addressed this issue only via time dimension, disregarding the frequency domain features, which is an important aspect for observation at different time horizons. Conlon and Cotter (2012) explained what might be the possible cause. They explained that the sample reduction problem arises when researchers try to match the frequency of data with different time horizons, thus the multiscale analysis in economy has been little studied in general. Huang (2011) further asserted that this issue could be very important, because strength of connection between markets could vary across different timescales. Therefore, observing the characteristics in frequency dimension can help in better comprehension of complex patterns that exist between two financial variables.
Because emerging markets are the biggest oil consumers in the world, and, at the same time, some of them are the biggest oil producers, we endeavour to conduct an in-depth analysis of the dynamic nexus that exist between oil and 10 exchange rates of emerging markets, which pursue flexible exchange rate policy. For research purposes, we consider the following major emerging markets—Russia, Turkey, India, South Korea, Indonesia, South Africa, Nigeria, Brazil, Poland, and the Czech Republic. Russia, Brazil, and Nigeria are treated as oil-exporting countries, whereas others are observed as oil-importing countries. These countries are among the largest emerging markets according to their nominal GDP, and this is a decisive factor for selecting them. Table 1 contains the level of nominal GDP of these countries, whereby all countries are listed according to the size of their nominal GDP.
| IND | BRA | RUS | KOR | IDN | TUR | POL | NGA | ZAF | CZE | |
|---|---|---|---|---|---|---|---|---|---|---|
| GDP | 2,848 | 2,138 | 1,719 | 1,693 | 1,075 | 909 | 614 | 408 | 371 | 252 |
| GR | 7 | 9 | 11 | 12 | 16 | 18 | 22 | 31 | 34 | 75 |
- Note. Nominal GDP values are according to the International Monetary Fund. GR: global rank.
- BRA: Brazil; CZE: The Czech Republic; IDN: Indonesia; IND: India; KOR: South Korea; NGA: Nigeria; POL: Poland; RUS: Russia; TUR: Turkey; ZAF: South Africa.
Taking into account everything that has been said previously, the aim of the paper is to thoroughly explain the nexus between oil and the exchange rates via various time horizons in both oil-exporting and oil-importing countries. In order to decompose the time–frequency effects and to meticulously investigate the dynamic interconnectedness between these assets, we apply the wavelet coherence (WTC) method. This particular technique is capable of unravelling the interactions that can be hardly seen by any other traditional econometric tool. This model-free approach does not rely on parameters nor depends on the estimation method, and at the same time, it circumvents the problem of sample size reduction, that is, computation is done without loss of valuable information. Following recent studies such as Barunik and Vacha (2013), Lee and Lee (2016), Altar, Kubinschi, and Barnea (2017), Njegić, Živkov, and Damnjanović (2017), and Živkov, Balaban, and Đurašković (in press), we utilize this method for our research. In addition, we consider phase difference approach of Aguiar-Conraria and Soares (2011) to further enrich our findings. Because oil-exchange rate nexus usually come to the fore at longer time horizons, and this is especially true for the oil-importing countries, we utilize this method to determine the nature of the nexus at long term. This complementary methodology provides an information regarding the lead/lag relationship between oil and the selected currencies and can suggest from which market spillover shocks originate at different timescales. Dajčman (2013) explained that if one time series leads the other one, then its realizations may be utilized to forecast the realizations of the lagging time series, which is of utter interest for various market agents. To the best of our knowledge, this is the first study that investigates the oil–exchange rate nexus in the time–frequency framework in a broad sample of oil-exporting and oil-importing emerging markets. This paper also provides an insight about the lead (lag) relations at longer time horizons via phase difference methodology, which remains hidden thus far. This study can be useful for investors with very short-term horizons (e.g., day traders and chartist), whose decisions are largely driven by sporadic events, market sentiment, or psychological factors. On the contrary, long-time agents (e.g., mutual funds and big institutional investors) can also benefit from this study, because they are keen to understand macroeconomic fundamentals, because their investment activities are related to long-term developments.
Besides Section 1, this paper is structured as follows. Section 2 presents brief literature review. Sections 3 and 4 contain methodological approach and dataset. Section 5 reveals the WTC results, whereas Section 6 discloses phase difference findings. Section 7 provides concluding remarks.
2 BRIEF LITERATURE REVIEW
Academic literature has given much attention to the relationship between exchange rates and oil in recent years, but yet there is no clear-cut conclusion. Taking into account oil-importing countries, Lizardo and Mollick (2010) disclosed that an increase in the real price of oil causes exchange rate depreciation of oil-importing Japan. Ghosh (2011) investigated the case of India, using the GARCH and EGARCH models, and revealed that an increase in the oil price return leads to the depreciation of Indian rupee. The study of Fowowe (2014) empirically showed that increase in the price of oil causes depreciation of the South African rand/USD.
As for oil-exporting countries, Basher, Haug, and Sadorsky (2016) reported significant exchange rate appreciation pressures in oil-exporting economies after oil demand shocks, because these shocks can affect country's terms of trade. Mensah, Obi, and Bokpin (2017) investigated the long-run dynamics between oil price and the bilateral U.S. dollar exchange rates for a group of oil-dependent economies before and after world financial crisis (WFC). They selected the following exchange rates—euro, Indian rupee, Russian rouble, South African rand, Ghanaian cedi, and the Nigerian naira. They found that long-run equilibrium relationship exists between oil price and exchange rate, especially for currencies of the key oil-exporting countries. Also, they revealed that relationship is more evident in the post-crisis period.
The paper of Ahmad and Hernandez (2013) analysed both oil-importing and oil-exporting countries. They sought the existence of long-run relationship between real oil prices and real exchange rates in 12 major oil-exporting and consuming countries, using the non-linear models—threshold auto-regressive (TAR) and its variant momentum threshold auto-regressive (M-TAR). Their results provided an evidence of cointegration in five of these countries—Brazil, South Korea, Mexico, Nigeria, United Kingdom, as well as in Eurozone. They found that Brazil, Nigeria, and United Kingdom are subject to much higher adjustment after a positive shock to the system than after a negative shock. They concluded that appreciation in real exchange rates is eliminated much faster than depreciation of the same magnitude. According to their results, these countries are much more tolerant of a depreciation rather than an appreciation when driven by changes in oil prices. The Eurozone shows the opposite behaviour, whereby the adjustment is much faster after a negative shock to the system than after a positive shock.
Very few academic papers among the extant literature examined time–frequency connection between oil and exchange rates. One of these studies is the paper of Yang, Cai, and Hamori (2017) who examined the co-movement between the crude oil price and the exchange rate of 10 leading oil-exporting and oil-importing countries (Brazil, Canada, Mexico, Russia, the European Union, India, Japan, and South Korea) employing the WTC framework. They revealed that the degree of co-movement between the crude oil price and the exchange rates deviates over time and scales. Additionally, they found strong but not homogenous links around the year 2008 for all examined countries and from 2005 onwards for the oil-exporting countries. Their results indicated that the strong interdependence area is limited for the oil-importing countries. Uddin, Tiwari, Arouri, and Teulon (2013) did a research regarding the cohesion between oil prices and exchange rates in Japan, analysing time–frequency space between these assets. They reported that the strength of the relationship between oil price and exchange rate keeps changing over the time horizon. Bouoiyour, Selmi, Tiwari, and Shahbaz (2015) examined the nexus between oil price and Russia's real exchange rate, using monthly data. They detected sharp causality running from oil price to real exchange rate in lower frequencies. In that manner, they concluded that Russia should pay more attention to reduce its energy dependency via drastic and proactive economic measures.
3 METHODOLOGY
3.1 Wavelet coherence
 (1)
(1) , wherein Wx and Wy are the wavelet transforms of x and y, respectively. The squared WTC coefficient is given as follows:
 (2)
(2)3.2 Phase difference
 (3)
(3) and ℜ are the imaginary and real parts, respectively, of the smooth power spectrum. Phase difference between two series (x, y) is indicated by vector arrows on the WTC plots. Vacha and Barunik (2012) explained that right (left) pointing arrows suggest that the time series are in-phase (anti-phase), that is, positively (negatively) correlated. If arrows point to the right and up, the second variable is lagging, and if they point to the right and down, the second variable is leading. Reversely, if arrows point to the left and up, the second variable is leading, and if arrows point to the left and down, the second variable is lagging.
In addition, our intention is to explain oil–exchange nexus in the long run, because some amount of time need to pass before international price competitiveness aggravates (gets better) due to rising oil prices in oil-importing (oil-exporting) countries, which worsens (improves) country's export and eventually causes exchange rate depreciation (appreciation). In that sense, we apply the method of Aguiar-Conraria and Soares (2011), which can determine average phase position at specific frequency band. This technique bypasses deficiencies of phase arrows, which frequently change direction in lower coherence areas in WTC plots, preventing in that way researchers to properly determine the direction of the coherence throughout observed sample. According to these authors, if ϕxy ∈ (π/2, 0) ∪ (0, −π/2), then the series move in phase. If phase difference is in realm (π/2, 0), then the time-series y leads x. The time-series x leads y if ϕxy ∈ (−π/2, 0). An anti-phase situation, that is, negative correlation, happens if we have a phase difference in area ϕxy ∈ (−π/2, π) ∪ (−π, π/2). If ϕxy ∈ (π/2, π), then x is leading. Otherwise, time-series y is leading if ϕxy ∈ (−π, −π/2). Phase difference of zero indicates that the time series move together, analogous to positive correlation, at the specified frequency.
4 DATASET
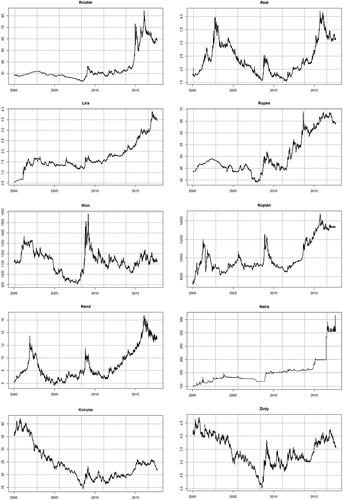
For research purposes, we use daily closing prices of spot Brent oil and the selected currencies, which is observed vis-à-vis USD—Russian rouble, Turkish lira, Indian rupee, South Korean won, Indonesian rupiah, South African rand, Nigerian naira, Brazilian real, Polish zloty, and Czech koruna. Following Pershin et al. (2016), since we use daily data, we observe nominal exchange rates, so there is no need to deflate them by the local consumer price index in order to convert to the real exchange rates. We opt for Brent oil because this energy commodity is one of the most traded oils in the current global oil market, thus it follows the evolution of the global oil prices in a great deal (see Wlazlowski, Hagströmer, & Giulietti, 2011). All daily prices are transformed into log returns according to ri,t = 100 × log (Pi,t/Pi,t − 1), where ri,t is the market return and Pi, t is the closing price of particular currency or Brent oil at time (t). The sample covers the period from January 1, 2000 to August 31, 2017, and all data were obtained from Datastream. Employing WTC and phase difference methodologies, we investigate the dynamic nexus in different frequency levels. The obtained results will serve well for various economic agents who invest at different time horizons. Different time horizons correspond to Scale 1 (2–4 days), Scale 2 (4–8 days), Scale 3 (8–16 days), Scale 4 (16–32 days), Scale 5 (32–64 days), Scale 6 (64–128 days), Scale 7 (128–256 days), and Scale 8 (256–512 days). First four scales observe short-term dynamics, midterm is represented by fifth and sixth scales, whereas seventh and eight scales correspond to long-term dynamics. Figures 1 and 2 depict empirical movements of the selected exchange rates and Brent oil price, respectively.

5 WTC RESULTS
This section presents the results of WTC1 between the Brent oil price and 10 selected exchange rates. As for WTC plots, horizontal axis contains time component in our WTC plots, whereas the left vertical axis represents frequency component, which goes up to eighth scale (512 days). The strength of the co-movement between each of the selected assets can be seen via colour surfaces, whereby blue and green colours indicate low coherence, whereas warmer colours suggest higher coherence. The colour pallet is depicted at right y-axis, and it ranges from 0 to 1. The cone of influence marks the area of statistical significance at 5% level. This curved boundary delimits the region of the wavelet spectrum, which is influenced by the edge effects. Torrence and Compo (1998) contended that the edge effects become important beyond the cone of influence; hence, these values should be interpreted with great caution.
Figure 3 summarizes the WTC plots between Brent oil price and 10 selected emerging market currencies. It is obvious that degree of co-movement between the crude oil price and the exchange rates differs over time and across the scales, which coincide with the findings of Turhan, Hacihasanoglu, and Soytas (2012). Observing high frequency scales, it can be noticed that dark red areas that coincide with the high correlation are not present in short term (low scales). It applies for three oil-exporting countries as well as for all oil-importing countries. Low coherence findings in all Brent–exchange rate pairs at short-time horizons can be interesting from the portfolio diversification point of view. In other words, according to all WTC plots, short-term investors in Brent oil can couple this commodity with exchange rate of all selected emerging markets, and as a result, they will achieve diversification benefits, because very low coherence exists between these two assets up to 8-day horizon, even in turbulent times.
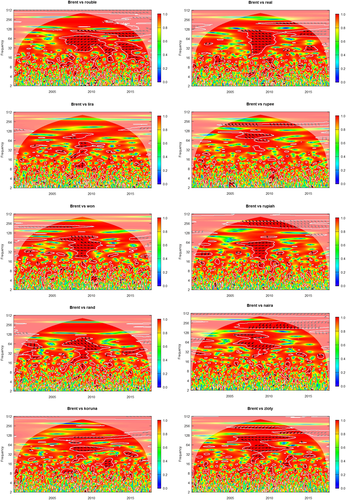
However, from 32 days and onwards, we find the areas of high coherence in some WTC plots, and it particularly applies for the period of WFC turmoil. The obvious examples are rouble, real, naira, won, rupiah, rand, and zloty. Our results coincide with the findings of Yang et al. (2017) and Lin, Chen, and Yang (2016), who applied the same methodology and found stronger interdependence between oil and exchange rate in 2008–2010 period. At the same time, these studies also reported that high coherence areas proved to be non-existent in the periods before and after WFC at all wavelet scales, which is in line with our findings. These results are quite indicative and suggest that higher correlation between oil and exchange rates are probably the aftermath of a common rather than idiosyncratic events. In other words, high coherence is detected because both oil and currency markets were hit hard by the uniform extreme market occurrences during WFC. In addition, Turhan, Sensoy, and Hacihasanoglu (2014) explained that possible reason for tremendous oil slump during WFC is the increased use of oil as a financial asset and the fact that both financial and product markets get significantly more integrated in last decade. Adams and Glück (2015) added that phenomenon known as financialization of commodity markets affected negatively oil movement during WFC, because frightened investors started to hastily leave the oil market in this period and move their funds into safer investments, such as gold. On the other hand, some authors, such as Živkov, Njegić, and Mirović (2016), found the evidence that international investors had a strong tendency to abandon stock markets in emerging economies due to increased uncertainty during the WFC period. This type of happenings caused abrupt and steep currency depreciations in many emerging markets (see, e.g., Živkov, Njegić, & Milenković, 2015). As an overall effect of these events, we find strong coherence in majority of scrutinized emerging markets during WFC.
It is interesting to see that in Brent versus rouble case, we find more widespread dark red areas in comparison with all other oil-importing countries as well as two oil-exporting countries—Brazil and Nigeria. Figure 3 clearly indicates that, in the Russian case, the dark red areas are also found around 2015 at relatively high frequencies. The explanations for such findings can be found in the developments in oil market from the mid-2014. Weak global oil demand, robust oil supplies, and significant U.S. dollar appreciation caused severe oil price drop in 2014–2015 (see Figure 2). Because Russian economy is highly energy-export oriented, whereas the share of oil in primary energy exports is approximately 50% (see Bhar & Nikolova, 2010), the plummeting oil price consequently led to a violent rouble depreciation in 2015 (see Figure 1). Dreger, Kholodilin, Ulbricht, and Fidrmuc (2016) added that sanctions imposed by Western countries can be another factor behind Russian currency devaluation. As for the oil-importing countries, areas of high coherence in that period are also found in South Africa and the Czech Republic, but these areas are not large as in the Russian case.
The majority of phase difference arrows point to left, in high coherence areas during WFC, which indicates to anti-phase situation, regardless of whether we are talking about the oil-exporting or the oil-importing countries. This is expected situation for Russia, Brazil, and Nigeria as oil-exporting countries, because lower oil price reduces oil revenues, mitigates USD inflows in their economies, and consequently causes exchange rate depreciation (see, e.g., Fedoseeva, in press). However, these occurrences are inherent for all oil-importing countries as well, which could be somewhat odd, because oil-importing countries normally favour lower oil prices. Our negative coherence findings in the oil-importing countries during turbulent periods support the claim that these happenings are probably an aftermath of a common rather than idiosyncratic events in the oil and the exchange markets during WFC. As have been said earlier, when markets are under extreme stress, international investors abandon emerging economies and sell domestic currencies. This type of behaviour causes abrupt and heavy depreciations of these currencies, and this kind of scenario happened in our analysed oil-importing countries during WFC. Figure 4 depicts net capital inflows to major emerging market economies since 2000, and it can be seen that net capital inflows recorded steep drop during WFC, which speaks in favour of assertion that global investors leave emerging economies in stressful times.
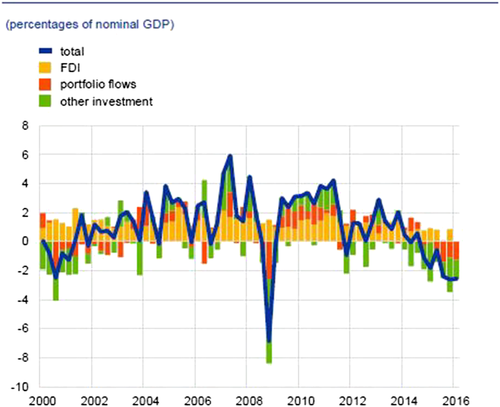
In other words, it can be said that significant capital outflows overpowered heavily the positive effect of oil price drop in the oil-importing countries during this crisis, which we eventually record as strong negative coherence. In addition, some phase arrows are tilted to up or down, and these arrows carry the information about the lead–lag relationship between observed assets. For instance, in Russian case during the WFC, phase arrows point to left-down direction in midterm horizon (32–64 days), which suggests that rouble lags Brent oil price. In other cases, such as Brent–won, Brent–rupee, and Brent–rand, arrows point to left-up at higher scales, which is a sign that currencies have a leading role.
6 PHASE DIFFERENCE RESULTS
In order to reveal the cause–effect relationships between Brent oil price and exchange rates in long term, this section presents phase difference2 results, calculated for 128–512 days' time horizon. Although WTC plots bear some information regarding the phase-direction and the lead–lag relationship between analysed series, it can be seen only in strong coherence areas, whereas in other, lower coherence regions, phase arrows shift direction constantly, without a common and stable behaviour. Thus, it is difficult for researchers to distinguish which variable lagging and which one leading at lower coherence areas. Phase difference approach is useful because it carries the information regarding the direction of the coherence, discloses the average lead (lag) relationship dynamics through the entire sample period, and ultimately indicates from which market spillover shocks originate. However, because strong minimal phase difference does not exist under low dependency, we only calculate phase difference in long term, that is, 128–512 days, whereas results for short term are omitted. Figure 6 contains phase difference plots for long-term frequency band. For the correct interpretation of phase difference plots, it is important to know which variable is first and which one is the second in the computation process. The caption of individual phase difference plots in Figure 6 is constructed to indicate the time-series order of this process, whereas Figure 5 graphically summarizes the relations between Brent oil price and exchange rates via phase difference circle.
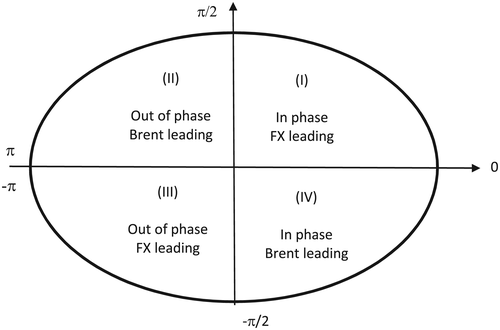
Figure 6 indicates that phase differences do not have conspicuous frequent oscillations at long-term horizon but pretty much stable and relatively long-lasting dynamics in most cases. It is apparent that in all oil-importing countries, phase difference predominantly moves between −π/2 and π/2 (positive coherence) in the long run, which is line with the theoretical explanation that higher oil prices cause currency depreciation and vice versa. This particularly applies for the following pairs—Brent–lira, Brent–rupee, Brent–rand, and Brent–koruna. For these countries, it means that pros (cons) from the cheaper (more expensive) oil and its effect on exchange rate is apparent in the long run. These results coincide with studies of Ghosh (2011) and Fowowe (2014) who investigated cases of India and South Africa, respectively, and revealed that increase in the oil price return leads to the depreciation of Indian rupee and South African rand. Also, it is apparent that the leading (lagging) role between Brent and the selected exchange rates changes from time to time, which points to bidirectional causality from oil prices to exchange rates and vice versa, which is in line with the findings of Dreger et al. (2016).
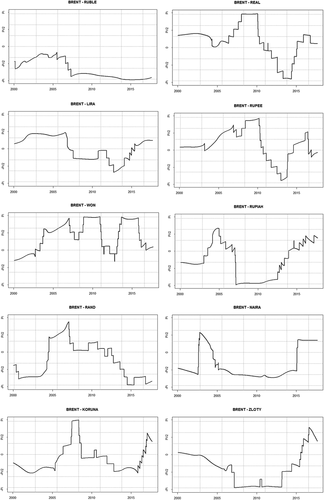
It should be mentioned that we find an anti-phase situation during WFC, and it is particularly apparent in cases of rupee, won, koruna, rupiah, and zloty. In rupee, won, and koruna plots, Brent has the leading role, whereas in cases of rupiah and zloty, these currencies have an upper hand. The phase difference findings coincide with the WTC results, and it confirms that extreme market occasions, that is, capital outflows and oil price drop during WFC, were the primary causes for negative coherence between Brent oil price and the exchange rates in these oil-importing countries. In other words, significant capital flight from emerging markets prevail over the favourable oil price drop during WFC, which we eventually record as negative coherence in our WTC and phase difference plots.
On the other hand, the results are mixed for the oil-exporting countries. For instance, in Brent–rouble case, phase difference has stable value since 2007 that ranges between −π/2 and −π, which is an indication of negative coherence, whereby rouble constantly has a leading role. These findings are different from the WTC results, in which phase arrows indicate leading role of Brent. However, our phase difference implies very long period (128–512 days), whereas leading role of Brent is found for midterm horizon (32–64 days) in WTC plot. On the contrary, we find an in-phase pattern between Brent and rouble from 2001 to 2007, which is characteristic for oil-importing countries but not for oil-exporting countries. Rationale lies in the fact that Russia performed tight management till 2008 and greater exchange rate flexibility afterwards, so rouble was not allowed to appreciate (depreciate) according to the rise (fall) of the oil prices. From the time when rouble started to move relatively freely (year 2008), we disclose constant anti-phase situation from that year in long-term horizon, whereas in-phase pattern is dominant before that year.
In case of Brent–real, we reveal anti-phase dynamics only during WFC, with leading role of Brent and, around 2014, with leading role of real. In all other time periods, phase difference moves between π/2 and −π/2, which signals positive coherence. Although Brazil is net exporter of oil, its phase difference pattern in the long run is closer to oil-importing countries.
In case of Brent–naira, phase difference plot indicates an anti-phase position between 2005 and 2015, with leading role of Nigerian currency. This is much more in line with the Brent–rouble findings, and this is a general characteristic of oil-exporting countries. Taking into account the fact that Nigeria is sixth largest net oil exporter, whereby Nigeria generates significant foreign exchange revenues via oil export, this result is expected. On the other hand, Brazil is in 24th place of net oil-exporter list, and its dependence on petrodollars is much smaller than in the cases of Nigeria or Russia, which is second net oil exporter in the world.3 Therefore, Brazil has different phase difference features from Russia and Nigeria.
All these findings, regarding both oil-importing and oil-exporting countries, are in line with the contention of Yang et al. (2017), who claimed that most phase patterns for the oil-exporting countries are anti-phase, indicating a negative relationship between the returns in oil price and exchange rates, whereas the patterns of the oil-importing countries are more in-phase, which suggests positive nexus.
7 CONCLUSION
This paper investigates the interconnection between Brent oil price and exchange rate in 10 major emerging markets in terms of coherence strength and their lead–lag relationship. The nexus is observed via different time horizons, and for research purposes, we use two innovative methods—WTC and phase difference.
Our WTC findings indicate that strong coherence occurs during extreme market distress, whereby common and widespread event, such as WFC, affected both markets simultaneously, causing exchange rate depreciation and oil price slump. This kind of developments is found in all oil-exporting countries and in majority of oil-importing countries but in lesser extent. According to WTC plots, the least affected exchange rates by the oil price swings are Turkish lira and Indian rupee. We find left-pointing phase arrows in high coherence areas in both oil-exporting and oil-importing countries, which indicates an anti-phase situation. Negative coherence between oil and exchange rate can be commonly found in oil-exporting countries, but during WFC, huge capital outflows overshadowed the favourable effect of oil price drop in the oil-importing countries, which caused currency depreciation.
Phase difference has stable and relatively long-lasting shape in long term (128–512 days) in the oil-importing countries, and it moves predominantly between −π/2 and π/2. It coincides with the theoretical explanation that higher oil prices cause currency depreciation, and vice versa, in oil-importing countries. As for Russia and Nigeria, we find constant and long-lasting anti-phase situation in the long-term horizon, which is a general characteristic for oil-exporting countries. As for Brazil, we find anti-phase dynamics only during WFC and around 2014, whereas in all other time periods, phase difference moves between π/2 and −π/2, which signals positive coherence. Although Brazil is net exporter of oil, its phase difference pattern in the long run is closer to oil-importing countries.
Our results could help monetary authorities and international investors alike. It applies particularly for Russian and Nigerian cases, because WTC and phase difference results show the evidence of strong and relatively stable anti-phase situation that characterize Brent–rouble and Brent–naira nexus. Therefore, this finding could help monetary authorities to better tackle the transmission mechanism of oil price shocks towards exchange rates, which can harm exports of these countries. The results also have implications for international investors in these emerging markets, because the strength of oil–exchange rate nexus as well as their lead–lag relationship could suggest global investors what particular attention they need to pay in the process of portfolio designing.
ENDNOTES
- 1 All WTC calculations were done via “R” software, using “WaveletComp” package.
- 2 The results are obtained by applying ASToolbox in “R” software of Aguiar-Conraria and Soares (2011).
- 3 The data about the net oil export are according to The World Factbook report in 2016.


