Immunoglobulin-like transcript 5 polarizes M2-like tumor-associated macrophages for immunosuppression in non-small cell lung cancer
Huijun Xu, Xuebing Fu, and Shuyun Wang contributed equally to this work.
Abstract
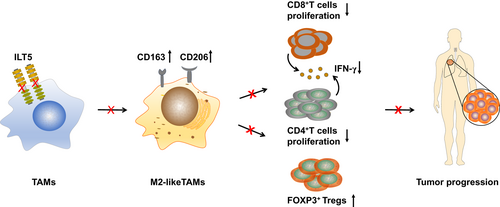
Immune checkpoint inhibitors (ICIs) have shifted the treatment paradigm of non-small cell lung cancer (NSCLC) over the last decade. Despite notable therapeutic advancements in responders, the response rate remains limited owing to the immunosuppressive tumor microenvironment (TME). Therefore, to improve the efficacy of ICIs, it is essential to explore alternative targets or signals that mediate immunosuppression. Immunoglobulin-like transcript (ILT) 5 is a negative regulator of immune activation in myeloid cells. However, the expression and function of ILT5 in NSCLC remain unknown. Here, we found that ILT5 was highly expressed in tumor-associated macrophages (TAMs) of NSCLC tissues and predicted poor patient survival. Functionally, ILT5 induces the M2-like polarization of TAMs, which subsequently decreases the density of T cells, and increases FOXP3+T cell accumulation, leading to an immunosuppressive TME. The combination of ILT5 expression with M2-like TAM density is a more reliable biomarker of patient survival than ILT5 expression alone. ILT5 knockout mitigates the reprogramming of TAM and T cell subsets toward immunosuppressive phenotypes and inhibits tumor growth in vivo. These findings highlight that ILT5 is a potential immunotherapeutic target and a promising prognostic biomarker for NSCLC.
Graphical Abstract
What's new?
Despite advances, the efficacy of current immune checkpoint inhibitor therapies remains suboptimal in non-small cell lung cancer due to the immunosuppressive tumor microenvironment. Here, ILT5 was found to be highly expressed in tumor-associated macrophages from non-small cell lung cancer tissues and associated with poor patient survival. ILT5 induced the M2-like polarization of tumor-associated macrophages, decreased CD8+T cells density, and induced Tregs accumulation, fostering an immunosuppressive tumor microenvironment. ILT5 knockout mitigated immune cell reprogramming toward immunosuppressive phenotypes and inhibited tumor growth. These findings highlight ILT5 as a potential immunotherapeutic target and a promising prognostic biomarker for non-small cell lung cancer.
1 INTRODUCTION
Immune checkpoint inhibitors (ICIs) targeting the PD-1/PD-L1 pathways have revolutionized the treatment of non-small cell lung cancer (NSCLC) in the last decade owing to the unprecedented durability of the tumor response.1-4 However, the survival benefits of ICIs for NSCLC remain limited.5 A meta-analysis of phase III clinical trials revealed that ICIs alone or in combination with chemotherapy decreased the risk of death by 20% in advanced NSCLC compared to chemotherapy alone.6 Even in patients with PD-L1 ≥50%, the 5-year overall survival (OS) rate of pembrolizumab treatment is 31.9% (less than one-third of the patients survived).7 The immunosuppressive tumor microenvironment (TME) is a major driver of ICI hyporesponsiveness. Tumors naturally shape an immune landscape dominated by immunosuppressive myeloid-derived populations, granulocytes, and regulatory T cells (Tregs), which consequently block T-cell infiltration, activation, and tumoricidal activity, thereby limiting the efficacy of ICIs.8, 9 Therefore, exploring novel and alternative targets that mediate immunosuppression in the TME is essential to develop combination strategies for enhancing the efficacy of ICIs.
Immunoglobulin-like transcript (ILT) 5, also known as lymphocyte immunoglobulin-like receptor B (LILRB) 3, is a negative modulator of the immune response and is mainly expressed in myeloid cells.10, 11 ILT5 contains four extracellular Ig-like domains and four cytoplasmic immunoreceptor tyrosine-based inhibition motifs (ITIMs) with immunosuppressive function.12 The mouse homologue of ILT5 is paired with immunoglobulin-like receptor B (PIR-B).13-16 Physiologically, ILT5 is expressed in dendritic cells (DCs), monocytes, macrophages, and granulocytes.12, 17-20 ILT5 impairs antigen presentation in DCs,18 decreases reactive oxygen species production and phagocytic activity of neutrophils,20 inhibits histamine release and inflammatory cytokine production by basophils,19 and downregulates MHC-II and CD80 expression in macrophages.21 However, ILT5 expression within the TME remains unclear. ILT5 has recently been detected in monocytes, granulocytes, and myeloid-derived suppressor cells (MDSCs) in the peripheral blood of cancer patients, and blockade of ILT5 prevented MDSC-mediated T cell immunosuppression.22 In patients with glioma, monocyte-derived tumor-associated macrophages (TAMs) show enriched ILT5 expression, which co-localizes with CD206 and correlates with the exhaustion phenotypes of T cells.23 Our research team was the first to report ILT5 expression in tumor cells. We found that ILT5 was enriched in colorectal cancer cells, inhibiting the infiltration of CD8+ T cells into the TME and directing the M2-like polarization of TAMs.24 However, the expression and function of ILT5 in NSCLC remain unknown.
In the current study, we identified that ILT5 is highly expressed in TAMs of NSCLC patients and predicts poor patient survival. Functionally, ILT5 polarizes TAMs toward an M2-like phenotype, which decreases the expression of T cells, especially CD8+T cells, and increases the accumulation of Tregs, leading to an immunosuppressive TME. The combination of ILT5 expression and the density of M2-like TAMs is a more reliable biomarker for patient survival than ILT5 expression alone. Notably, ILT5 (PIR-B) knockout mitigates the reprogramming of TAM and T cell subsets toward immunosuppressive phenotypes and inhibits tumor growth in vivo. Our study was the first to demonstrate high ILT5 expression in TAMs of NSCLC and identified ILT5 as a potential immunotherapeutic target and promising prognostic biomarker for NSCLC.
2 MATERIALS AND METHODS
2.1 Study population
This study included 55 NSCLC patients who had undergone lobectomy/sub-lobectomy and lymph node dissection at Shandong Cancer Hospital and Jinan Central Hospital between 2015 and 2016. The demographic characteristics of the participants are summarized in Table S1.
2.2 Multiplex immunofluorescence (mIF) detection
mIF staining was performed on NSCLC samples using a four-color fluorescence immunohistochemistry kit (abs50012, Absin, China). The formalin-fixed paraffin-embedded lung cancer tissues were sliced into 4-μm-thick sections. The slides were deparaffinized, rehydrated, and subjected to epitope retrieval by boiling in Tris-EDTA buffer (pH = 9) or citrate buffer (pH = 6) in a microwave oven at high heat and maintained for 15 min at low heat. Endogenous peroxidase activity was blocked using Antibody Diluent/Block for 10 min. Primary antibodies to CD3 (Abcam, ab699, 1:200), CD4 (Abcam, ab183685, 1:2000), CD8 (CST, 85336, 1:400), FOXP3 (Abcam, ab215206, 1:500), pan-cytokeratin (Abcam, ab7753, 1:500), CD68 (CST, 76437, 1:400), CD163 (CST, 93498, 1:500), and ILT5 (Immunaway, YN1914, 1:100) were incubated for 1 h at room temperature (20–25°C). Subsequently, anti-rabbit/mouse polymeric horseradish peroxidase was applied as a secondary label, with a 10-min incubation at room temperature. The slides were then incubated with fluorochromes (520, 570, and 650 nm wavelengths) diluted in amplification buffer for 10 min at room temperature. To prevent cross-reactivity, tissue slides were subjected to microwave antigen retrieval in Tris-EDTA buffer (pH = 9) or citrate buffer (pH = 6.0). Tissue slides were counterstained with 4′,6-diamidino-2-phenylindole and mounted using prolonged antifade mountant. All fluorescence-labeled slides were scanned using an OLYMPUS VS200 microscope (Olympus, Tokyo, Japan) at 40× magnification with appropriate exposure times, and five representative regions were selected for quantification at 20× magnification (0.1 mm2). The percentage of different cell subsets was determined as the ratio of positively stained cells to all nucleated cells per square millimeter.25 All images were independently reviewed by two senior pathologists before data export, with at least 20% of each visual field reviewed.
Receiver operating characteristic analysis was performed to determine the cutoff value for ILT5 levels. Based on the optimal cut-off index, ILT5 expression in TAMs was stratified into ILT5-low (≤0.0215) and ILT5-high (>0.0215). Similarly, high and low frequencies of M2-like macrophages (CD163+ and CD68+) and T cells subgroups, including CD3+, CD4+, CD8+, and FOXP3+ T cells, were classified according to their respective optimal cutoff scores.
2.3 Bioinformatics analysis in public databases
The GSE50081 dataset was downloaded from the gene expression omnibus (GEO) database to analyze the survival of NSCLC patients based on ILT5 expression. The correlation between ILT5 and the infiltration level of M2-like TAMs was analyzed using the TIMER2.0 online tool. The TISCH online tool was used to analyze ILT5 expression in different immunocytes within the TME.
2.4 Cells and lentivirus infection
The human acute monocytic leukemia cell lines (THP-1 RRID: CVCL_0006) and lung cancer cell line A-549 (RRID: CVCL_0023) were purchased from The Cell Resource Center of the Chinese Academy of Sciences (Beijing, China). All cell lines were authenticated using short tandem repeat profiling within the last 3 years. All experiments were performed using mycoplasma-free cells. Human peripheral blood mononuclear cells (PBMCs) were isolated from fresh whole blood donated by healthy volunteers using Ficoll-Paque density centrifugation. Human naïve CD3+ T cells were purified from PBMCs by negatively selecting EasySep T cell enrichment kits (StemCell Technologies, 50103). The purity of naïve T cells was >97%, as confirmed by flow cytometry. Naïve T cells were activated using anti-human CD3 (BioLegend, 317325)-precoated 6-well plates and cultured with RPMI-1640 solution containing 10% fetal bovine serum (FBS), 1 μg/mL anti-human CD28 (Biolegend, 302933) and 100 IU/mL recombinant human IL-2 (Pepro Tech, 200-02). For lentiviral infection, THP-1 cells were seeded in 6-well plates, and cultured with 100 nM phorbol myristate acetate (PMA) for 24 h. Subsequently, ILT5 overexpression (control and LV-ILT5) and knockdown (control shRNA and shILT5-1 or shILT5-2) lentiviruses were infected using HitransGP Reagents (Genechem, REVG005, Shanghai, China) at a multiplicity of infection of 10–20. After 72 h of infection, THP-1 cells were stimulated with A-549 conditioned medium (CM) to induce their differentiation into TAMs.
2.5 RNA extraction and real-time quantitative polymerase chain reaction (PCR)
THP-1 cells were harvested and RNA was extracted using a total extraction kit (AC0205-B; Sparkjade). Briefly, 1 μg total RNA was used to synthesize the cDNA using the Evo M-MLV RT Premix for quantitative PCR (Accurate Biology, AG11706). ILT5 mRNA expression in THP-1 cells was determined using the SYBR Green Premix Pro Taq HS qPCR kit (Accurate Biology, AG11701) and analyzed by the 2ΔΔCt method (normalized to beta-actin levels). Each experiment was performed in triplicate. Gene-specific primers used in this study are listed in Table S2.
2.6 Assessing the proliferation ability of T cell subsets using carboxyfluorescein succinimidyl ester (CFSE)
T cell proliferation was assessed using the CellTrace CFSE Cell Proliferation Kit (ThermoFisher, C34554). Briefly, pre-activated T cells were labeled with CFSE at a dilution of 1:1000. The labeled T cells were then cocultured with THP-1 cells (ILT5 up-/down-regulating) for 4 days. CFSE-labeled T cells were then stained with anti-human CD3-PercCP/Cyanine5.5 (BioLegend, 981008), anti-human CD4-PE-Cyanine7 (BioLegend, 317413), and anti-human CD8-APC (BioLegend, 300912). The percentage of dividing cells was analyzed using the FlowJo version 10.0 software (Tree Star).
2.7 Flow cytometry analysis
The proportions of TAM and T cell subsets were determined by flow cytometry after surface or intracellular staining with anti-mouse-specific or anti-humor-specific antibodies conjugated with various fluorescence. After treatment, interferon (IFN)-γ was stained with Cell Stimulation Cocktail plus protein transport inhibitors (eBioscience, 00-4975-93). The following anti-mouse and anti-human antibodies were used: APC/Cyanine7-anti-mouse-CD45 (BioLegend, 109824), FITC-anti-mouse-CD11b (BioLegend, 101206), PerCP/Cyanine5.5-anti-mouse-F4/80 (BioLegend, 123128), PE-anti-mouse-CD163 (BioLegend, 155307), FITC-anti-mouse-CD3 (BioLegend, 100204), PerCP/Cyanine5.5-anti-mouse-CD4 (BioLegend, 100434), PE-anti-mouse-FOXP3 (BioLegend, 320008), PE-anti-mouse-IFN-γ (BioLegend, 505808), PE-antihuman-CD80 (BioLegend, 305208), PE-anti-human-CD86 (BioLegend, 374206), APC-eFluor 780-anti-human-CD3 (eBioscience, 47-0038-42), eFluor 450- anti-human-CD4 (eBioscience, 48-0049-42), Alexa Fluor 700- anti-human-CD8 (BioLegend, 301028), PE-antihuman-FOXP3 (eBioscience, 12-4776-42), PE-antihuman-IFN-γ (BioLegend, 502509). The stained cells were analyzed on a FACS Calibur flow cytometer (BD Bioscience) and data were analyzed using FlowJo10.0 software (Tree Star).
2.8 In vivo studies
PIR-B gene knockout and wild-type C57BL/6 mice (6–8 weeks old) were purchased from Shanghai Model Organisms (Shanghai, China). All animal experiments were approved by the Institutional Animal Care Committee of Shandong First Medical University. The mice were subcutaneously injected with 2 × 10⁵ Lewis lung carcinoma cells (LLC RRID: CVCL_4358) into the right flanks. The LL/2 (LLC1) (RRID: CVCL_4358) is considered identical to the 3LL cell line (RRID: CVCL_5653). Tumor volumes were measured every 3 days using calipers and calculated as 0.5 × length×width2. The mice were sacrificed when tumors reached 2 cm in diameter. The tumors were then isolated and weighed. Immune cells were isolated from the peripheral blood, spleen, and tumors for further staining and analysis.
2.9 Statistical analysis
All statistical analyses were performed using SPSS version 26.0 (SPSS, Chicago, USA) and GraphPad Prism 8.0 software (GraphPad Software Inc., La Jolla, CA, USA). The correlation between ILT5 expression and immune cell density/clinicopathological variables was determined using Chi-squared/Fisher's exact test, as appropriate. Survival curves were plotted using the Kaplan–Meier method and analyzed with the log-rank test. Statistical significance was set at p <.05.
3 RESULTS
3.1 ILT5 is enriched in TAMs of NSCLC tissues, predicting poor patient outcomes
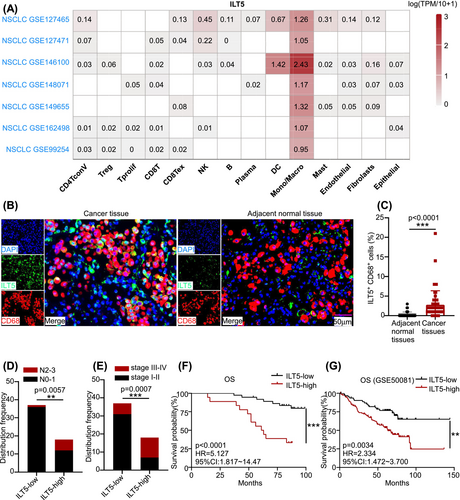
Given that ILT5 is a classical immunosuppressive molecule, we hypothesized that ILT5 is enriched in immune cells. To explore the localization of ILT5 in the TME, the TISCH online tool was used to determine the levels of ILT5 in different immune cell types. These data suggested that ILT5 was most abundant in monocytes and macrophages of the TME (Figure 1A). Subsequently, we determined ILT5 expression in TAMs in our patient cohort of 55 NSCLC patients who had undergone lobectomy/sub-lobectomy and lymph node dissection for lung cancer. ILT5 expression in TAMs was analyzed using mIF. Our findings revealed that ILT5 was enriched in CD68+TAMs and was mainly localized in the membrane and cytoplasm (Figure 1B). Further statistical analysis showed that ILT5 expression was considerably higher in TAMs than in adjacent normal tissues (Figure 1C). To determine the significance of ILT5 expression in TAMs, we evaluated the correlation between ILT5 levels and TNM stages. The results indicated that higher ILT5 expression in TAMs was correlated with increased lymph node involvement (Figure 1D) and advanced tumor stages (Figure 1E). Furthermore, we analyzed the correlation between ILT5 levels and patient survival, which indicated that patients with high ILT5 expression exhibited significantly poorer OS than those with low ILT5 expression (Figure 1F). These findings were further confirmed using the GEO database, which yielded consistent results (Figure 1G). Collectively, these results suggest that ILT5 is enriched in the TAMs of NSCLC and indicates advanced disease and poor prognosis.
3.2 ILT5 polarizes TAMs toward the M2-like phenotypes
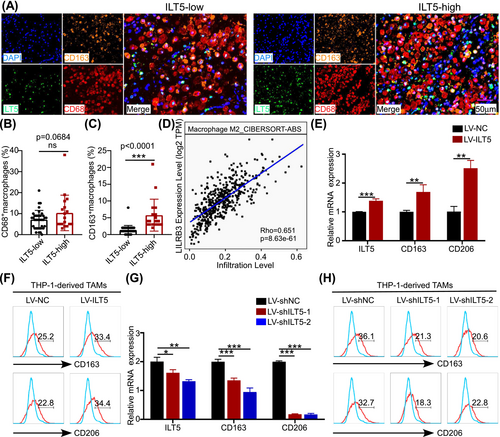
Given the high ILT5 expression in TAMs and their negative prognostic value, we aimed to determine the role of ILT5 in the recruitment and phenotypic plasticity of TAMs, which are two possible explanations for their immunosuppressive function.26 We determined the frequencies of both the CD68+ TAMs and CD163+CD68+ M2-like subsets. As shown in Figure 2A, B, no difference in the frequency of CD68+ macrophages was observed between the ILT5-high and ILT5-low groups. However, the proportion of M2-like TAMs was significantly higher in the ILT5-high group than in the ILT5-low group (Figure 2C). To validate this, we analyzed the relationship between M2-like macrophages and ILT5 levels using the TIMER2.0 database, which demonstrated a positive linear correlation (Figure 2D). These results suggest that ILT5 positively correlates with the M2-like polarization of TAMs. Using in vitro gain-of-function and loss-of-function assays, we validated the direct effects of ILT5 on polarizing TAMs. ILT5 overexpression in THP-1 cells significantly increased the mRNA levels of CD163 and CD206, the two main M2 markers for TAMs (Figure 2E). Moreover, CD163 and CD206 protein levels were also increased following ILT5 overexpression (Figure 2F). On the contrary, ILT5 knockdown in THP-1 cells markedly decreased the mRNA and protein levels of CD163 and CD206 (Figure 2G, H). Taken together, these results indicate that ILT5 in TAMs induces their M2-like phenotypes.
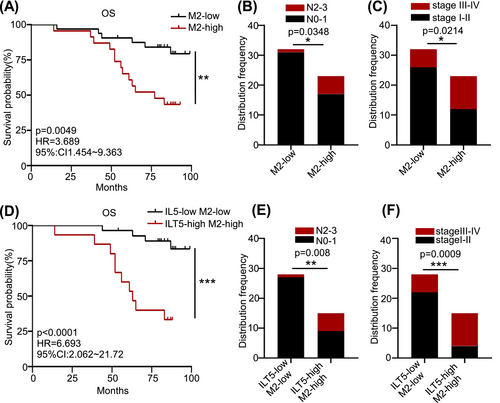
To determine the clinical significance of M2-like TAMs in NSCLC, we analyzed patient OS based on the density of CD163+ TAMs. As anticipated, patients with low M2-like TAMs had superior OS than those with high M2 (Figure 3A). Similarly, enriched M2-like TAMs predicted increased lymph node involvement (Figure 3B) and advanced tumor stages (Figure 3C). We combined ILT5 expression with the proportion of M2-like TAMs to evaluate their prognostic value. Patients with high ILT5 expression and enriched M2-like TAMs displayed remarkably poorer OS and a higher probability of regional lymph node metastasis and advanced TNM stages than those of their ILT5-low and M2-low counterparts (Figure 3D–F). Notably, the hazard ratio (HR) for OS was substantially higher using the combined biomarkers (HR = 6.693) than that using ILT5 expression (HR = 5.127) or M2-like TAM proportion (HR = 3.689) alone. These results suggest that TAM-derived ILT5 induces M2-like polarization and is an indicator of poor patient outcomes.
3.3 ILT5 in TAMs reprograms immunosuppressive T cell context
TAMs facilitate tumor progression through various mechanisms, including promotion of neoplastic cell survival, induction of angiogenesis, and mediating of immune escape.27 Because ILT5 induces the M2-like phenotype of TAMs, we clarified whether ILT5 in TAMs affects T cell immunity. We analyzed the number of T cell subsets in the ILT5-low and ILT5-high populations. Our findings revealed that T cell density (CD3+) was substantially higher in patients with low ILT5 levels in TAMs than those with high ILT5 expression (Figure 4A, B). Further subset analysis revealed that patients in the ILT5-low group had a higher proportion of CD4+ and CD8+ T cells but not Tregs (FOXP3+), than those in the ILT5-high group (Figure 4A, C–E). Next, we determined the distribution of different T cell subsets based on ILT5 levels and found that the proportion of CD4+ and CD8+ T cells in total T cells was comparable between the ILT5-low and ILT5-high groups (Figure 4F, G). However, the ratio of Treg cells to total T cells was markedly higher in ILT5-high patients than in ILT5-low patients (Figure 4H). These results suggested that ILT5 within TAMs decreased the number of T cells and increased the proportion of Treg cells in the TME.

Using in vivo TAM-T cell coculture assays, we further explored the underlying mechanisms of T cell subset alteration. THP-1 cells with ILT5 overexpression or knockdown were first induced into TAMs, and then co-cultured with naive T cells. ILT5 overexpression in TAMs inhibited the proliferation of CD3+, CD4+ and CD8+ T cells (Figure 4I) and decreased the secretion of IFN-γ in T cells (Figure 4J). In contrast, ILT5 knockdown in TAMs induced the proliferation of the aforementioned T cell subsets and increased IFN-γ secretion in T cells (Figure 4K, L). Furthermore, we examined the differentiation of T cell subsets upon coculturing with ILT5-modified TAMs. As shown in Figure 4M–O, ILT5 overexpression in TAMs did not alter the proportion of CD4+ and CD8+ T cells but upregulated that of FOXP3+ Treg cells. ILT5 knockdown in TAMs reduced the proportion of Treg cells rather than that of CD4+ and CD8+ T cells (Figure 4P–R). In summary, TAM-derived ILT5 restricts the proliferation and IFN-γ release of T cells, and induces Treg differentiation.
Additionally, we analyzed the predictive role of ILT5 levels and T cell subset density on patient outcomes. We found that the combination of high ILT5 expression in TAMs with low CD3+ (HR = 9.034), CD4+ (HR = 7.503), and CD8+ (HR = 17.66) T cell expression or high FOXP3+ T cell density (HR = 6.872) was powerfully associated with poor OS (Figure S1A–D) and advanced TNM stages (Figure S1E–H). The HR for OS was substantially higher when using combined biomarkers than when using ILT5 expression alone (HR = 2.334). Collectively, these results suggested that ILT5 reprogrammed the proliferation and differentiation of different T cell subsets, leading to an immunosuppressive T cell context and impaired survival.
3.4 PIR-B (ILT5 in mice) orchestrates immunosuppressive TME and promotes tumor growth in vivo
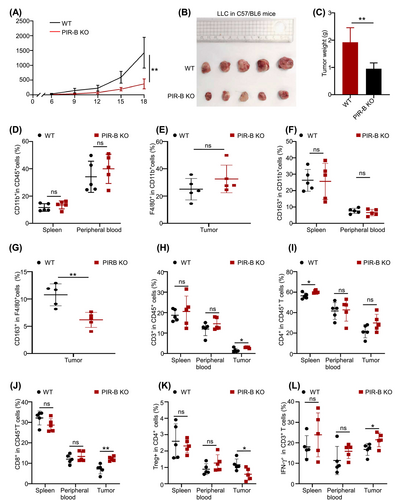
To confirm ILT5-regulated immunosuppression in vivo, we established tumor transplantation models using LLC cell lines derived from PIR-B knockout mice. PIR-B-knockout or wild-type C57BL/6 mice were subcutaneously injected with 2 × 10⁵ LLC cells into the right upper flanks. Tumor size was evaluated every 3 days after tumor inoculation. Mice were sacrificed when the tumor reached a maximum length of 20 mm, and then tumors were isolated and weighed. The results showed that tumor growth was considerably slower in PIR-B knockout mice than in wild-type mice (Figure 5A). Additionally, the final tumor size and weight were significantly decreased in PIR-B-knockout mice than in wild-type mice (Figure 5B, C). Furthermore, we determined the phenotypes and subsets of TAMs and T-cells within the TME. As anticipated, PIR-B knockout did not alter the number of CD11b+ monocytes in the spleen, peripheral blood, or F4/80+ TAMs in tumors (Figure 5D, E). However, the frequency of M2-like TAMs in the tumors, rather than in the spleen and blood of tumor-bearing mice, was significantly decreased following PIR-B knockout (Figure 5F, G). Next, we explored ILT5-regulated T cell expression and subset distribution within the TME. The results indicated that the proportion of CD3+T cells was significantly higher in tumors but not in the spleen or peripheral blood following PIR-B knockout (Figure 5H). Subset analysis revealed that PIR-B knockout increased CD4+T cells in the spleen and CD8+T cells in tumor tissues (Figure 5I, J), whereas reduced FOXP3+Tregs in the tumors (Figure 5K). In addition, the killing ability of tumor-infiltrating T cells, evaluated by the levels of IFN-γ, was enhanced by PIR-B knockout (Figure 5L). Taken together, these results indicated that ILT5 knockout reversed the immunosuppressive TAMs and T cell context, restricting tumor growth in vivo.
4 DISCUSSION
Lung cancer is the most fatal malignancies worldwide.28 NSCLC accounts for 80%–85% of all lung cancer cases and its treatment has gained widespread attention.29 Current ICI therapies targeting the PD-1/PD-L1 pathways have revolutionized NSCLC treatment30; however, their efficacy remains suboptimal. Most patients fail to respond to PD-1/PD-L1 inhibitors due to primary or acquired resistance.31-34 The immunosuppressive TME plays a critical role in ICI resistance by influencing both extrinsic and intrinsic resistance pathways.35 A comprehensive understanding of the underlying mechanisms, especially the key molecules involved in immunosuppression, is essential for developing novel immunotherapeutic and combination immunotherapies to improve ICI efficacy.
In the present study, we identified ILT5 as a key modulator of immunosuppression in the TME. ILT5 was highly expressed in the TAMs of NSCLC tissues and was associated with poor patient survival. Functionally, ILT5 induced the M2-like polarization of TAMs, decreased the density of T cells especially CD8+T cells, and induced Treg accumulation, leading to an immunosuppressive TME. Notably, ILT5 (PIR-B) knockout mitigates the reprogramming of TAM and T cell subsets toward immunosuppressive phenotypes, and inhibits tumor growth.
ILT5 is an inhibitory transmembrane receptor belonging to the ILT superfamily. ILT5 contains four ITIMs in the cytoplasm and acts as a negative checkpoint molecule for immune response.11 ILT5 has been predominantly reported in myeloid cells, including DCs, monocytes, macrophages, MDSCs, and granulocytes.12, 17-20 Ma et al. found ILT5 facilitated MDSCs differentiation.16 However, studies on the expression and function of ILT5 in TME are scarce. Recently, ILT5 expression has been detected in both tumor cells and immunocytes in the TME.14, 22-24, 36 ILT5 is enriched in acute myeloid leukemia cells, supporting their proliferation and survival and inhibiting T cell activity.14, 36 Our research team was the first to report ILT5 expression in solid tumor cells.24 We found that ILT5 in colorectal cancer cells prevented the accumulation of CD8+ T cells and directed the M2-like polarization of TAMs in the TME.24 Moreover, ILT5 expression has been identified in monocytes, granulocytes, and MDSCs from the peripheral blood of cancer patients, as well as in the TAMs in glioma patients.22, 23 ILT5 participates in MDSC-mediated T cell immunosuppression,22 and correlates with CD206 expression and T cell exhaustion phenotypes of T cells.23 These results indicate that ILT5 in both tumor and myeloid cells in the TME leads to immunosuppression and promotes tumor progression. However, the expression patterns and functions of ILT5 in NSCLC remain unknown. This study was the first to report that ILT5 is enriched in the TAMs of NSCLC, induces M2-like phenotypes of TAMs, and represses T-cell immunity. Our findings demonstrate that ILT5 is a negative regulator of anti-tumor immunity in NSCLC. Furthermore, ILT5 is a promising prognostic biomarker for NSCLC because of its effectiveness in predicting disease progression and survival.
TAMs are major components of the TME comprising up to 50% of the tumor mass in some cases, and their abundance is associated with poor clinical outcomes across various cancer types.37 TAMs are highly plastic, indicating that they can adapt to various phenotypes when modified by the TME they interact with.38 M1- and M2-like phenotypes represent the two extremes of TAM polarization. TAMs in the TME comprise a spectrum of subsets that co-express both M1 and M2 signature genes.39 M1-like TAMs act as pro-tumoral components via their capacity for phagocytosis and release of inflammatory cytokines, whereas M2-like TAMs act as an immune suppressors and tumor promoters.40 In addition to tumor progression, M2-like TAMs fundamentally contribute to ICI resistance by preventing effective anti-tumor immune responses. This combination of TAM modulation and ICIs allows targeting TAM intrinsic immunosuppressive functions and overcoming ICIs resistance.41 Our findings highlighted that ILT5 induces M2-like phenotypes in TAMs, which was associated with poor patient prognosis. Notably, ILT5 knockout restricted tumor growth in vivo. These findings suggest that ILT5 is a promising immunotherapeutic target for NSCLC treatment. Furthermore, ILT5 blockade may help overcome ICI resistance and enhance therapeutic efficacy. However, the underlying mechanisms of ILT5-manipulated polarization of M2-like TAMs require further exploration.
T cells, including CD4+ T cells, CD8+T cells and FOXP3 cells, play important roles in pro-tumor or anti-tumor immunity.42-44 Among them, CD8+ T cells and CD4+ T cells secrete various cytokines, such as TNF-α and IFN-γ, which suppress tumor progression.42, 45 Tregs are vital components of inhibitory T cells and are involved in immune evasion.46 Most human solid tumors exhibit high infiltration of Treg cells, which contributes to poor prognosis in cancer patients.47 Furthermore, FOXP3 level correlates with advanced regional lymphnode metastasis and TNM stages in lung cancer.48 Specific depletion or functional alteration of Treg cells can experimentally evoke effective tumor immunity.49 Our findings highlighted that TAM-derived ILT5 decreased the number of CD3+, CD4+, and CD8+T cells but increased the frequency of Tregs, creating an immunosuppressive T cell context for tumor survival and metastasis. ILT5 knockout reverses the immunosuppressive TME and holds promise as a potential therapeutic strategy for tumor eradication.
In conclusion, ILT5 was highly expressed in TAMs of NSCLC. ILT5 polarizes TAMs toward M2-like phenotypes, leading to an immunosuppressive T-cell context. Downregulation of ILT5 (PIR-B) prevents the reprogramming of TAM and T cell subsets toward immunosuppressive phenotypes and inhibits tumor growth in vivo. Our study was the first to report high ILT5 expression in TAMs of NSCLC and identified ILT5 as a potential immunotherapeutic target and prognostic biomarker for NSCLC.
AUTHOR CONTRIBUTIONS
Huijun Xu: Data curation; formal analysis; writing – original draft. Xuebing Fu: Data curation; formal analysis; writing – original draft. Shuyun Wang: Data curation; formal analysis; writing – original draft. Yihui Ge: Data curation. Lu Zhang: Data curation. Juan Li: Data curation. Fang Zhang: Data curation. Yang Yang: Data curation. Yifu He: Data curation. Yuping Sun: Data curation. Aiqin Gao: Conceptualization; methodology; supervision.
FUNDING INFORMATION
This work received grants from the Shandong Provincial Natural Science Foundation (ZR2021MH268), Jinan Science and Technology Innovation Program of Clinical Medicine (202134041 and 202225015), National Natural Science Foundation of China (82103340 and 82103466), Key R & D Program of Shandong Province (2022CXGC010510), Wu Jieping Medical Foundation (320.6750.2023-05-51), Health Commission of Anhui Province Scientific Research Project (NO.AHWJ2023BAc10031 and AHWJ2023A30183), Beijing Science and Technology Innovation Medical Development Foundation (KC2023-JX-0288-PQ88), Chinese Society of Clinical Oncology-Gilead Cancer Research Foundation (Y-Gilead2024-PT-0148).
CONFLICT OF INTEREST STATEMENT
The authors have no potential competing interests to declare.
ETHICS STATEMENT
The parents provided informed consent to participate in this study, which was approved by the review and ethics committee of Shandong Cancer Hospital and Jinan Central Hospital.
Open Research
DATA AVAILABILITY STATEMENT
The data sources and handling of the publicly available datasets used in this study are described in the Materials and Methods section. Further details and other data supporting the findings of this study are available from the corresponding author on request.


