Tumor-infiltrating gamma delta T-cells reveal exhausted subsets with remarkable heterogeneity in colorectal cancer
Abstract
The γδT-cells recognize infected or transformed cells. However, unlike αβT-cells, γδT-cells are innate-like immune cells, with no major histocompatibility complex restriction requirements. γδT-cells are the main population of intestinal intraepithelial lymphocytes (IELs) and are associated with the antitumor immune response, particularly in colorectal cancer (CRC). Although CD8+T-cells exhibit dysfunction and even exhaustion in the tumor microenvironment (TME), which contributes to tumor immune escape, whether the same applies to tumor-infiltrating (TI)-γδT-cells is not completely understood. Here, we sought to investigate the expression pattern of inhibitory receptors and functional state of TI-γδT-cells, and reveal the features of exhausted TI-γδT-cells in the CRC TME. We demonstrated that TI-γδT-cells exhibited exhaustion phenotypes and displayed more severe functional exhaustion than TI-CD8+T-cells or NK-cells in the TME of CRC. In addition, scRNA-seq analysis of TI-γδT-cells revealed three exhausted subsets with remarkable heterogeneity. The presence of three heterogeneous exhausted γδT-cell (Tex) populations, including Texprog, Textran and Texterm were further confirmed by flow cytometry, on the basis of PD-1 and TIM-3 expression. Finally, we revealed that c-Maf not only contributed to γδT-cell exhaustion via upregulation of inhibitory receptors, but also involved in the exhaustion of CD8+T and NK-cells. c-Maf may also be an important contributor to γδT-cell exhaustion in CRC patients. These findings indicated that TI-γδT-cells exhibit phenotypic and functional exhaustion in the CRC TME. The revealed features of exhausted TI-γδT-cells may provide help for understanding the mechanisms and the association of γδT-cell exhaustion with tumor development and pathogenesis.
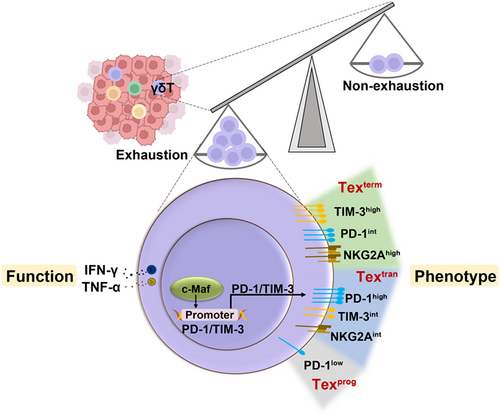
Graphical Abstract
What's new?
Innate-like immune γδT-cells infiltrate into human tumors of colorectal cancer and widely participate in the antitumor immune response. However, the immune landscape and functional states of tumor-infiltrating γδT-cells in the colorectal cancer tumor microenvironment remain unclear. In our study, tumor-infiltrating γδT-cells exhibited exhaustion phenotypes and displayed more severe functional exhaustion than tumor-infiltrating CD8+T-cells or NK-cells in the tumor microenvironment of colorectal cancer. scRNA-seq analysis demonstrated that the tumor-infiltrating γδT-cell population was heterogeneous, and that exhausted cells were the dominant subset. Moreover, transcriptional factor c-Maf promoted tumor-infiltrating γδT-cells exhaustion via the upregulation of inhibitory receptors.
Abbreviations
-
- AOM
-
- azoxymethane
-
- BFA
-
- brefeldin A
-
- ChIP
-
- chromatin immunoprecipitation
-
- CRC
-
- colorectal cancer
-
- DSS
-
- dextran sodium sulfate
-
- FACS
-
- fluorescence-activated cell sorting
-
- GTEx
-
- Genotype Tissue Expression
-
- ICB
-
- immune checkpoint blockade
-
- IEL
-
- intraepithelial lymphocyte
-
- IR
-
- inhibitory-receptor
-
- MLN
-
- mesenteric lymph node
-
- NK
-
- natural killer
-
- NKRs
-
- natural killer cell receptors
-
- OS
-
- overall survival
-
- PMSF
-
- phenylmethylsulfonyl fluoride
-
- scRNA-seq
-
- single-cell RNA sequencing
-
- Teff
-
- effector T-cell
-
- Tem
-
- effector memory
-
- Tex
-
- exhausted γδT-cell
-
- Texprog
-
- progenitor exhausted T-cells
-
- Texterm
-
- terminally exhausted T-cells
-
- Textran
-
- transitional exhausted T-cells
-
- TF
-
- transcriptional factor
-
- TI
-
- tumor-infiltrating
-
- TILs
-
- tumor-infiltrating lymphocytes
-
- TME
-
- tumor microenvironment
-
- Trm
-
- tissue-resident memory T
1 INTRODUCTION
An immunosuppressive environment leads to the exhaustion of immune cells.1 Immune checkpoint blockade (ICB) therapy can block the inhibitory signals and reverse immune exhaustion in the tumor microenvironment (TME). ICB therapy has achieved sustained immune responses in many cancers, including in a limited fraction of CRC cases. However, the vast majority of patients with CRC (85%) do not benefit from immunotherapy.2, 3
T-cell exhaustion is associated with progressive and hierarchical differentiation, characterized by the sustained upregulation and co-expression of several inhibitory receptors, specialized transcription mechanisms, metabolic dysregulation, increased chemokine expression and limited proliferative capacity.4 Emerging evidence has demonstrated that T-cell exhaustion is a continuous developmental process. Exhausted T-cells differentiate from progenitor or precursor exhausted T-cells (Texprog), via transitional or intermediate exhausted T-cells (Textran), into terminally exhausted T-cells (Texterm).5 In the TME, continued exposure to tumor antigens, coupled with TCF-1 down-regulation, tumor-specific CD8+T-cells undergo an altered differentiation process.6 Naive tumor-specific CD8+T-cells differentiate into Texprog cells that display stem-like properties, including proliferation and self-renewal. Texprog cells then differentiate into Textran cells, and ultimately Texterm cells, which have impaired proliferative capacity and cytotoxic function (eg, lower TNF-α and IFN-γ secretion).7 The process of Texprog cell differentiation into Textran and Texterm cells is unidirectional and is accompanied by phenotypic and functional changes.8 Texprog cells are reinvigorated by ICB, regaining their effector function and ability to control tumor progression. ICB also increases the proliferation and improves the function of Textran cells. However, Texterm cells are difficult to reactivate with ICB.6 In addition, the three exhausted T-cell subsets can be distinguished by their expression of several inhibitory receptors. Texprog cells have a PD-1loTim-3−Slamf6+ profile, Textran cells exhibit a PD-1loTim-3+CD101−KLRG-1+CX3CR1+ phenotype, and Texterm cells co-express PD-1 and Tim-3, in addition to multiple other inhibitory receptors such as CTLA-4, LAG-3, 2B4 and TIGIT.9
Multiple mechanisms, including transcription factor (TF) regulation, epigenetic manipulation and metabolic regulation are involved in the regulation of T-cell exhaustion.7, 10 Transcription regulation is one of the major factors controlling immune cell exhaustion in the TME.11 Several TFs are associated with exhaustion. For instance, IRF4, BATF, Foxo1, Blimp-1 and NFAT1 can indirectly bind on promoters of Pdcd1 (encoding PD-1), Havcr2 (encoding TIM-3) and Lag3 (encoding LAG-3) to upregulate their expression, thus contribute to T-cells exhaustion.11, 12 Moreover, IRF4, Blimp-1, NFAT1, NFAT-AP1, YY1 and BATF also bind on Il2 and Ifng promoters to regulate their expression.11 A pan-cancer single-cell landscape of TI-CD8+T-cells identified the top 10 universal TFs, including TOX, TOX2, RBPJ, ZBED2, PRDM1, VDR, IKZF4, BATF, STAT3 and IFI16, which were highly expressed in >80% of cancer types.13 Among these TFs, TOX and RBPJ were jointly expressed by exhausted, effector memory (Tem) and tissue-resident memory T (Trm) cells. The phenomenon that some TFs have overlapping or opposing functions in effector T-cell (Teff), Tem, Trm and Tex subsets is due to the heterogeneity that exists within these subsets, and especially among Tex cells.
γδT-cells are a unique group of lymphocytes whose T-cell receptors consist of a γ chain and δ chain, setting them aside from conventional αβ T-cells.14 By contrast to αβ T-cells, γδT-cells lack major histocompatibility complex restriction. Instead, γδT-cells bear a plethora of NK-cell receptors (NKRs), such as NKG2A, NKG2D, DNAM-1, NKp30 and NKp44 on their surface. These unique features enable γδT-cells to rapidly respond to infected or transformed cells, thus contributing to the first line of defense that precedes antigen-specific αβ T-cell responses.14 Low numbers of γδT-cells are found in peripheral blood and lymph nodes, as these cells predominantly reside in the mucosal and epithelial barriers.15, 16 Indeed, γδT-cells represent ~20% of the total lymphocyte population in the colonic mucosal epithelium.16, 17 Accumulating clinical studies have shown that γδT-cells infiltrate into many types of human tumors, including CRC, and widely participate in the antitumor immune response.18, 19 For example, they have been shown to completely eradicate CRC stem cells presensitized with zoledronate or low dose chemotherapy in vitro.20 It was also shown that the proportion of immunosuppressive Vδ1 γδT-cells increased significantly, while the proportion of cytotoxic Vδ2 γδT-cells decreased significantly in tumor infiltrating lymphocytes (TILs) from CRC patients.21 Compared to γδT-cells from adjacent normal colon tissue and peripheral blood, the colon TI-γδT-cells have a predominantly effector memory phenotype and a reduced capacity to produce IFN-γ.22
Given that γδT-cells are enriched in mucosal epithelial tissues, it is surprising that little is known about whether the progression of CRC or immune escape is related to the dysfunction of γδT-cells immune surveillance. To date, more attention has been paid to CD8+T-cell exhaustion. Whether γδT-cell exhaustion exists in the TME of CRC and the characteristics of these putative exhausted cells are still unclear. To address these questions, we examined the expression of inhibitory receptors associated with T-cell exhaustion by fluorescence-activated cell sorting (FACS). FACS analysis showed TI-γδT-cells expressed higher levels of several inhibitory receptors (PD-1, TIM-3 and VISTA) than TI-CD8+T-cells and NK-cells in TME of CRC. Single-cell RNA sequencing (scRNA-seq) was used to further characterize the phenotypes of exhausted TI-γδT-cells. We found that the exhausted γδT-cell population was heterogeneous and three different exhausted states were identified according to inhibitory receptor expression and transcriptional profiles. In addition, we identified c-Maf as a novel and potential candidate TF associated with γδT-cell exhaustion. In summary, our findings provide novel insights into the γδT-cells exhaustion landscape of CRC, which will aid the optimization of γδT-cell-based cancer immunotherapy.
2 METHODS
2.1 Animals and mouse models
Five- and 7-week-old male C57BL/6 mice were purchased from Beijing HFK Bioscience Co, Ltd (Beijing, China). TCRδ−/− mice were a gift from Dr. Zhinan Yin (Nankai University, China). All mice were housed in specific pathogen-free conditions. Further details can be found in the Data S1.
2.2 Cell lines
Mouse CRC cell line MC-38 (RRID: CVCL_B288) were obtained from National Infrastructure of Cell Line Resource (NICR). MC-38 was cultured in DMEM (Gibco, Thermo Fisher) supplemented with 10% fetal bovine serum (FBS) (Gibco, Thermo Fisher), at 37°C, 5% CO2. Cells were passaged after reaching 80% confluency. Confluent cells were detached using Hanks balanced salt solution (pH 7.4) containing 0.05% trypsin and 5 mM EDTA (Life Technologies, NY) and subcultured. All experiments were performed with mycoplasma-free cells.
2.3 Statistical analysis
All statistical analyses were carried out using GraphPad Prism 6 (GraphPad Software, San Diego, CA). Data sets were initially analyzed for Gaussian distribution with the D'Agostino-Pearson omnibus test. Data are presented as the mean ± SE of the mean (SEM). Differences between two groups were analyzed using the Student's t-test. Differences among multiple groups were analyzed by one-way analysis of variance (ANOVA). P-values <.05 were considered as a measure of statistical significance.
Additional materials and methods including antibodies and reagents used for flow cytometry (Table S1) and sequences of primers used for ChIP-qPCR (Table S2) are provided in the Data S1.
3 RESULTS
3.1 γδT-cell infiltration positively correlates with longer survival of patients with CRC
To investigate the role of γδT-cells in the pathogenesis and progression of CRC, we analyzed the correlation between lymphocyte infiltration and the progression of CRC, using RNA-seq data from TCGA database. Our analysis included data from 620 CRC tissues and 51 paracancerous tissues (Table S3). The relative abundance of different TILs was evaluated using the xCell webtool which is a gene signature-based method and can infer 64 immune and stromal cell types.23 The results showed that the immune score of CRC tumor tissues was lower than that of paracancerous tissues, indicating the presence of fewer TILs in tumor tissues (Figure 1A). We found that the relative abundance of γδT-cells was significantly higher while that of CD8+T-cells was significantly lower in tumor tissues than in paracancerous tissues (Figure 1B). There was no difference in the relative abundance of NK-cells between the tumors and paracancerous tissues.
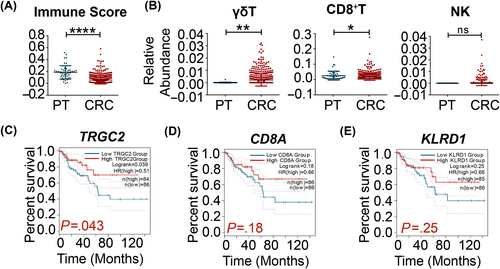
We correlated the numbers of different TILs and the OS of CRC patients. The results showed that the size of γδT infiltrations positively correlated with the OS of patients with the microsatellite stable (MSS) subtype of CRC (Figure 1C). In addition, there was no significant correlation between the extent of CD8+T-cell (Figure 1D) or NK-cell (Figure 1E) infiltrations and the OS of CRC patients. These data imply that γδT-cells play a critical role in the pathogenesis and progression of CRC.
3.2 γδT-cells exert antitumor functions in the AOM/DSS mouse model of colitis-associated cancer
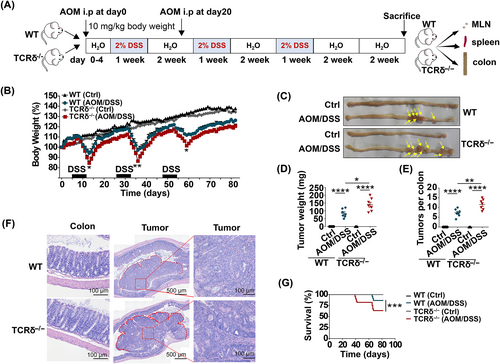
To further explore the importance of γδT-cells in CRC tumorigenesis, we established azoxymethane (AOM)/dextran sodium sulfate (DSS) mouse model of colitis-associated cancer (Figure 2A), which mimics human CRC.24 We found that TCRδ−/− mice experienced greater weight loss (Figure 2B) and developed significantly more tumors (Figure 2C) than WT mice. Moreover, the tumor numbers and tumor weights of AOM/DSS-treated TCRδ−/− mice were significantly higher than those of AOM/DSS-treated WT mice (Figure 2D,E). Histologic analysis of colon tissues revealed that AOM/DSS-treated TCRδ−/− mice exhibited high-grade dysplasia, inflammation and more severe mucosal damage than AOM/DSS-treated WT mice (Figure 2F). In addition, the survival of AOM/DSS-treated TCRδ−/− mice was significantly shorter than that of AOM/DSS-treated WT mice (Figure 2G). Collectively, these results demonstrate that γδT-cells play a protective role in the development and progression of CRC.
3.3 Tumor-infiltrating γδT-cells express high levels of several inhibitory receptors and exhibit functional exhaustion
To explore the immune state of γδT-cells in the TME of CRC, we evaluated the expression levels of inhibitory receptors on TI-γδT-cells. The FACS gating strategy is shown in Figure S1A. The expression levels of several inhibitory receptors, including PD-1, TIM-3, CTLA-4, LAG-3, TIGIT and VISTA on γδT-cells were all significantly higher in the tumor than in the spleen and the and MLN, or within the colon IEL population (Figure 3A). This was also confirmed in the subcutaneous MC-38 tumor model of CRC (Figure S1B). In addition, the ability of γδT-cells to produce IFN-γ or TNF-α was significantly lower in the tumor than in the spleen or the MLN (Figure 3B). IFN-γ production by tumor-derived γδT-cells was also lower than that of colon IEL-derived γδT-cells, implying that the antitumor function of TI-γδT-cells was markedly impaired (Figure 3B).
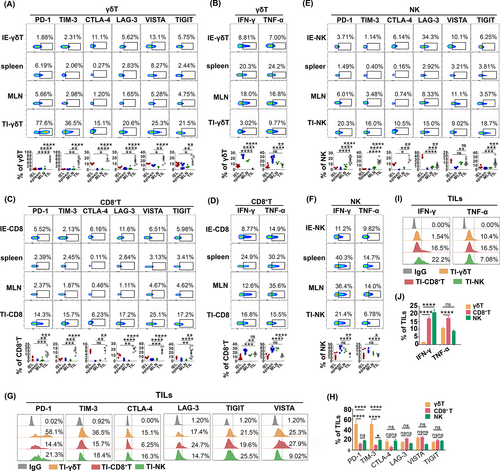
Except for CTLA-4, we also observed higher expression levels of PD-1, TIM-3, LAG-3, TIGIT and VISTA on CD8+T-cells in the tumor than on CD8+T-cells derived from the spleen, the MLN or colon IELs (Figure 3C). The ability of CD8+T-cells to produce IFN-γ or TNF-α was also significantly lower in tumors than in the spleen or the MLN (Figure 3D). However, IFN-γ production by tumor-CD8+T-cells was higher than that of colon-IEL-derived CD8+T-cells; no significant difference in the production of TNF-α was observed (Figure 3D). Except for LAG-3 and VISTA, the expression levels of PD-1, TIM-3, CTLA-4 and TIGIT on tumor-derived NK-cells were all significantly higher than on NK-cells from the spleen, the MLN or than on colon IELs (Figure 3E). In addition, the ability of tumor-derived NK-cells to produce IFN-γ or TNF-α was significantly lower than NK-cells from the spleen or the MLN (Figure 3F). We found that TI-γδT-cells, CD8+T-cells and NK-cells all exhibited exhausted phenotypes, which were characterized by the high expression of several inhibitory receptors. Notably, γδT-cells expressed much higher levels of PD-1, TIM-3 and VISTA (Figure 3G,H) and produced lower levels of IFN-γ and TNF-α than the CD8+T-cells or NK-cells (Figure 3I,J). Taken together, these results suggest that TI γδT-cells experience more serious functional exhaustion in the TME of CRC than CD8+T-cells and NK-cells.
3.4 scRNA-seq analysis of exhausted tumor-infiltrating γδT-cells
To better characterize the phenotypes of exhausted TI-γδT-cells, γδT-cells were FACS-sorted from the tumor and the colonic IEL population. The γδT-cells were then subjected to scRNA-seq using the 10× Genomics platform. The sequencing coverage and quality statistics for each sample are summarized in Table S4. In total, 6562 and 7006 single γδT-cells were obtained from the tumor and colon IEL population, respectively, for scRNA-seq analysis after strict quality filtering (Figure 4A). On generating a UMAP diagram, we discovered that there was a marked difference in the special distributions of TI-γδT-cells and IE-γδT-cells, with only a small area of overlap, which indicates that there was a big difference between the TI- and IE-γδT-cells (Figure 4B). These cells also had different gene expression profiles (Figure 4C). Specifically, TI-γδT-cells expressed higher levels of inhibitory receptor genes including Pdcd1 (encoding PD-1), Ctla4 (encoding CTLA-4), Havcr2 (encoding TIM-3), Btla (encoding BTLA) and Klrc1 (encoding NKG2A), and lower levels of the activatory receptor gene Cd69 and the co-stimulatory genes Cd27 and Tnfrsf18 than IE-γδT-cells (Figure 4C,D).
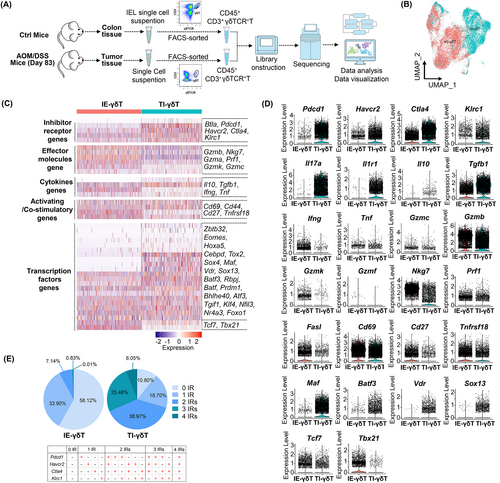
TI-γδT-cells expressed lower levels of genes associated with cytotoxicity (including Gzmb, Nkg7, Gzma, Prf1, Gzmk and Gzmf) and proinflammatory cytokine production (including Ifng and Tnf) than IE-γδT-cells. The TI-γδT-cells, however, expressed higher levels of the anti-inflammatory cytokine genes Il17a, Il10 and Tgfb1 (Figure 4C,D). We also found that TI-γδT-cells expressed higher levels of TF-encoding genes, including Zbtb32, Eomes, Hoxa5, Cebpd, Tox2, Sox4, Maf, Vdr, Sox13, Batf3, Rbpj, Batf, Prdm1, Bhlhe40, Atf3, Tgif1, Klf4, Nfil3, Nr4a3 and Foxo1 than IE-T-cells (Figure 4C,D); the high expression of these genes is typically associated with T-cell exhaustion.13, 25 In addition, TI-γδT-cells expressed lower levels of genes encoding TFs such as Tcf7 and Tbx21 than IE-γδT-cells; the low expression of these TFs is typically observed in exhausted T-cells.26 We then analyzed the co-expression of four inhibitory-receptor (IR)-encoding genes (Pdcd1, Ctla4, Havcr2 and Klrc1) in IE- and TI-γδT-cells. The results showed that TI-γδT-cells contained a higher amount of γδT-cells with co-expression of multiple IR genes compared to IE-γδT-cells (38.97% vs 7.14% co-expressing 2 IRs; 25.48% vs 0.83% co-expressing 3 IRs; 6.05% vs 0.01% co-expressing the 4 IRs; Figures 4E and S2A). Thus, TI-γδT-cells expressed more exhaustion-related IR-encoding genes than IE-γδT-cells.
To further characterize TI-γδT-cells, we annotated eight clusters, which included eight different cell types with different gene expression profiles (Figure 5A). We performed a preliminary annotation of the cell types in each cluster, based on their gene expression signatures (Figures 5B and S2B). Cluster 1 was characterized by the high expression of Cd28, Lef1, S1pr1, Klf2, Ccr7 and Sell (Figure S2B), which are known as “naive” cell-related genes.27 Cluster 2 was characterized by low levels of S1pr1, Sell and Klf2 and high levels of Itgae (encoding CD103), Prdm1, Ptger4, Itga1 (encoding CD49a) and Cxcr6, indicating that this cluster may represent Trm cells (Figure S2B). Cluster 3 was characterized by the high expression of cytotoxicity-related genes, including Ifng, Gzmk, Fasl, Gzmb, Gzma, Prf1 and Nkg7 (Figure S2B). Cluster 7 was identified by the high expression of Hmgn2, Rrm2 and Mki67 (Figure S2B), which is characteristic of cycling cells.27 Cluster 8 could not be characterized because of the insufficient number of cells (only 20) in this cluster.
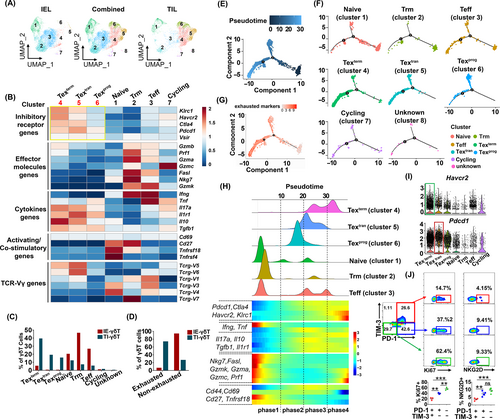
Compared to the clusters mentioned above (clusters 1, 2, 3 and 7), three exhausted γδT-cells clusters (clusters 4, 5 and 6) were characterized by the high expression of exhaustion-related genes (eg, Klrc1, Havcr2, Ctla4, Pdcd1 and Vsir) and anti-inflammatory-cytokine-encoding genes (eg, Il10, Tgfb1, Il17a and Il1r1), and the low expression of cytotoxicity-related genes (eg, Gzmb, Prf1, Gzma, Gzmc, FasL, Nkg7 and Gzmk) and proinflammatory-cytokine-related genes (eg, Ifng and Tnf) (Figure 5B). By comparing the features of the three exhausted γδT-cells clusters, the Texprog subset (cluster 6) was identified by the low expression of Klrc1, Havcr2, Ctla4 and Vsir; the Textran subset (cluster 5) was identified by the high expression of Pdcd1 and Il1r; while, the Texterm subset (cluster 4) was identified by the high expression of Havcr2, Klrc1, Ctla4, Il17a and Il10 (Figure 5B). The Textran and Texterm clusters showed high usage of Trcg-V5 and Trcg-V6 (Figure 5B). The proportions of each of the 8 clusters in relation to each other are shown in the Figure 5C. Texprog, Textran and Texterm clusters comprised a large proportion of the TI γδT-cell population (40%, 19% and 16%, respectively). While the Teff, Trm and naive clusters made up a larger proportion of the IE-γδT-cell population (46%, 26% and 20%, respectively) (Figure 5C). In conclusion, 75% of the TI-γδT-cells were exhausted cells (Texprog, Textran, Texterm), while 92% of the IE-γδT-cells were nonexhausted cells (Figure 5D). Taken together, these results suggest that TI-γδT-cells are a heterogeneous cell population, dominated by exhausted cells subsets.
T-cell exhaustion is a dynamic process, accompanied by the progressive loss of effector function.10 We therefore next focused on exploring the dynamic immune states of TI-γδT-cells to visualize their differentiation trajectories using the Monocle algorithm, which uses reversed graph embedding to describe multiple fate decisions in a fully unsupervised manner.28 Specifically, we took naive-like cell-related genes (eg, Cd28, Lef1, Ccr7, Sell, S1pr1 and Klf2) as the starting point of the pseudotime to reconstruct the differentiation trajectory of TI-γδT-cells. This trajectory analysis revealed two main bifurcations from cluster 1 to cluster 8. The pseudotime analysis showed that cells in the naive T-cell and Trm clusters were at the beginning of the trajectory, whereas the cells in Texprog, Textran and Texterm clusters were at the end of trajectory (Figure 5E,F). In addition, the exhausted signature was upregulated along the pseudotime of γδT-cell exhaustion (Figure 5G), whereas the other signatures (naive, cytotoxic, costimulatory and resident) were downregulated (Figure S2C). Based on the transcriptional changes associated with different transitional states, γδT-cell clusters could be categorized into four phases (Figure 5H). Phase 1 predominantly included the naive, Teff and Trm clusters. The genes (Nkg7, Fasl, Gzmk, Gzma, Gzmc, Prf1, Ifng and Tnf) of phase 1 were downregulated along the pseudotime of γδT-cell exhaustion, matching the phenotypes of Teff and Trm subsets. Cells in phase 2 expressed low levels of Havcr2, Pdcd1, Ctla4 and Klrc1, matching the phenotypes of the Texprog subset. Cells in phase 3 exhibited intermediate expression of Havcr2, Ctla4 and Klrc1 and high expression of Pdcd1, Il10 and Il1r1, matching the phenotypes of the Textran subset. Phase 4 represented genes (Havcr2, Ctla4, Klrc1 and Il17a) upregulated at the termination, matching the phenotypes of Texterm subset (Figures 5H and S2D).
Given that Havcr2 expression was upregulated in the Texterm subset and Pdcd1 was upregulated in the Textran subset (Figure 5I), suggested that the expression of these genes was tightly correlated with γδT-cell exhaustion. Thus, we hypothesized that different exhaustion states of γδT-cells could be investigated based on their PD-1 and TIM-3 expression. To test our hypothesis, TI-γδT-cells isolated from AOM/DSS-treated mice were analyzed by FACS and subgated into four populations based on their expression of PD-1 and TIM-3; they were categorized into the subsets PD-1+TIM-3+, PD-1+TIM-3−, PD-1−TIM-3+ and PD-1−TIM-3− γδT-cells. Among these subsets, the numbers of PD-1−TIM-3+ γδT-cells were too low to be analyzed. The PD-1+TIM-3+ γδT-cells expressed lower levels of Ki67 (a proliferation marker) and NKG2D (an activation marker) than the PD-1−TIM-3− and PD-1+TIM-3− γδT-cells, meaning that the three subsets could be arranged in the following order of decreasing exhaustion severity: PD-1+TIM-3+ > PD-1+TIM-3− > PD-1−TIM-3− (Figure 5J). According to this hierarchy, the PD-1+TIM-3+ γδT-cells were a terminally exhausted population, which matched the phenotype of the Texterm subset we had identified, while PD-1+TIM-3− γδT-cells were a transitory exhausted population, matching the phenotype of the Textran subset.
Collectively, these scRNA-seq and FACS data demonstrated that the TI-γδT-cells were a heterogeneous cell population comprising cells with multiple different differentiation stages and characteristics. The terminally exhausted γδT-cells were defined as expressing high and sustained levels of PD-1 and TIM-3.
3.5 Transcription factor c-Maf is involved in the regulation of inhibitory receptor expression and contributes to γδT-cell exhaustion
Several TFs regulate T-cell exhaustion by promoting the expression of inhibitory receptors.10 To explore the regulatory factors that promote γδT-cell exhaustion, we analyzed the expression of TFs in the three Tex subsets. We found that the Texprog cluster was characterized by the high expression of Rbpj, Batf3, Vdr, Batf and Nr4a1 (Figure 6A). The Textran and Texterm clusters both expressed the TF-encoding genes Bhlhe40, Maf, Nfil3 and Nr4a3 (Figure 6A). In addition, we discovered that Tcf7 (encoding TCF1) expression was downregulated along the pseudotime of γδT-cell exhaustion (Figure 6B), which was in line with previous reports.26 Of note, the expression of some TF-encoding genes (Maf, Bhlhe40, Nfil3, Rbpj, Batf3, Nr4a3 and Batf) was upregulated along the pseudotime of γδT-cell exhaustion, especially Maf (encoding c-Maf) (Figure 6B).
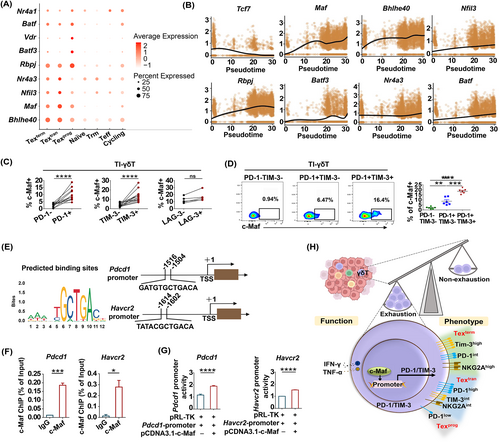
To further identify the role of c-Maf in the regulation of inhibitory receptor expression in γδT-cells, we used FACS to evaluate c-Maf expression and correlated it with the severity of TI-γδT-cell exhaustion. We found that c-Maf expression was higher in the PD-1+ and TIM-3+ γδT-cells compared to PD-1− γδT-cells and TIM-3− γδT-cells (Figure 6C). Further, c-Maf expression was higher in PD-1+TIM-3+ γδT-cells than that in the PD-1−TIM-3− and PD-1+TIM-3− γδT-cell subsets (Figure 6D). We thus arranged these populations in order of increasing c-Maf expression: PD-1−TIM-3− < PD-1+TIM-3− < PD-1+TIM-3+ (Figure 6D), which suggested that c-Maf expression was correlated with the severity of TI-γδT-cell exhaustion. Further, we observed similar correlation in CD8+T and NK-cells (Figure S3A-D), implying that c-Maf may be a common TF mediating exhaustion of γδT-cells, CD8+T-cells and NK-cells.
To explore whether c-Maf directly regulated the expression of PD-1 and TIM-3 on γδT-cells, we used the JASPAR database (used to predict TF binding sites) and the UCSC database (used to identify gene promoter regions) to show that there were c-Maf binding sites ~2 kb upstream of the transcription start site (TSS) on the mouse IR genes promoters, not only Pdcd1 and Havcr2 (Figure 6E), but also involves Ctla4, Lag3, Tigit, Vsir, Cd160 and Cd244 (Figure S4). To establish whether c-Maf binds to Pdcd1 and Havcr2 promoters, a chromatin immunoprecipitation (ChIP) assay was performed. It showed that the anti-c-Maf antibody efficiently precipitated the promoter fragments of both Pdcd1 and Havcr2, whereas the IgG control did not (Figure 6F), suggesting that c-Maf directly bound to the Pdcd1 and Havcr2 promoters. Furthermore, the luciferase reporter assay showed that c-Maf activated Pdcd1 and Havcr2 gene transcription (Figure 6G). These results suggested that by binding to the promoters of Pdcd1 and Havcr2 directly, c-Maf facilitated the expression of these genes and induced the functional exhaustion of γδT-cells.
Furthermore, we examined whether c-Maf binding motifs exist in human IRs genes, by using the JASPAR and UCSC database we found that there were c-Maf binding sites ~2 kb upstream of the transcription start site (TSS) on the human IR genes promoters, including PDCD1, HAVCR2, CTLA4, LAG3, TIGIT, VSIR, CD160 and CD244 (Figure S5). We further evaluated the association between c-Maf expression and the levels of IRs in the lymphocytes of CRC patients, using previously published scRNA-seq data.29 TILs such as γδT-cells, CD8+T-cells and NK-cells were identified using the t-SNE dimensional analysis (Figure S6A). We observed that these TI-γδT-cells, CD8+T-cells and NK-cells upregulated different inhibitory-receptor-encoding genes. TI-γδT-cells upregulated PDCD1 and CTLA4 (Figure S6B); TI-CD8+T-cells upregulated HAVCR2, PDCD1 and CTLA4 (Figure S6C); while TI-NK-cells upregulated TIGIT and LAG3 (Figure S6D). Importantly, we found that TI-γδT-cells, CD8+T-cells and NK-cells had different TF expression profiles. For instance, MAF, NR4A3 and SOX4 were highly expressed in TI-γδT-cells (Figure S6E), whereas ATF3, MAF and BATF were higher expressed in TI-CD8+T-cells (Figure S6F), and PRDM1 and BATF expression was higher in TI-NK-cells (Figure S6G). Furthermore, we analyzed the relationship between the expression of MAF and that of inhibitory-receptor-encoding genes (eg, PDCD1, HAVCR2 and CTLA4) in CRC tissues from the TCGA database (n = 620). We found that MAF expression positively correlated with PDCD1, HAVCR2 and CTLA4 expression, which implied that c-Maf may be a key TF in the regulation of inhibitory receptor expression in γδT-cells and thus contribute to their exhaustion in the TME of CRC (Figure S6H).
4 DISCUSSION
As innate-like lymphocytes, γδT-cells are key orchestrators of immune defense and surveillance against infection and tumorigenesis. γδT-cells are important constituents of the TIL population, and therefore have the potential to improve cancer immunotherapy.18, 30 T-cell exhaustion is a major obstacle to the efficacy of immunotherapy.31 While research has largely focused on CD8+T-cell and NK-cell exhaustion, it remains unclear whether γδT-cell exhaustion exists in the TME of CRC. It is therefore necessary to better characterize the phenotypes and functions of γδT-cells in the TME. In the present study, we showed that TI γδT-cells expressed high levels of multiple inhibitory receptors, which was associated with exhaustion. Further, we demonstrated that γδT-cell exhaustion is a continuous process and that exhausted γδT-cell populations are heterogeneous. In addition, we revealed that c-Maf was involved in the regulation of inhibitory receptor expression in γδT-cells and therefore contributed to their exhaustion (Figure 6H).
The exhaustion of γδT-cells has received considerably less attention than CD8+T-cell or NK-cell exhaustion, and research on γδT-cells exhaustion in tumors has only begun. A recent study of acute myeloid leukemia (AML) identified the present of exhausted Vδ2+ T-cells, characterized by elevated PD-1 expression and reduced NKG2D expression.32 Analogous to the observations in AML, Vδ2+ γδT-cells from the peripheral blood of patients with breast cancer also exhibited an exhausted, PD-1+ phenotype.33 Meanwhile, Vδ1+ γδT-cell cells expressed higher levels of TIGIT, PD-1 and TIM-3 than Vδ2+ γδT-cells in patients with ovarian cancer.34 A recent report highlighted that CD8αα−PD-1+ γδT-cells express reduced levels of cytotoxicity-related genes in the AOM/DSS-induced cancer mouse model.35 In the present study, we performed we analyzed the expression of several inhibitory receptors on TI-γδT-cells. In line with the observations mentioned above, our data showed that TI-γδT-cells highly expressed a multitude of inhibitory receptors, including PD-1, TIM-3, TIGIT, LAG-3, CTLA-4 and VISTA. Moreover, TI-γδT-cells exhibited functional exhaustion, demonstrated by their reduced ability to produce IFN-γ and TNF-α.
Heterogeneity was identified as a universal feature of exhausted CD8+T-cells in different kinds of tumors.36 By studying the underlying developmental, transcriptional and epigenetic regulatory relationships, the process of CD8+T-cell exhaustion was divided into several stages, including Texprog, Textran and Texterm.6 For example, exhausted CD8+T-cells are divided into four development stages (Texprog1, Texprog2, Textran[int] and Texterm) according to their expression of Ly108 and CD69; moreover, these subsets are regulated by different TFs.26 In the present study, we used scRNA-seq to show that, like exhausted CD8+T-cells populations, the exhausted TI-γδT-cells populations in mouse CRC model were also heterogeneous. In addition, γδT-cells exhaustion was also a continuous process, which included three differentiation stages with distinctive features: the Texprog subset was marked by low Pdcd1 and Havcr2 expression; the Textran subset was marked by high Pdcd1 levels and intermediate Havcr2, Ctla4 and Klrc1 expression; and the Texterm subset was marked by high Havcr2, Ctla4, Klrc1 and Pdcd1 expression. These gene expression signatures were further confirmed by protein expression analysis. In the exhausted γδT-cell population, the phenotypic and functional characteristics of PD-1+TIM-3+ γδT-cells were similar to those of exhausted CD8+T-cells. Several lines of evidence demonstrate that terminally exhausted CD8+T-cells co-express high levels of PD-1 and TIM-3.37-41 For example, in the B16F10 melanoma model, TI-CD8+T-cells differentiate from a progenitor state (PD1loTim3−) to a terminally exhausted state (PD1hiTim3+).37 Moreover, the increase in PD-1+TIM-3+ CD8+T-cell number positively correlated with T-cell dysfunction in patients with AML.41 Analogous to the observations in AML, a higher proportion of PD-1+TIM-3+ CD8+T-cells was associated with a worse clinical outcome in gastrointestinal cancer.39 A recent study found that the exhausted CD8+T-cell population comprised TIM-3−PD-1−, TIM-3−PD-1+ and TIM-3+PD-1+ subsets. Among these subsets, the TIM-3+PD-1+CD8+T-cells were enriched in the Texhi population, which was associated with a favorable outcome, while TIM-3−PD-1− CD8+T-cells were enriched in the Texlow population in patients with MSS CRC.38
Multiple TFs participate in the regulation of γδT-cells exhaustion. Accumulating evidence has shown that the differentiation and maintenance of exhausted CD8+T-cells are regulated by specific TF networks10, 11, 13, 42 (eg, Blimp-1, Foxo1, Nfil3, IRF4, BATF, NFATc1, NR4A, TOX, TCF1, Eomes, T-bet, Rbpj and Vdr), which play important roles in the regulation of CD8+T-cells exhaustion. However, limited information is available on the TF-mediated regulation of γδT-cells exhaustion. The same TFs likely also modulate inhibitory receptor expression and thus contribute to γδT-cell exhaustion. Consistent with the findings in exhausted CD8+T-cells, we noted that several TF-encoding genes (Zbtb32, Eomes, Hoxa5, Cebpd, Tox2, Sox4, Maf, Vdr, Sox13, Batf3, Rbpj, Batf, Prdm1, Bhlhe40, Atf3, Tgif1, Klf4, Nfil3, Nr4a3 and Foxo1) were highly expressed in TI-γδT-cells. A recent study of pan-cancer showed that Tox2, Vdr, Rbpj, Batf and Prdm1 were among the top 10 universal TFs expressed in TI-CD8+T-cells.13 The Textran and Texterm subsets had similar transcriptional profiles (Bhlhe40, Maf, Nfil3 and Nr4a3). While the TF-encoding genes Rbpj, Batf3, Vdr and Batf were expressed in the Texprog subset, revealing the finer mechanisms of immune exhaustion regulation. Among the highly expressed TFs, we showed that c-Maf promotes γδT-cells exhaustion. c-Maf is a basic leucine zipper (b-Zip) TF, belonging to the AP-1 family.43 A previous study reported the c-Maf is a universal regulator of Tγδ17 cell differentiation and maintenance.44 c-Maf also controls immunosuppression by regulating the metabolic reprogramming and effector functions of M2-like macrophages.45 Furthermore, c-Maf and Prdm1 jointly regulate the expression of several inhibitory genes on CD8+T-cells.46 Another more recent study reported that c-Maf expressed in CD8+T-cells induced PD-1 expression and IL-10 production in patients with multiple sclerosis, and demonstrating that c-Maf is a potential major regulator of the gene module, including multiple coinhibitory molecules.47 Here, we reported that c-Maf promoted γδT-cell exhaustion by directly up-regulating the expression of inhibitory receptors (PD-1 and TIM-3). However, there remains possibility that c-Maf might also contribute to γδT-cell exhaustion by up-regulating other inhibitory receptor molecules, such as CTLA-4, LAG-3, TIGIT, VISTA, CD160 and 2B4 as previously reported.46 We found c-Maf was not only involved in exhaustion of γδT-cells, but also involved in exhaustion of CD8+T and NK-cells, which is consistent with a previous report identifying Maf was a driver of CD8+T-cell exhaustion in autochthonous melanoma.48 Importantly, the critical contribution of c-Maf in regulation of exhaustion-related molecules were also observed in human studies. There are c-Maf binding motifs in multiple human inhibitory molecule genes, including PDCD1, HAVCR2, CTLA4, LAG3, TIGIT, VSIR, CD160 and CD244, suggesting c-Maf may also play key roles in regulating human immune checkpoint molecules. Moreover, using data from CRC patients, we demonstrated that c-Maf was positively associated with the expression of several inhibitory receptors. This implies that c-Maf may also be an important contributor to γδT-cell exhaustion in patients with CRC. Therefore, the selective modulation of c-Maf and other exhaustion-associated TFs may inhibit the cellular differentiation program, which leads to the generation of exhausted γδT-cells, thereby enhancing the antitumor potential of γδT-cells.
Our study confirms that TI-γδT-cells exhibit phenotypic and functional exhaustion. Exhausted γδT-cell populations are heterogeneous. c-Maf may be a potential candidate TF, which is involved in the regulation of γδT-cell exhaustion. These results will be helpful to clarify the mechanisms of γδT-cell exhaustion and their association with tumor development and pathogenesis, which will inform the design of new γδT-cell-based cancer immunotherapies.
AUTHOR CONTRIBUTIONS
Cai Zhang: Conceived and supervised the study, designed experiments, analyzed data, wrote the article and obtained funding and study supervision. Nan Lu: Designed experiments, analyzed data, provided guidance and suggestions for the study. Linyan Yu: Acquisition of data, interpretation of data, statistical analysis and drafting of the article. Zhaozhong Wang: Performed some experiments. Yanan Wang: Performed some experiments; Yuan Hu: Analyzed and interpreted data. All authors read and approved the final article. The work reported in the article has been performed by the authors, unless clearly specified in the text.
ACKNOWLEDGEMENTS
We thank Translational Medicine Core Facility of Advanced Medical Research Institute, Shandong University for consultation and instrument availability that supported this work.
CONFLICT OF INTEREST STATEMENT
The authors declare that they have no competing interests.
ETHICS STATEMENT
All experimental procedures involving mice were approved by the Institutional Animal Care and Use Committee of the Shandong University (Jinan, China), with the approval number 2017-D023. Animal Research Reporting of In Vivo Experiments (ARRIVE) guidelines were used.
Open Research
DATA AVAILABILITY STATEMENT
The raw scRNA-seq data are deposited in the Gene Expression Omnibus database under accession number GSE229163. Other data that support the findings of our study are available from the corresponding author upon request.


